
Dow Theory, or How Technical Analysis Appeared
 Good afternoon, trader friends!
To fully comprehend the progress achieved, it is sometimes useful to return to the very basics. Today, technical analysis is taken for granted, and few people think about what really lies behind the well-known market terms. Dow Theory, and Charles Dow himself in particular, can be said to have stood at those very foundations. At the same time, the postulates of the theory have not lost any of their relevance to this day. How they can be applied in practical market work, particularly in forex, is the subject of our material today.
At the dawn of the formation of financial markets, suitable automatic tools did not yet exist, and most analytical work was done manually for a long time. That is why the description of the theory pays such close attention to details, whereas today many details are commonly omitted.
A Brief Biography of Charles Dow
Dow's first job in the financial sphere was as a reporter for the Wall Street News Bureau. There he also met his partner, Edward Jones. Unlike most other journalists, their work was marked by straightforwardness: Dow and his partner refused on principle to take bribes.
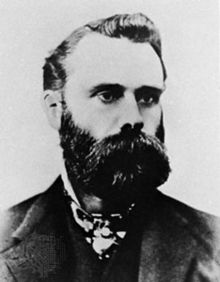 In 1882, Dow and Jones felt the need for a separate publication. So they founded their own company, Dow Jones & Company, which at first produced daily financial reports.
Later, the two-page bulletin grew into a full-fledged newspaper, The Wall Street Journal, which is now one of the most authoritative publications in the financial world. The publication's slogan stated that its main goal was to tell the news, not opinions.
By 1893, many mergers were taking place, which increased the share of speculative operations in the markets. At that time, Dow saw the need for some indicator of market activity. Thus the Dow Jones Industrial Index was created, which at that time was a simple arithmetic average of the prices of 12 companies (at present it covers the 30 largest U.S. companies).
Dow noticed that prices contain far more information than many assume. That is, by analyzing prices alone, we can predict their future behavior with a high degree of probability, which ultimately became the basis of his theory.
The Postulates of Dow Theory

The price discounts everything
Of course, the market cannot take into account events that are, by definition, impossible to predict. However, the price already reflects participants' emotions, economic data from individual companies and countries, including inflation readings and interest rates, and even possible risks in the event of unforeseen developments.
This does not mean in the slightest that the market itself or its participants know absolutely everything, including future events. It only means that everything that has happened is already imprinted in the price, and any new information will likewise be taken into account.
On this basis, a huge number of technical indicators were created, and today you can find an indicator to analyze virtually anything. But whereas indicators are often used thoughtlessly, Dow analyzed the market as a whole, relying on the natural segmentation of market participants.
The ultimate reflection of his work is the industrial and transportation indices. The composition of the index itself plays an important role. It is not fixed and is periodically revised to reflect changing market conditions. The essence is that the shares of companies operating in one area are analyzed. As a result, the index in some sense represents a closed system in which the main portion of funds is distributed among the participants and does not go beyond the portfolio.
A market of three trends
Straight-line market movement is science fiction. In reality, the price almost always moves in a zigzag, forming characteristic rising or falling highs and lows. In other words, it forms an upward or downward trend.
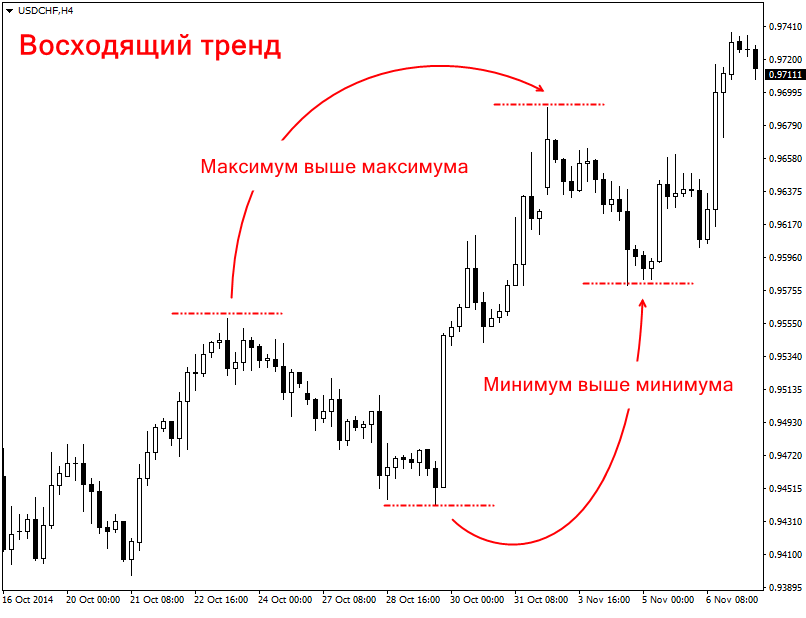 There is a main primary trend in the market. Identifying it is most important, since the primary trend reflects the actual direction of price movement, while all lower trend levels depend on the primary one. The duration of the primary trend ranges from 1 year to 3 years.
The most important thing is to determine the direction of the primary trend and trade in harmony with it. The trend remains in force until there is confirmation of its reversal. A prerequisite for a reversal, for example, may be a close below the previous extreme.
So, the primary trend determines the main direction of the market. In turn, the secondary trend moves in the direction opposite to the primary trend. In essence, these are corrections to the primary trend. The secondary trend has one interesting characteristic: its volatility is usually higher than that of the primary move.
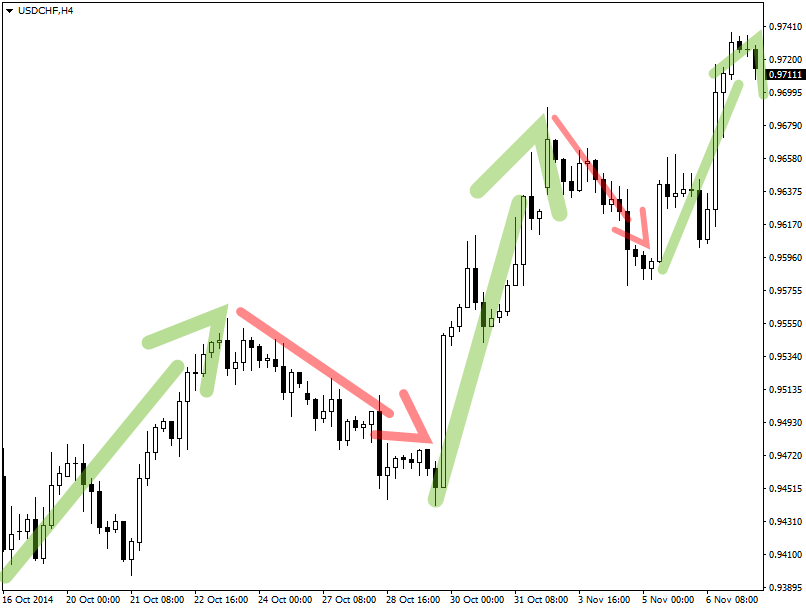
The final, smallest trend is nothing more than a pullback of the secondary trend. Such movement lasts no longer than one week. In the classical view, it receives the least attention. It is believed that there is too much price noise on this time horizon, and obsessing over the slightest movements can lead to irrational trading decisions.
Three phases of a trend
The next postulate of Dow Theory is the stages of trend formation:
- The first phase is usually characterized by price consolidation. This is a period of market indecision, when the previous trend is running out of steam. In other words, this period is marked by a buildup of strength before a surge and is also the most attractive point for entry, though a risky one;
- As soon as the new direction receives confirmation, the participation phase begins. This is the main phase of the trend, the longest of the three, and it is also marked by a large price movement;
- When the motivating conditions have been exhausted, the saturation phase begins. During this period, smart players start exiting positions as soon as signs of instability appear, for example, stronger corrections. This phase can be described as irrational optimism, when the price may continue to rise by inertia despite the absence of obvious prerequisites.
Identification of Trend Movements

To identify both trends themselves and reversals on a chart, it is necessary to understand the Dow methods used. The main technique for identifying reversals is the sequential analysis of extrema. For example, in the picture, points 2, 4, and 6 mark the highs of upward movements, while points 1, 3, and 5 mark the lows. An uptrend forms when each subsequent peak and trough is higher than the previous one.
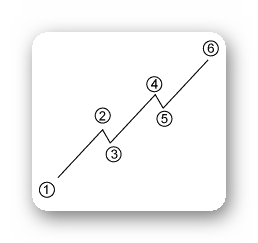 For a downtrend, by contrast, declining highs and lows are characteristic.
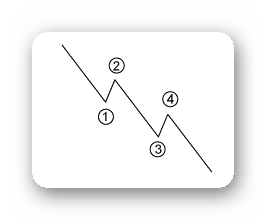 Dow Theory states that until we receive a clear signal of a reversal, the trend remains in force. Here we can draw a parallel with Newton's law of inertia, when a moving object tends to continue in its intended direction until another force interrupts its motion. An obvious signal of an upcoming reversal is the formation of a lower low (5) within an upward movement.
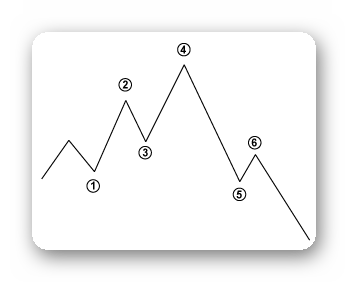 In the case when the trend is directed downward, the situation is the opposite. If the price failed to form a lower low and at the same time closed above the current high, it means that a force opposite to the initial movement is affecting the market.
Conclusion

Dow Theory, contrary to what many hope, does not answer the question of "how to enter the market at the stage of trend formation?". It is a long-term reversal strategy aimed at minimal risk. Nevertheless, the theory helps to better understand technical analysis as a whole, and why it works at all, because price is the derivative of all the factors influencing it.
Sincerely, Alexey Vergunov
TradeLikeaPro.ru