
Cumulative Delta - a trader's guiding star or a useless indicator?

Every trader comes to the market to earn money. While studying the tools, most traders move from technical analysis to volume analysis. Delving deeper into this topic, we encounter such concepts as the tape and the trader's order book.
The complexity of these tools is an order of magnitude higher than the skills of technical analysis. A magical stepping stone in the transition from technical analysis to studying the topic of volume is Cumulative Delta, which combines the simplicity of classic indicators and the basic laws of market movement. Today we will talk in more detail about the cumulative delta indicator - we will figure out what it is and how to use it in trading.
Using well-developed methods for understanding indicators, a trader begins to work with the magic of the market. In this case, he gets one tool for analyzing market movement that increases his professionalism and significantly makes it easier for him to make a decision about a trade.
Technical analysis is globally divided in defining the essence of its primary subject. The absolute majority of indicators use the OHLC bar price. At the same time, volume analysis is traditionally based on raw data: the book and the tape with the data flow. This makes the appearance of new tools developed to study such a complex topic as volume analysis all the more valuable. It is not based on price and therefore represents an additional dimension for decision-making.
At the same time, cumulative delta cannot be used to provide objective rule-based signals. You cannot simply enter the market when there is a divergence between price and delta. Cumulative delta is similar to the art of tape reading in that it helps draw the overall picture of what is happening. Cumulative delta will help you make trading decisions, but it should not be the only factor. The key point is that cumulative delta will generally move together with price, and when it does not, you should pay attention.
Simplified delta theory

The term "delta" appeared in trading circles in 2002, when the footprint chart (Footprint chart) was invented. Of course, all this became possible thanks to the expansion of information flows in the internet space, when real market volumes became available not only to narrow circles of currency speculators, but also to ordinary retail traders.
To understand the concept of "delta" and this topic as a whole in more detail, let us move on to the very definition of delta and its essence.
To do this, we will look at the very process by which trades are executed on the exchange. At the moment buy and sell trades are made, the exchange acts as an intermediary in trading and simply matches together the buyer and seller of the given asset. Orders in this case are processed in queue order as they arrive. Such data can be seen in the exchange order book.
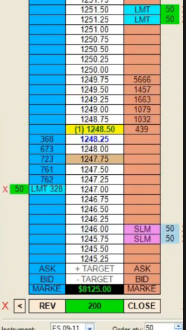
A buy trade is always executed at the ASK price, and sales, accordingly, at the BID price. The current price is the last price at which a trade was concluded.
Let us move directly to the concept of "delta"; it can be represented as a formula:
Delta = volume traded at ASK - volume traded at BID.
But to better understand this topic, we need to delve into the theory of order matching.
Let us consider the following scheme:
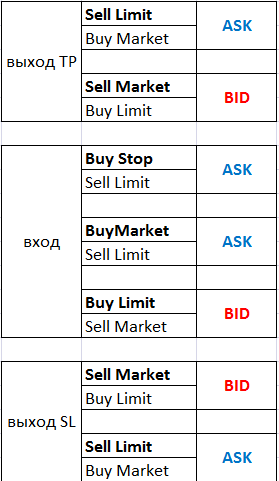
From this scheme, we see that all market entries or orders are executed only through limit orders and, accordingly, limit orders only through market orders.
If we look at the very essence of delta, then we can assume that in the case of a negative ASK-BID delta, we need to sell, and vice versa - if ASK-BID is positive, then we need to buy, but this would be a rash step, since at the moment delta can show us little except that at that moment some number of trades at ASK or BID prevails, but whether there are sellers or buyers there is a completely different question. Since at the moment of entry we cannot know how "big money" is entering: at market or with limits. It is generally accepted that big players always work with limits, and will never enter at market (at a worse price for them, not their price). But here everything is much more complicated, since big money can be different, and not some single "puppet master". These can be big banks, hedge funds, and large retail traders and, of course, they all have different tasks: someone buys and thereby hedges an options position (and it does not matter to them whether it is a profit or a loss), someone executes a purchase for a large volume in a certain price range, etc.
Let us consider several examples in practice, because if we look at the structure of the table above, dry numbers (negative or positive) will not tell us who is who.
At the ASK price there can be: entries at market, stops of market buys, sales with limit orders, as well as take profits of buys.
It is more correct to observe delta and look at the places where delta contrast appears: at important support or resistance levels, at daily extremes, etc.
And in these places, the following analysis can be carried out. For example, if delta is negative and there is an upward reaction, then these are most likely market sales that were stopped by limit buyers. And the shorter the bar (candle), the stronger the limit player, and the longer it is, the more limit players there are. In a situation where this negative delta (usually red in the display of the indicator) were truly selling in nature, then the movement should also be downward, like the bar itself.
Existing indicator variations

There are now many options for where to view delta, starting with the most budget-friendly and convenient ones (for those who are used to working exclusively in MT4 - this is buying the indicator http://clusterdelta.com/delta_mt4) and up to purchasing special platforms for analysis, such as:
In addition, there are both paid and free indicators for the NinjaTrader platform.
For the examples, I will use the Acme for NinjaTrader package. The price of the standard package is $109. For a preliminary review, you can take the 10-day trial version.
The visual style of the indicator can take the form of bars, a histogram, or a simple line.
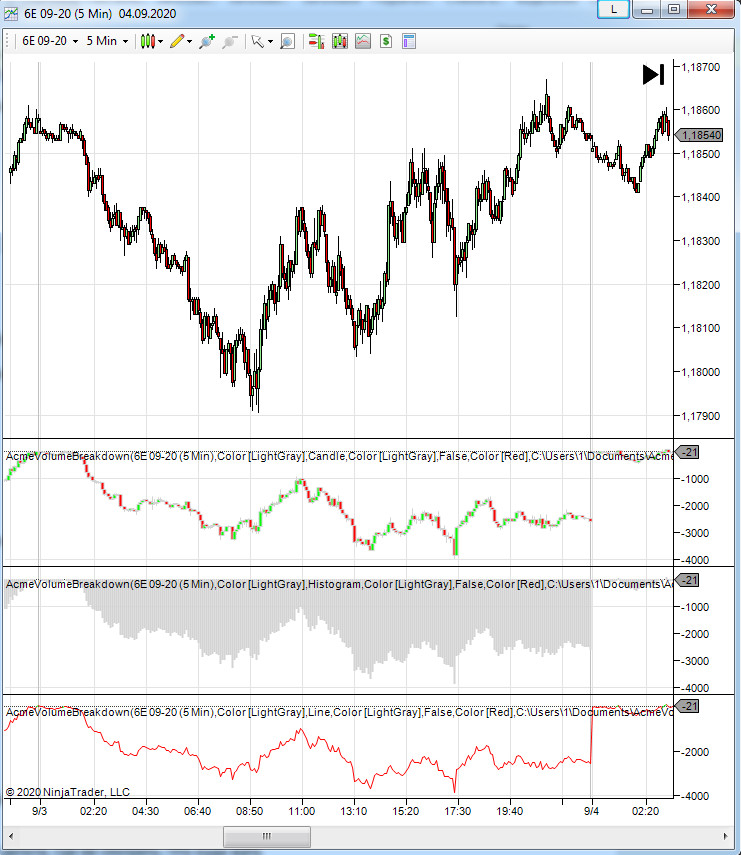
In the screenshot, we see the indicator with various visual style settings. The most popular display mode is bars, because entry patterns are clearly visible on it.
Indicator Setups

The main function provided by the delta indicator is that it separates the order flow by aggression, mainly showing market orders that hit both sides of supply and demand, depending on whether it is a buy or sell order. For example, if buyers initiate the ASK offer, then the delta will display green bars on the indicator; if sellers initiate the sale, the delta will display red bars.
Next, I will show examples of patterns that are not widely known, but that work well within market analysis and make it possible to understand the further price movement: absorption, gap, false breakout.
Absorption

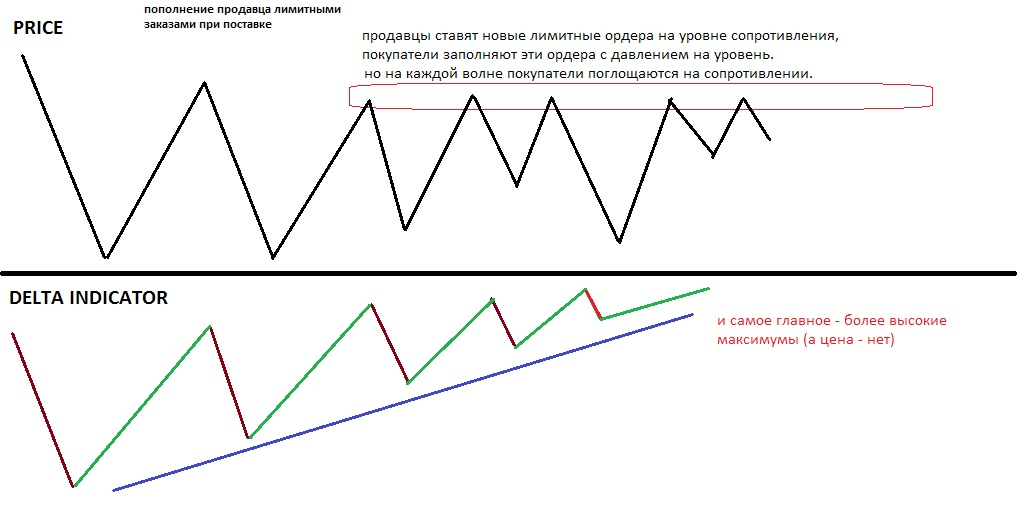
Absorption is the most frequent pattern identified by delta, since it is the most common way for the market to distribute order flow. The main premise of absorption is that one side of the market is refreshed with new limit orders, while the opposing order flow spends a lot of volume on these orders, but in the end there is a chance that the initiator will fail as market sentiment changes.
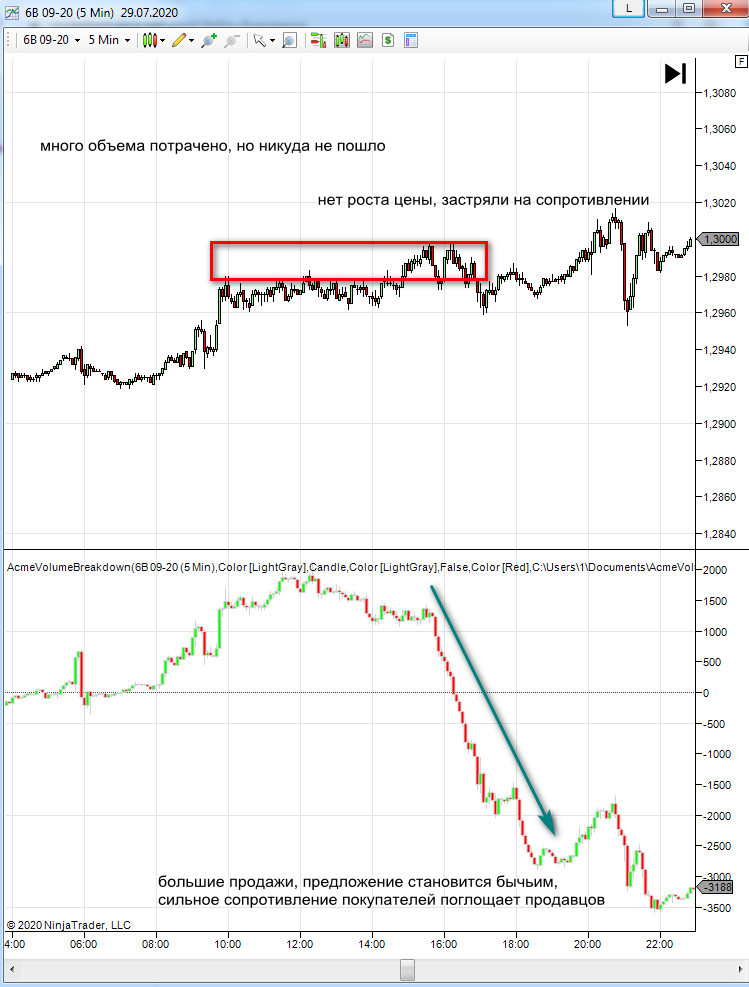
For example, if buyers keep pressing the ASK with pressure and delta shows strong growth, but the price cannot advance, then sellers refill the limits again, and if such action continues for several minutes or hours, there is a chance that the buyers will exhaust themselves and a new wave of sellers with market orders will come and push the price down. Thus, this is a concept in which buyers spend a lot of volume on attempts, while sellers simply hold with sell limit orders. In this case, delta will rise strongly over time, while the price will be flatter: a classic divergence.
When it comes to absorption, it is very important that the trader always compares/weighs price and delta movements over time. On the 5-minute timeframe, we look at the price movement relative to the previous 30 minutes, and the last 30 minutes relative to the previous 60 minutes, always taking context into account. Because if the context is not assessed properly, in the end the trader will see a fictional story through the delta indicator.
Definition of absorption: sellers place new limit orders at the resistance level, buyers fill these orders with pressure on the level, but on each wave the buyers are absorbed at resistance.
Gap

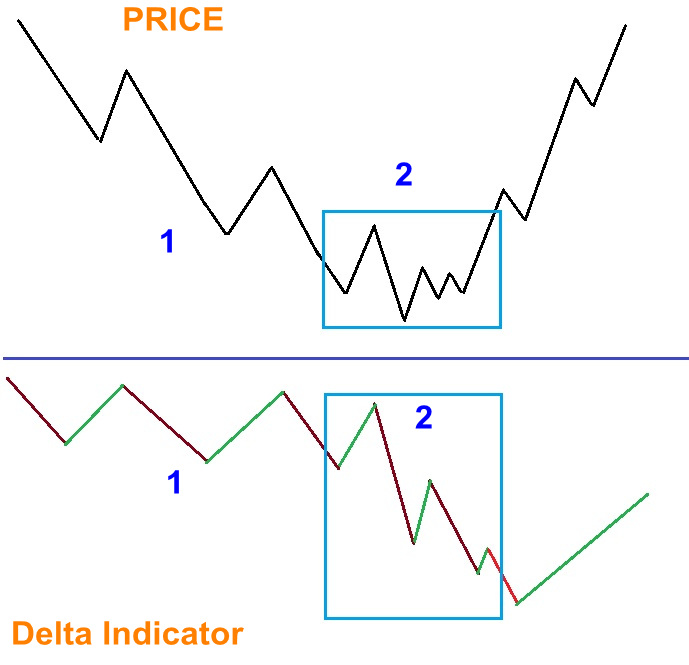
Gap is a stronger pattern than a false breakout. This is usually caused not by the market as a whole, but by one hidden large trader with a limit order, absorbing most of the opposing order flow around a specific price area, often a very narrow price zone. This process can last from 1 to 20 minutes. A strong gap is usually very noticeable on delta due to the huge gap between price and delta (for example, a very strong fall in delta, but the price is completely flat). The important difference between general market absorption and the activity of a large trader here is that market absorption is often caused by many sellers placing limit orders around key levels, whereas in this case it is a single hidden trader (not visible on level 2) absorbing orders because he does not want other traders to get ahead of him.
False Breakout

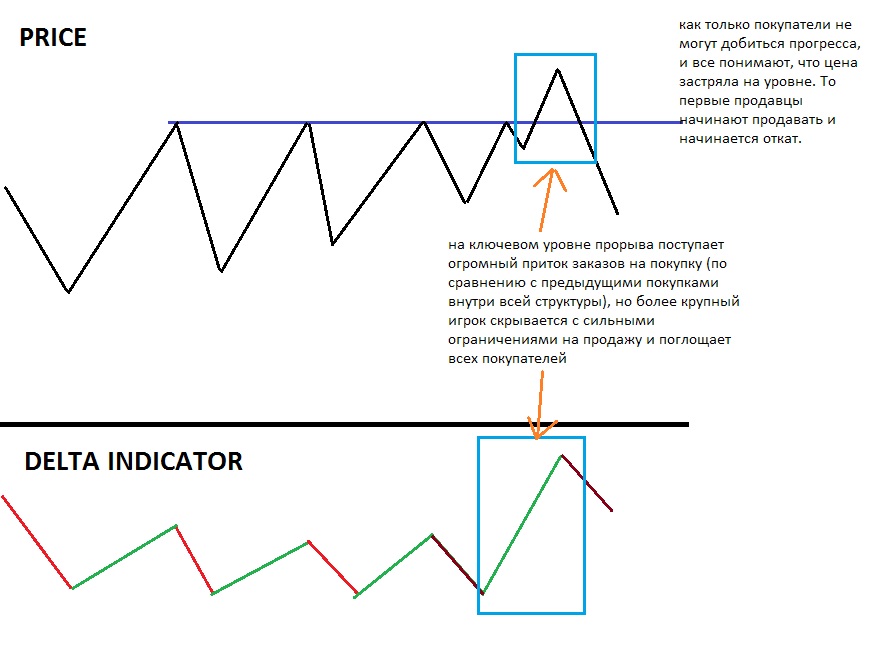
False breakouts usually occur around very strong obvious resistance or support levels, where many traders enter on the breakout, very often near the previous day's high levels. As soon as the breakout occurs, buyers start buying at the ASK price, which on the delta indicator is displayed with green bars, but the breakout has very little progress. Buyers continue to press for 1-3 minutes (1-minute timeframe), but the price hardly changes. Sometimes this happens because of a large seller, often hidden, who unloads a large sell position right there. As soon as the buyers run out of chances, a strong sell-off will begin, because all buyers will understand that now many traders with long positions are stuck at one price and cannot push it higher.
Examples on Real Charts

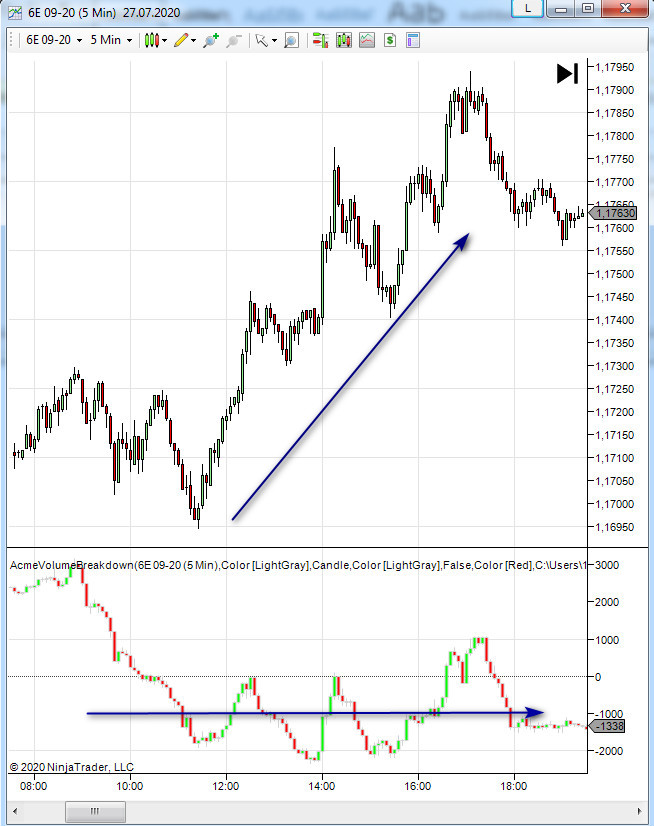
An example where the price is rising, but delta has many red waves between them, showing strong aggression from buyers. Since buyers absorb each wave of selling, the price does not fall at all, but offers keep coming in. Orders are supported by limit orders on every micro-move.
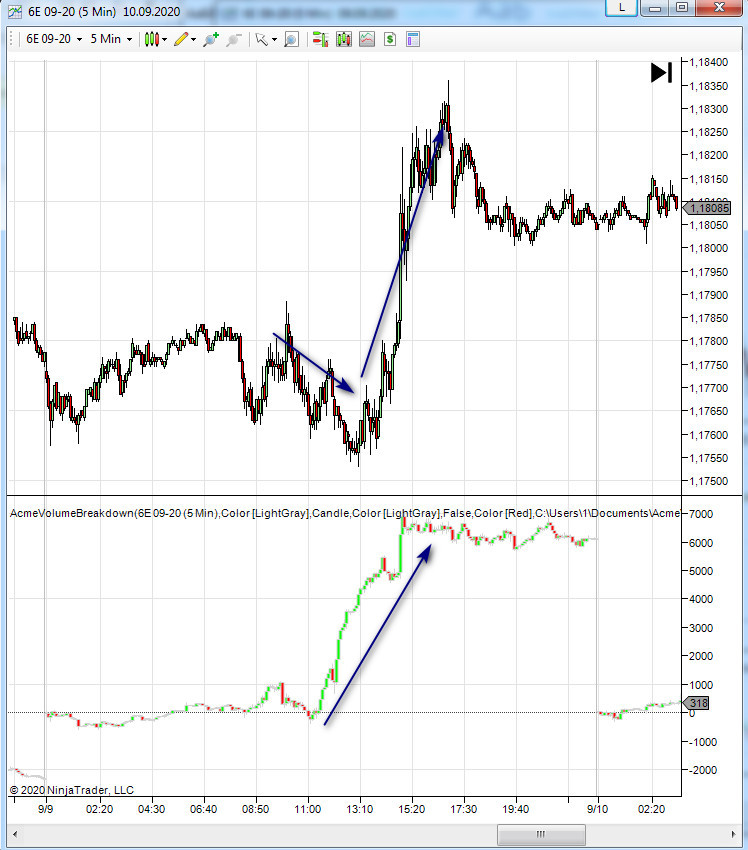
An example where the price rises with moderate strength, and delta also rises strongly, with orders providing a lot of fuel to sustain steady growth. This can be a prerequisite for a bearish drop, because it shows that these offers are capping selling and piling into the move. And if buyers weaken, then the price needs a lot of volume to keep moving upward.
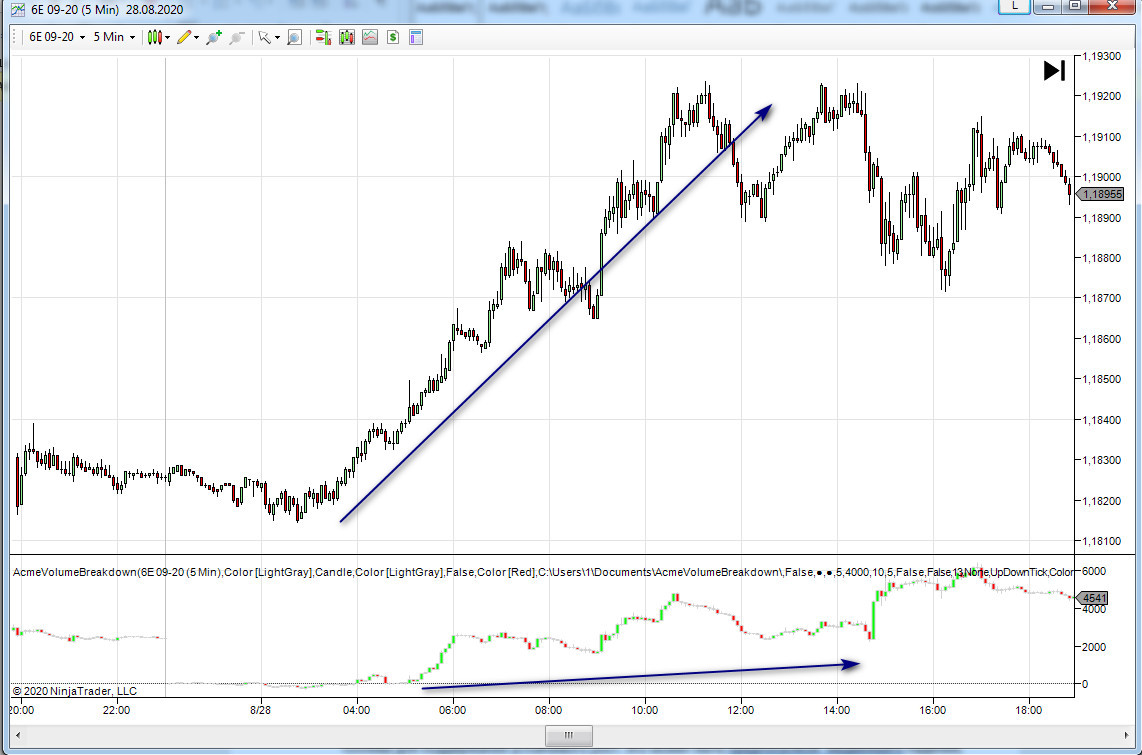
An example where the price rises strongly, but the delta indicator rises slowly. This shows that unfilled offers are hindering the rally, since little buying power from market participants is required to continue moving the asset upward. This is a general bullish concept. Little fuel is required for the move.
Below is an example of sellers absorbing near a key supply level. The price first fell because of bad news, and then buyers came in from below with strong buying. Note that delta fully returned to where its decline originally began, but the price itself did not return to that level at all; it was much lower. Sellers absorbed buyers near the bottom at supply levels.
The following concepts need to be checked: where the price movement began relative to where the delta movement began, and where the price is now relative to where delta is now. The main concept for identifying absorption is:
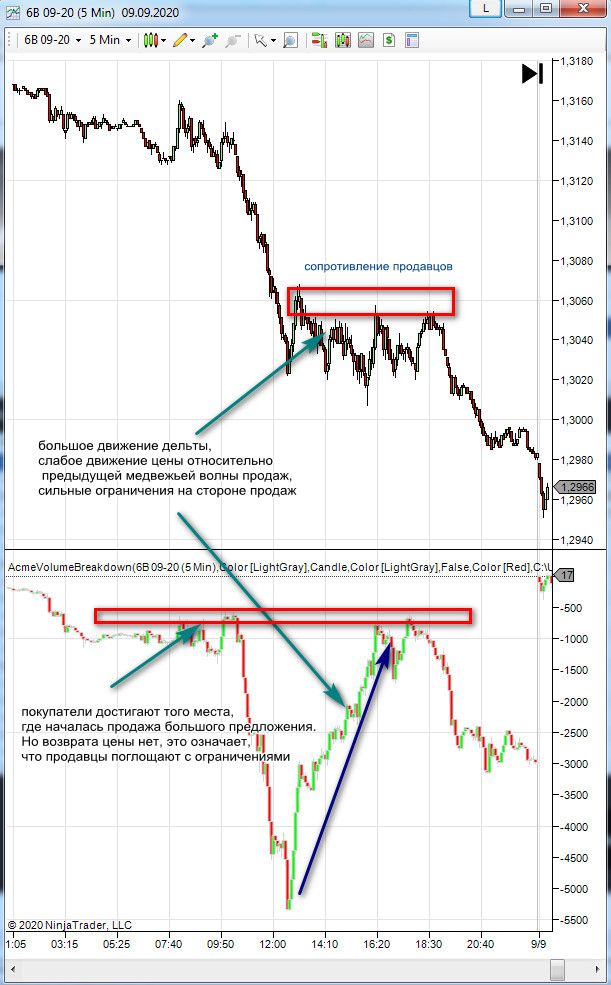
Below is an example of a level and very strong seller pressure into supply, while buyers refill limit orders around the supply that absorbs the seller pressure. Eventually the seller pressure drops, the price rejects the supply, and rises.
Preliminary Conclusions

Delta is simply the best visual representation of a certain order flow from the tape and can be especially useful for traders who struggle to understand the meaning of the tape, or for traders who do not want to be tied to watching Level 2 movements all day. But remember that delta will not provide all the information that Level 2 and the tape give, because by default it highlights only one part of the order flow in each minute, either the stronger buyers or the stronger sellers overall. It is best used in combination with Level 2, especially around key news events, when Level 2 can be very busy and difficult to understand.
The delta indicator by itself means nothing; it is important that the trader always overlays the action of delta onto the price context. If it is pulled out of context, the trader will get misleading information. Thus, to use and read delta, one should always compare how much it has changed recently with how much the price has changed. Also, in which direction the price and delta are moving, or whether there is a strong divergence between them (for example, the price is slowly rising while the delta is falling with red prints). Divergence mainly emphasizes that strong limits are absorbing opposing orders.
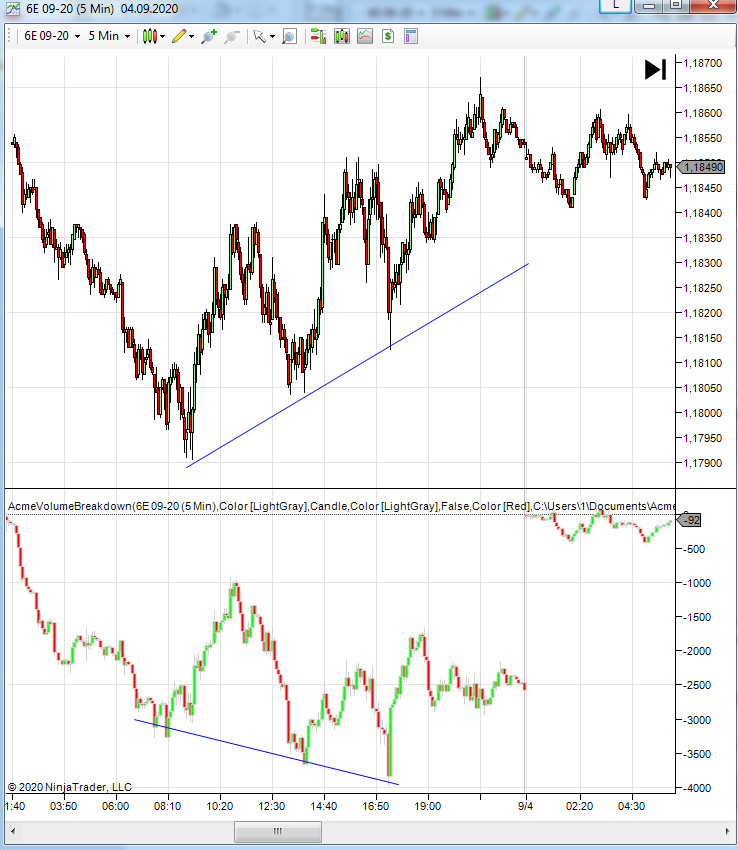
Examples are shown from the NinjaTrader platform using a custom delta indicator. There are many variants of delta indicators; some of them are provided with certain NT packages, and some are specifically created by third-party developers. Such an indicator can be used for ES futures, stocks, spot, and Forex (with an additional monthly data purchase).
Using delta is a good combination for Level 2, because it gives the trader a broader concept of what was happening with the order flow over the last hour, since by simply watching the tape, the trader may forget the whole concept (it is easier to remember a picture with several charts than 1000 orders that were executed over an hour). Such indicators can be used on other futures platforms, perhaps even on some stock platforms; the most important thing is that the platform requires Level 2 order flow data, otherwise the indicator will not display the order flow correctly.
Conclusion

It is important to have patience and wait for reliable opportunities; this indicator is not just a basic RSI or stochastic that gives some opinion about price being overbought or oversold every 10 minutes. The delta indicator may display a decent order-flow pattern only once or twice a day on the traded asset. For this reason, it is better to monitor many patterns than to just sit on one asset and watch every tick; this increases the chances of higher-quality setups.
Best regards, Alexander Volkov
Tlap.io
