
Crypto Market Heatmap: What the L1, L2, DeFi, AI, Memecoin, RWA, and GameFi Sectors Mean
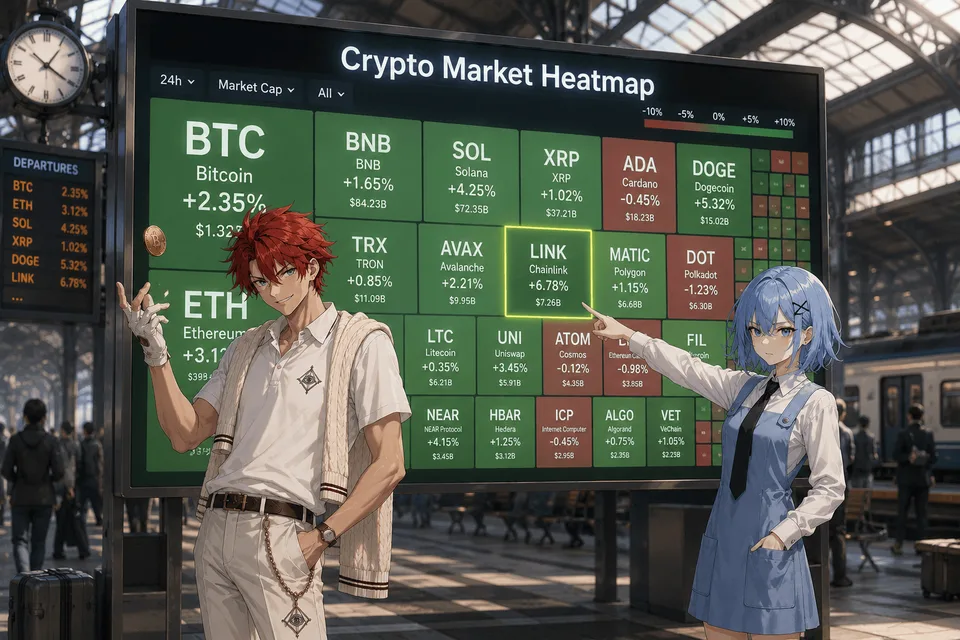
Viewing charts for hundreds of coins manually is inconvenient and takes a lot of time. This is exactly what the crypto market heatmap, or Crypto Heatmap, exists for.
A Heatmap is a visual map that displays the largest cryptocurrencies as colored rectangles. The size of each block usually depends on the coin's market capitalization, while the color shows the change in its price over the selected period of time. Thanks to this, an investor can understand literally in a few seconds what is happening in the market without opening dozens of separate charts.
This tool is used by both beginner investors and professional traders, since it helps quickly identify the overall sentiment of market participants and find interesting trading opportunities.
What You Can Learn from a Heatmap
The main advantage of a crypto market map is that it shows not a single coin, but the overall market picture.
For example, if almost the entire map is colored green, this means that most cryptocurrencies are rising at the same time. Most often, such a situation indicates strong investor interest and an inflow of capital into the market.
If most of the map turns red, it means sellers are dominating and the sentiment of market participants is worsening. In such conditions, even strong projects may temporarily decline together with the rest of the cryptocurrencies.
Sometimes you can notice an interesting picture: bitcoin shows slight growth, while many altcoins are rising much faster. This often indicates that investors are beginning to invest more actively in riskier assets, expecting to receive higher returns.
The opposite situation also happens. Bitcoin remains relatively stable, while most altcoins turn red. This behavior may indicate a shift of capital from risky coins into more reliable assets.
The most advanced way to work with a heatmap is to analyze crypto market sectors.
Main Crypto Market Sectors: L1, L2, DeFi, AI, Memecoins, RWA, and GameFi
The cryptocurrency market consists not only of individual coins, but also of entire areas that are commonly called sectors. Each cryptocurrency belongs to a certain category depending on its purpose and technology.
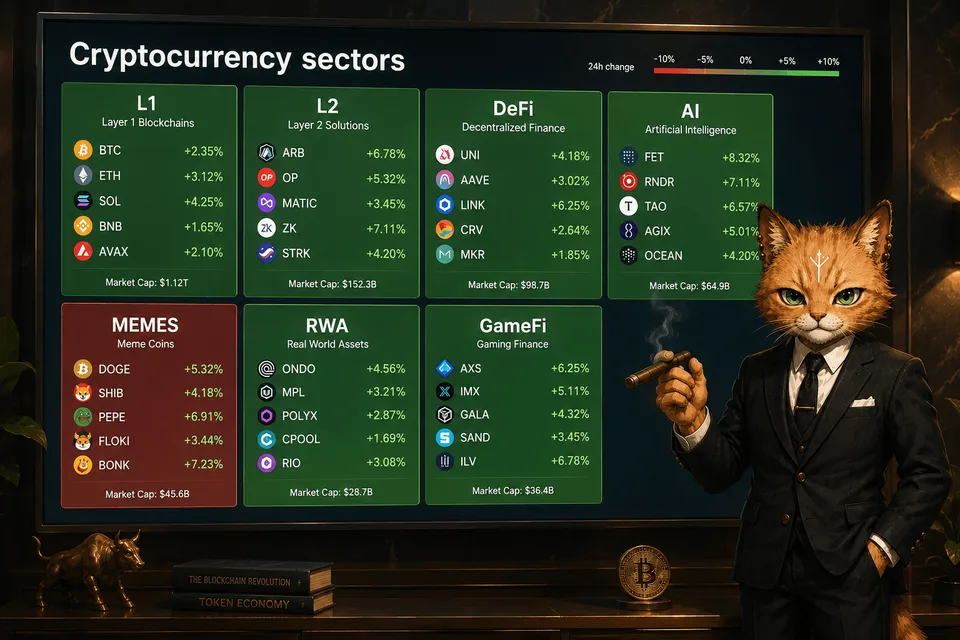
When analyzing a heatmap or studying market dynamics, it is useful to pay attention not only to individual projects, but also to which sectors are currently showing the greatest activity. Investors often first identify the leading direction and then choose the most promising projects within it.
L1 (Layer 1) - Base Blockchains
Layer 1 refers to independent blockchains that are the foundation of the entire ecosystem. They provide transaction processing, network security, and the operation of smart contracts.
It is on first-level blockchains that thousands of decentralized applications, NFT projects, and financial services are built.
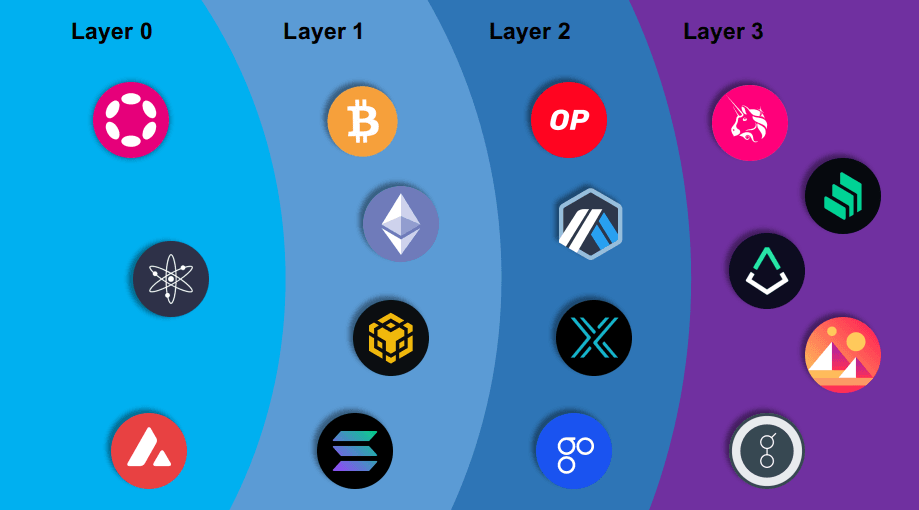
Popular L1 projects include Bitcoin, Ethereum, Solana, BNB Chain, Avalanche, Sui, and Aptos.
Growth in the Layer 1 sector usually indicates an inflow of capital into fundamental crypto market projects. During a bull market, it is often the major blockchains that begin rising before most altcoins.
L2 (Layer 2) - Scaling Solutions
Layer 2 refers to second-level networks created to increase blockchain operating speed and reduce fees.
For example, Ethereum remains one of the most popular platforms for smart contracts, but during periods of high load, fees can increase significantly. Layer 2 solutions make it possible to perform most operations outside the main network and then send the final data back to the Ethereum blockchain.
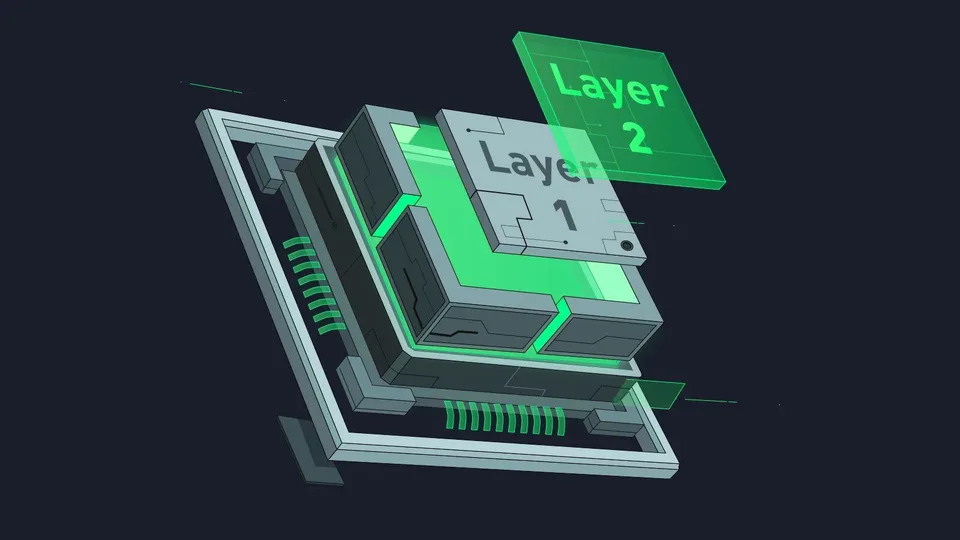
Popular L2 projects: Arbitrum, Optimism, Base, zkSync, Starknet.
If the Layer 2 sector is growing actively, this often indicates increasing interest in the Ethereum ecosystem and the development of decentralized applications.
DeFi (Decentralized Finance)
DeFi is decentralized financial services that allow people to use financial instruments without the involvement of banks and intermediaries.
With DeFi, users can exchange cryptocurrencies, receive loans and issue crypto loans, earn income from staking and providing liquidity, and also participate in protocol governance.
The largest DeFi projects include Uniswap, Aave, Maker, Curve, Compound.
During growth in the DeFi sector, the total value locked (TVL) usually increases, which indicates greater user trust in decentralized financial services.
AI — Artificial Intelligence in Cryptocurrencies
The AI sector brings together projects that use artificial intelligence and machine learning technologies.
Such platforms can create intelligent agents, process large amounts of data, automate computations, and provide infrastructure for working with AI.
Among the best-known projects, it is worth highlighting Bittensor, Artificial Superintelligence Alliance (FET, AGIX, OCEAN), Render, Akash Network.
After the rapid development of artificial intelligence, this sector became one of the fastest-growing areas of the crypto industry. However, due to their high popularity, AI coins are marked by increased volatility.
Memecoins
Memecoins appeared as joke cryptocurrencies inspired by internet memes and popular culture. Despite the lack of complex technology in many such projects, some of them have managed to form huge communities and take leading positions by capitalization.

The best-known memecoins: Dogecoin, Shiba Inu, Pepe, Bonk, Floki.
The value of memecoins is often determined not by fundamental indicators, but by popularity on social networks, community activity, and the attention of major investors.
Therefore, this sector is considered one of the riskiest. Growth can reach hundreds of percent in a short time, but declines can be just as rapid.
RWA (Real World Assets)
RWA is an area related to the tokenization of real-world assets.
The idea is to represent traditional assets as digital tokens on a blockchain. These can include real estate, government bonds, stocks, precious metals, works of art, and commercial loans.
Tokenization makes it possible to simplify the purchase, sale, and management of such assets, make investments more accessible, and increase liquidity.
In recent years, the RWA sector has been considered one of the most promising thanks to growing interest from major financial organizations.
GameFi
GameFi brings together gaming projects that use blockchain technology.
Players can earn in-game tokens, own digital items as NFTs, and participate in the development of gaming ecosystems.
Popular GameFi areas: Play-to-Earn, gaming NFTs, metaverses, in-game economies.
The best-known projects are Axie Infinity, Immutable, Gala, Beam.
Although after rapid growth in previous years the GameFi sector went through a serious correction, many experts believe that the development of blockchain games will continue thanks to improvements in the quality of the projects themselves and growing interest from major game studios.
Why It Is Important to Track Sectors
Experienced investors analyze not only individual cryptocurrencies, but also entire market industries. Quite often, capital first begins to flow into one sector, such as AI or RWA, after which dozens of projects related to that area rise at once.
That is why when analyzing a Heatmap, it is useful to pay attention to which categories are colored mostly green. If most projects in one sector show growth at the same time, this may indicate the formation of a strong market trend.
Understanding the structure of the crypto market helps investors find promising areas faster, better assess the relationship between projects, and make more informed investment decisions.
How the Crypto Market Heatmap Is Structured
The web is full of market heatmaps. TLAP has developed and implemented its own cryptocurrency heatmap.
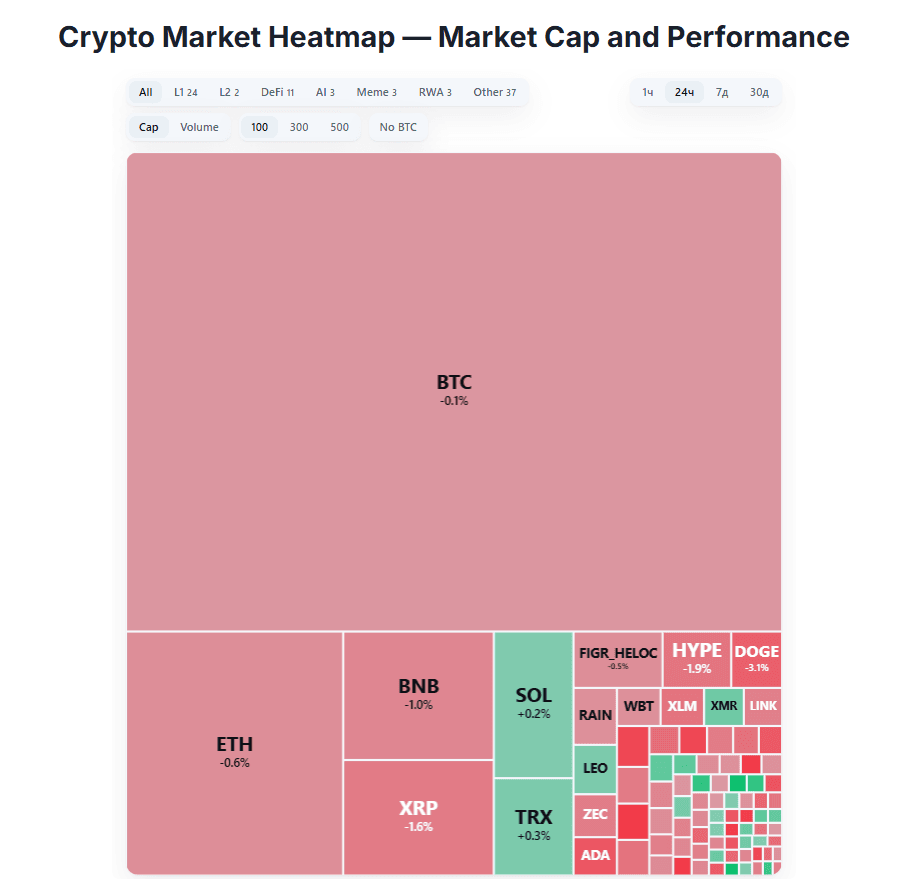
At first glance, the TLAP Heatmap resembles a mosaic of multicolored tiles of different sizes. Each tile corresponds to a separate cryptocurrency.
The main elements of the TLAP heatmap.
Block size. The TLAP heatmap lets you visualize cryptocurrency by market capitalization or trading volume (the “Cap / Volume” switch). The larger the project's capitalization, the larger its rectangle. Therefore, Bitcoin and Ethereum almost always occupy a significant part of the map, while small altcoins are shown as small tiles.
Block color. The color reflects the change in value over the selected time period. Green means strong growth; light green means moderate growth; light red means a small decline; dark red means a sharp fall. The brighter the shade, the stronger the price movement.
Selected time interval. The TLAP service lets you study price changes over 1 hour, 24 hours, a week, or a month. This helps analyze both short-term fluctuations and longer-term trends.
Sectors. On the heatmap, cryptocurrencies can be filtered by L1, L2, DeFi, AI, memecoins, RWA, and GameFi.
Market depth. The TLAP service lets you assess the capitalization or trading volume of the top 100, 300, or 500 coins.
Without BTC. The ability to hide bitcoin in order to examine the rest of the market better.
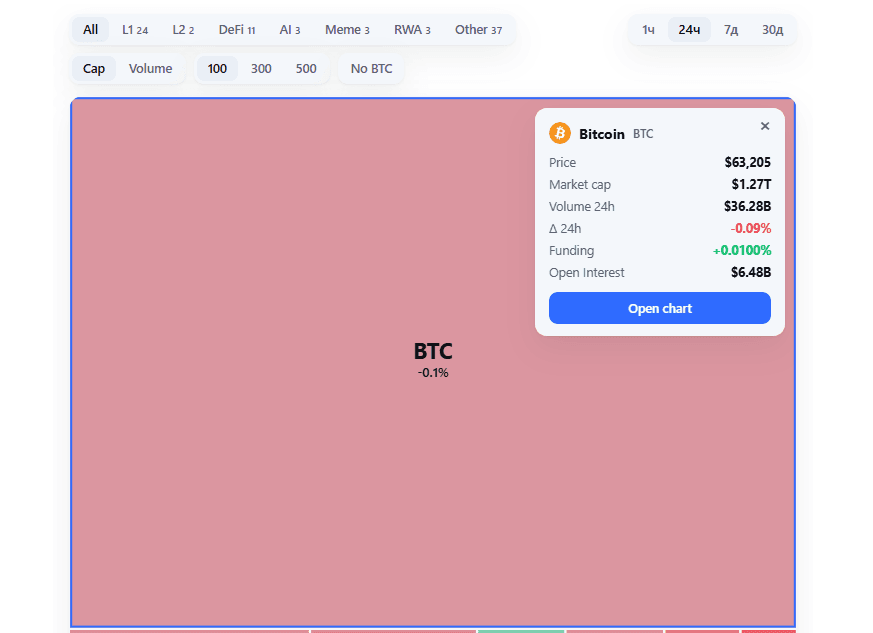
What distinguishes the TLAP crypto market heatmap from others? The ability not only to click on a coin to see its price, capitalization, volume, funding rate, and open interest (OI), but also to go to the chart.
How to Use the Crypto Market Heatmap
Let us imagine that in the morning an investor opens the market map and sees the following situation:
Bitcoin gains about 2%;
Ethereum rises by 3%;
most of the largest altcoins are in the green zone;
the artificial intelligence sector shows growth of more than 10%.
Even without detailed analysis, it becomes clear that the market is in a positive phase, and the greatest investor interest is focused precisely on projects related to artificial intelligence. This is a reason to study this sector more deeply and look for promising entry points.
Consider another example. The map shows that Bitcoin has practically not changed in price, while most altcoins have fallen by 6–10%. This may indicate increased investor caution and a gradual withdrawal of funds from riskier assets.
In such a situation, many traders prefer to reduce the volume of open positions or wait for a clearer direction of market movement.
Why Heatmap Does Not Replace Full-Fledged Analysis
Despite its usefulness, the crypto market map is only a tool for a quick overview. It shows the result of price movement, but does not explain the reasons for what is happening.
For example, a particular cryptocurrency may rise sharply after listing on a major exchange, launching a new product, or the release of positive news. The map will show only strong growth, but without additional analysis it is impossible to understand how sustainable this movement will be.
In addition, Heatmap does not show the distribution of trading volumes, liquidity, the project’s fundamental indicators, or the technical picture of the chart. Therefore, experienced investors use the market map as a starting point for further research, not as the only source of information.
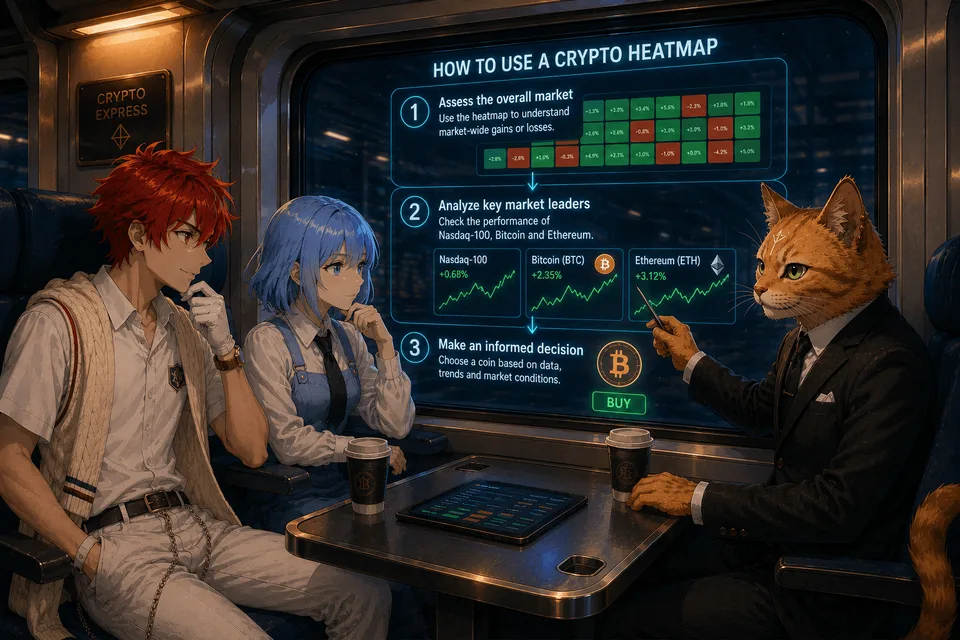
A competent investor first assesses the overall situation using Heatmap, then analyzes the quotes of technology stock indices (Nasdaq-100), Bitcoin and Ethereum, and only after that makes a decision to buy a specific cryptocurrency.
This approach helps to better understand market trends, avoid emotional decisions, and significantly reduces the likelihood of mistakes, especially at the initial stage of working with digital assets.