
The Future of BTC: 162% Fibonacci and ETF Flows

As of late August 2026, Bitcoin is trading actively in the $79K–$80K range, surpassing $80K for the first time since May. After a significant decline from its all-time high of $126.2K (October 2025) to $57.8K (June 2026), the cryptocurrency is showing signs of recovery.
Unlike the previous rallies of the first half of 2026, the current move is characterized by:
Stronger institutional demand
Active participation by large holders
Growth in the spot market
Short covering
Optimism is running high, so now let us examine the cryptocurrency market situation in greater detail from a technical perspective.
We will not assess the entire market, but we will try to identify BTC growth targets within the long-term cycle. We will conduct this search using the Fibonacci system.
Cryptocurrency Market Cycles
The cryptocurrency market displays pronounced cyclicality driven by both internal and external factors. Understanding how cycles form allows investors to make more informed decisions.
Each cycle is a successive transition through phases characterized by specific market conditions and participant sentiment. Usually, 4 phases are identified: accumulation, growth, peak, and correction.

Market Cycle Phases
The first phase of the cycle is asset accumulation. During this period, the market reaches a bottom, prices are at their lowest levels, and investor sentiment is predominantly negative. This is when large players begin actively accumulating assets in preparation for future growth.
The accumulation phase is followed by a period of growth. At this stage, investor confidence increases and market liquidity expands. Growing interest from institutional investors plays an important role, helping broaden media coverage and attract new participants.
Reaching the peak is characterized by maximum price levels. During this period, the FOMO (fear of missing out) effect emerges, assets become overbought, and market participants are gripped by excessive optimism.
The final phase is the correction. During this period, profits are taken, volatility declines, market participants reassess risks, and new trends form.
Key Drivers of Cyclicality
Various factors influence cycle formation.
Bitcoin halving is the most important catalyst for new cycles, significantly affecting market dynamics.
Bitcoin's next, fifth halving is expected in 2028 at block 1,050,000. The exact calendar date is not known in advance because it depends on the actual rate at which blocks are mined. Current estimates converge on approximately April 2028.
If October 2025 is considered the local peak of the post-halving cycle, the market is now approximately 1.5 years away from the next halving in 2028. Therefore, the hypothesis that the current move may be more than merely a rebound and could mark the beginning of a new growth phase ahead of the next halving deserves separate consideration.
At the same time, the classic “halving → peak after 12–18 months” pattern no longer appears as reliable as before: regulatory policy, institutional ETFs, and the large volume of over-the-counter capital have noticeably changed the structure of demand for BTC.
Macroeconomic conditions also exert an increasingly significant influence on market cycles.
Interest-rate dynamics, inflation expectations, global liquidity levels, and the US dollar exchange rate shape the overall environment in which the cryptocurrency market develops.
Modern Trends
In recent years, classic cycles have been transforming. Price movements have accelerated, while correlation with traditional financial assets has strengthened. The influence of institutional investors has increased considerably, and new sources of volatility have emerged.
The Evolution of Bitcoin's Four-Year Cycle: An Analysis of the Current Situation
After the 2024 halving event, the cryptocurrency market developed according to the classic scenario. In 2025, prices rose actively, culminating in an all-time high of $126,000 in October. Market participants viewed this level as the potential top of the current cycle.
In 2026, the market displayed significant volatility. The correction reached $57,800, more than 50% below the all-time high. At the same time, analysts at 21Shares note that the fundamental characteristics of the four-year cycle remain intact despite its evolution.

Potential Scenarios
There are currently two main scenarios for interpreting market dynamics.
The conservative scenario assumes that the October 2025 high was the cycle top and that the current recovery is a corrective move within a bear market.
The optimistic scenario views the current dynamics as the formation of a complex cycle with a deep intermediate correction followed by a growth phase
To confirm a trend reversal, the following levels must be surpassed:
$94,820 — the 2026 local high
$95,000–$100,000 — psychological resistance zone
$126,198 — the all-time high
Factors Confirming a New Cycle
The formation of a new bullish trend may be confirmed by the following indicators:
Prices holding firmly above $100,000
A breakout above the all-time high of $126,000
Growth in trading volumes
Increased inflows into Bitcoin ETFs
Thus, the current market situation is characterized by uncertainty regarding the direction of the next move. Forming a definitive forecast requires monitoring whether key resistance levels are surpassed with support from fundamental factors.
It is important to note that sustained positive dynamics under these conditions may indicate the beginning of a new bull cycle in the cryptocurrency market.
Institutional Demand and Macro Factors: An Analysis of Bitcoin's Rise
Demand Structure
ETF funds have fundamentally changed the structure of demand for Bitcoin.
Whereas capital previously flowed primarily through cryptocurrency exchanges and retail investors, institutional investors now gain exposure to BTC through regulated exchange-traded products, creating a structural supply shortage.
This time, institutional demand has become the key driver of the current cryptocurrency rally. Total inflows from August 17 to 25 amounted to approximately $2.57 billion. This is the best result in 2026.
Large holders (10,000–100,000 BTC), in turn, are also displaying strong buying activity.
During July–August, approximately 43,000 BTC (about $2.7 billion) were accumulated, of which more than 20,000 BTC worth around $1.2 billion were accumulated in early August alone.

Here is another highly illustrative episode.
In June, when US ETFs sold approximately $4.06 billion in BTC, large holders accumulated more than 270,000 BTC worth around $16.7 billion over two weeks, according to CoinDesk, citing on-chain analytics.
This divergence between ETFs and large wallets became one of the arguments supporting the formation of long-term demand.
According to the Glassnode analytics service, a substantial increase in aggressive buying activity in the perpetual futures market was already observed on August 10.
The taker demand indicator exceeded statistical norms amid active institutional investment inflows.
Thus, an analysis of current market dynamics reveals two key components of the rally:
Technical factor

Mass short covering
Liquidation of approximately $3 billion in shorts
Creation of additional demand
Acceleration of the price move
Fundamental factor
Continued inflows into Bitcoin ETFs
No large-scale selling by large holders
Sustained interest from institutional investors
The Macroeconomic Component of the Rally
External factors are also supporting the rally:
Increased repurchases of long-term US bonds
A weaker dollar
Growing interest in safe-haven assets
Positive expectations regarding cryptocurrency regulation in the US
Comprehensive Analysis of the Situation
Bitcoin's current rise is supported by several sources:
Short covering
The return of institutional investors
Accumulation by large holders
Improved market liquidity
Fidelity Digital Assets notes a historical correlation between periods of global money-supply growth and Bitcoin bull phases, confirming the potential for further growth as liquidity increases.
Thus, the current momentum is multifaceted, based on both technical factors and fundamental changes in the cryptocurrency market's demand structure.
Fibonacci Magic
Market participants are currently paying particular attention to the $167K–$169K level. This price target is supported by one of the Fibonacci levels.
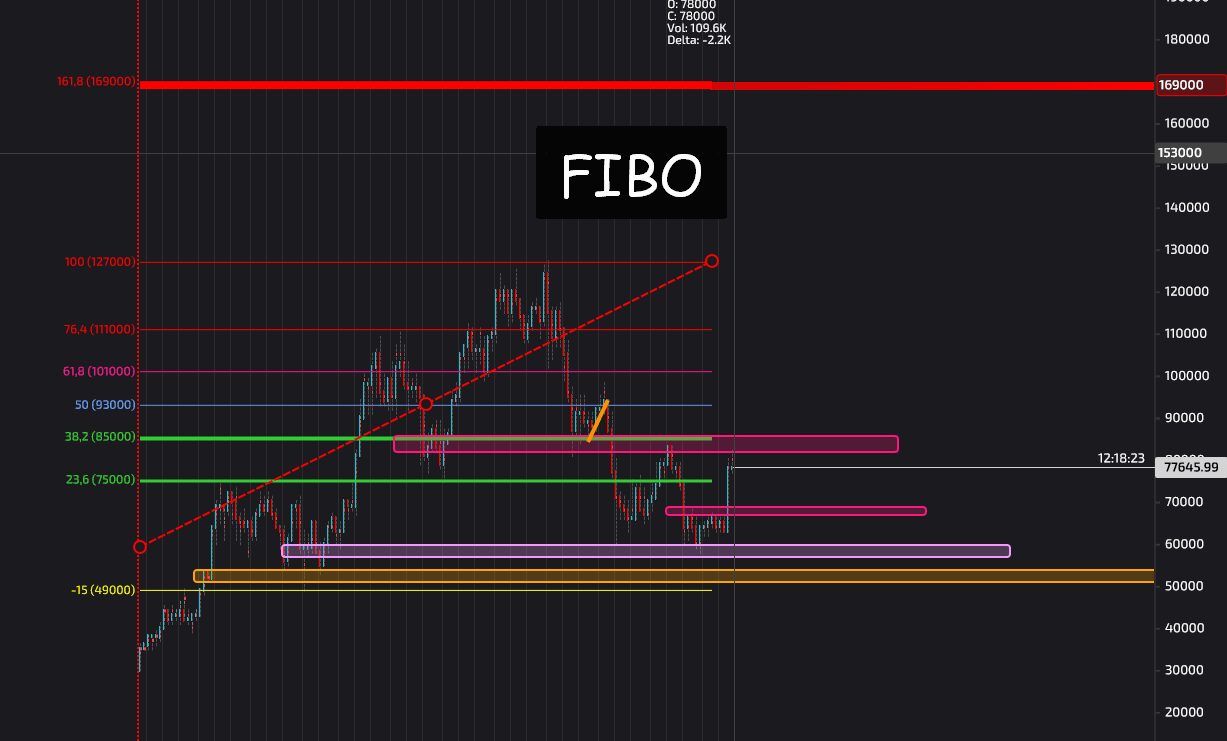
It is important to note that simply applying the Fibonacci extension from zero to $125K produces $202K (a coefficient of 1.618). Therefore, the $169K level is derived using a different calculation method.
The $169K target is obtained by calculating the 1.618 extension of the $49K–$125K range. This means that this level should be viewed as the 1.618 extension of the previous significant price impulse, which began in the second half of 2024.
Conclusions
The current rise in the Bitcoin market reflects a combination of technical and fundamental factors. However, continued inflows of real investment and the behavior of large players will determine whether the current momentum develops into a new uptrend.
The current market can be viewed as a transitional phase between a strong recovery and a potential new cycle impulse. Confirming the formation of a new growth cycle requires the sustained development of positive fundamental factors supported by technical analysis.

If the market transitions to sustained growth, attention should be paid to the $169K level, where large holders of the asset are expected to take partial profits.
Important Warning
Nature of the Material
This analytical material is provided solely for informational purposes and does not constitute investment advice. The data presented on Fibonacci levels, on-chain metrics, ETF flows, and the behavior of major market participants do not guarantee any specific price movement.
The cryptocurrency market is characterized by high volatility. A substantial price impulse may end in a deep correction without reaching the calculated target levels.
Investing in cryptocurrencies requires careful analysis and an understanding of all associated risks, including the possibility of losing the entire investment.