
BTC: looking for the bottom or waiting for it to knock from below

On February 8, 2026, a large overview article was published, in which we tried to figure out whether the end of the world had happened in the crypto market or whether light had appeared at the end of the tunnel.
At that time, the main signals that the decline was ending came from analysis of the multi-year auction on BTC. But since then 4 months have passed, full of various events that influenced players' choice of one of the long-term auction models, which implies a high probability of further decline.
The key idea at that point in time was timing analysis: "nothing prevents working in 70-85 thousand for the same 2-3 months." The second idea: "the prospects of seeing 80-85 thousand are likely in the near term."
Overview of the global BTC auction and development forecast
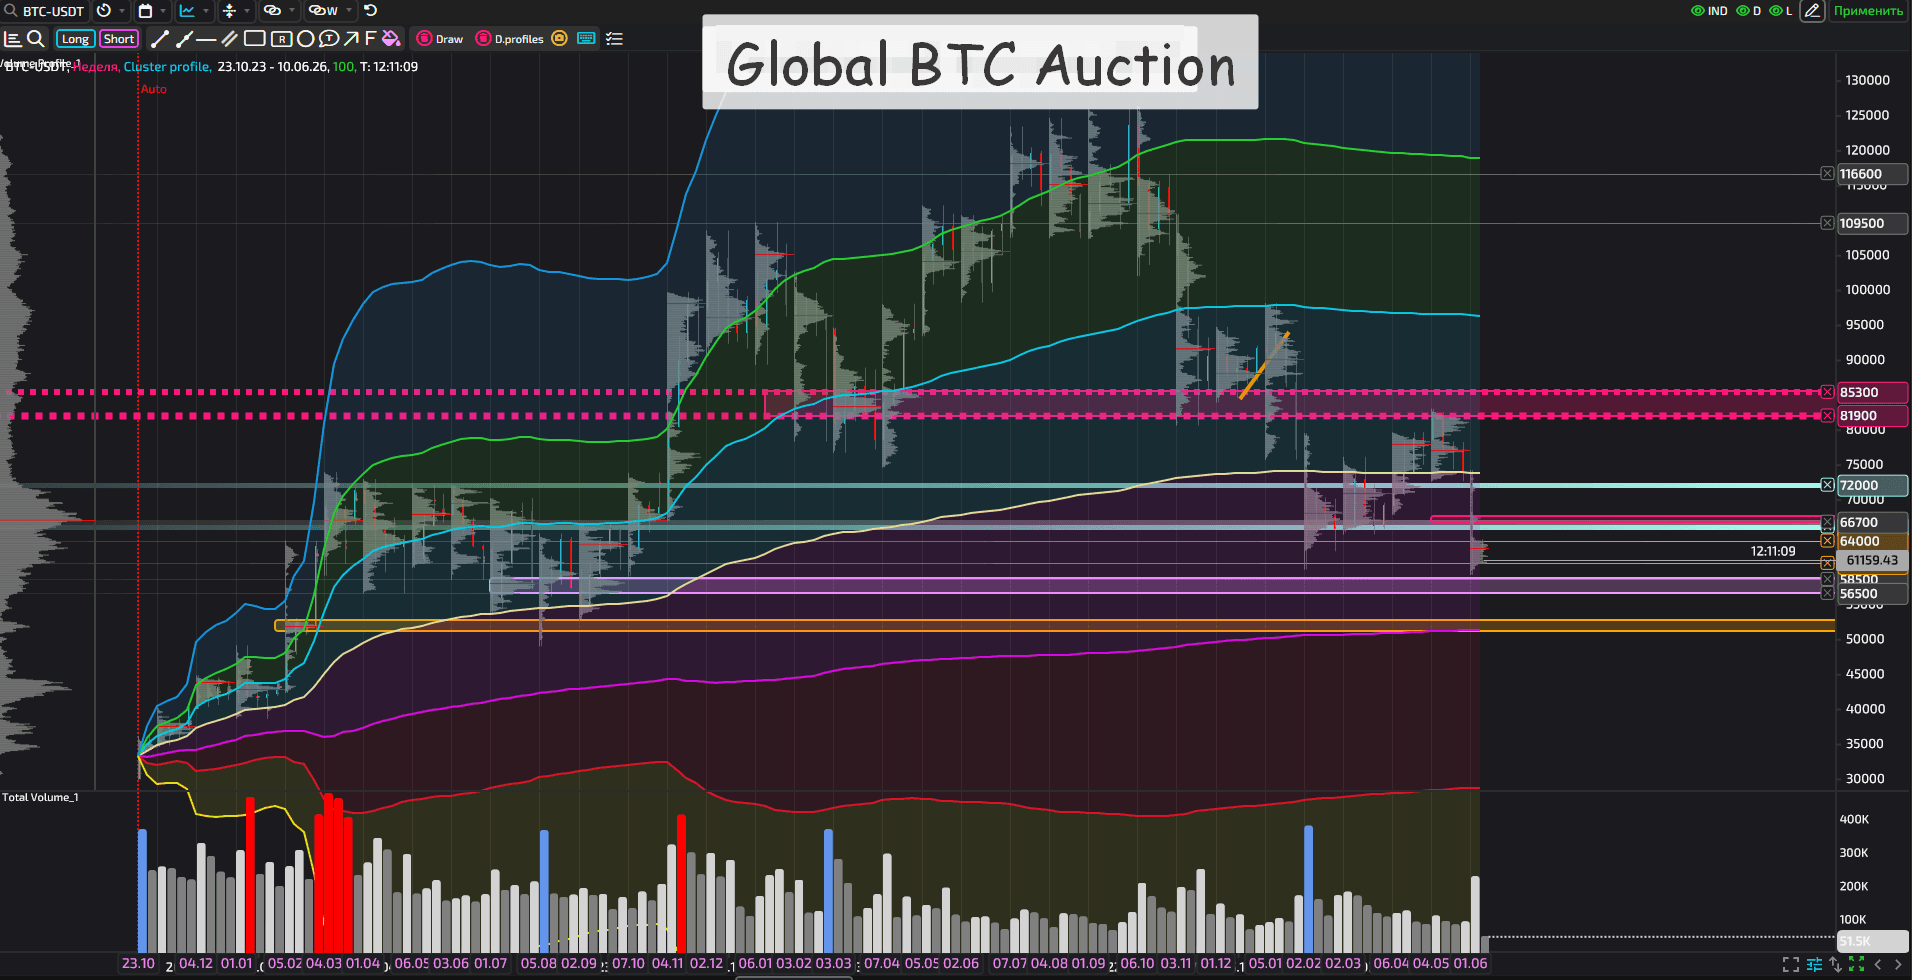
Since then, the main ideas both in terms of targets and timing have played out, and the bifurcation point - 80-85 thousand per BTC coin - has been reached (in fact, we almost touched 83 thousand).
After reaching the lower boundary of the 82000-83500 zone, the development of the global auction took on a completed form within the current large short impulse. Evidence of the development of precisely a short impulse is the speed of the decline and the actual consolidation below key support - the volume accumulation zone in the 66000-72000 range.
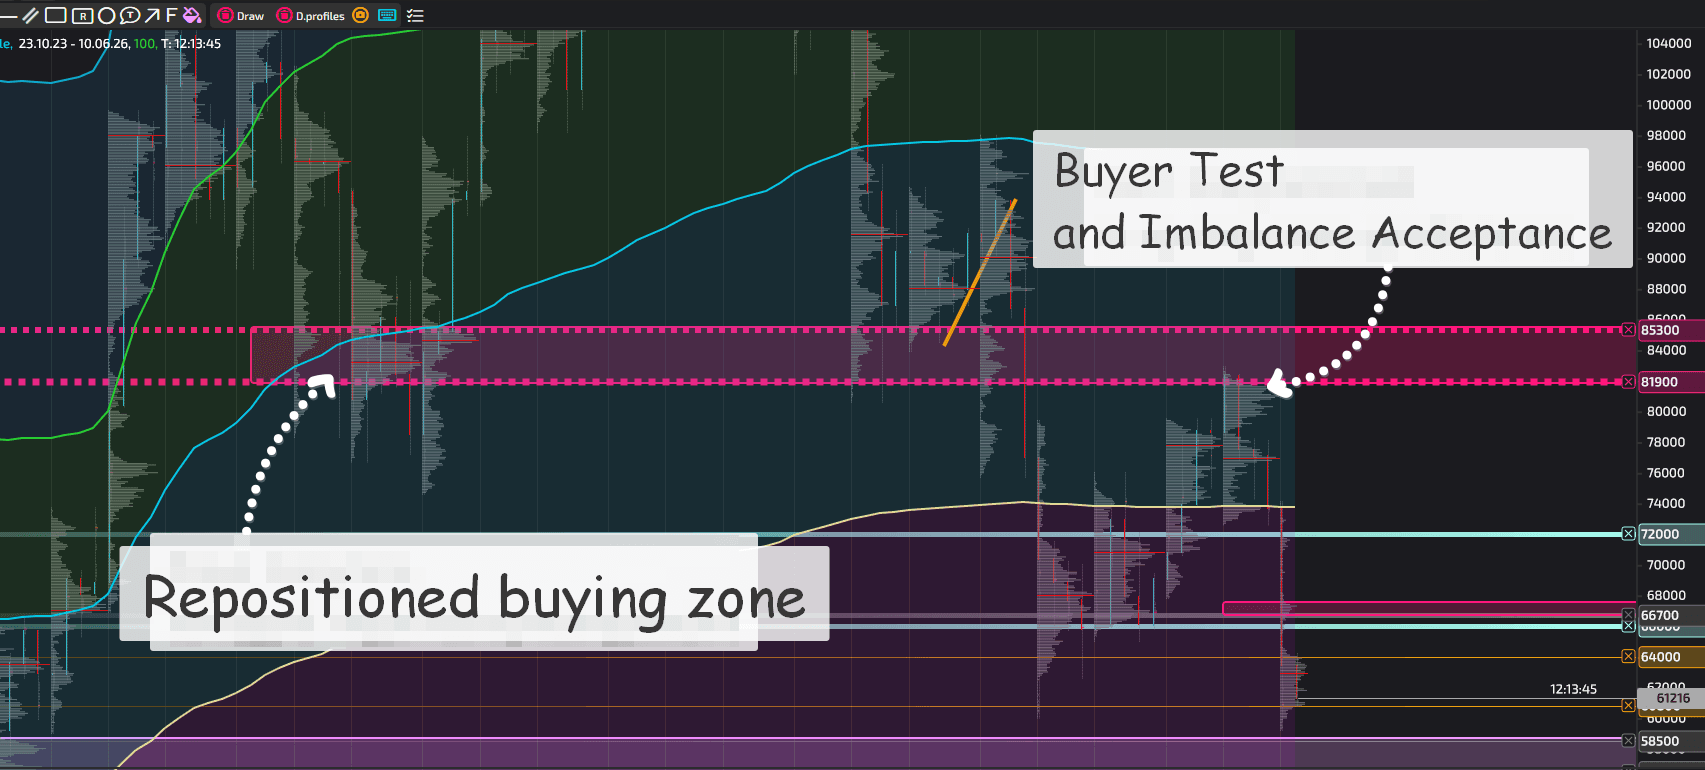
At the current point in time (the first half of June 2026), accumulation is forming in the 60800-64800 range. And this is another bifurcation point, after which the following events may develop.
Main scenario - decline toward $50,000
The first main scenario is volume accumulation in a plane no higher than 64000. The development of this plot implies a sharp move below 60 thousand in the second half or third ten days of June - first half of July.
The realization of this scenario may proceed in two ways.
The first option implies holding the 64000 area before a further collapse. The second is a price test of 65-66 thousand without consolidation above 67 thousand.
Both southern scenarios imply a test from below of 60-65 thousand. With a test from below up to the upper boundary of the range, the decline may be smoother with pullbacks, while with a quick test of the lower boundary, the decline will more likely be impulsive.
However, these are only probabilities based on general experience.
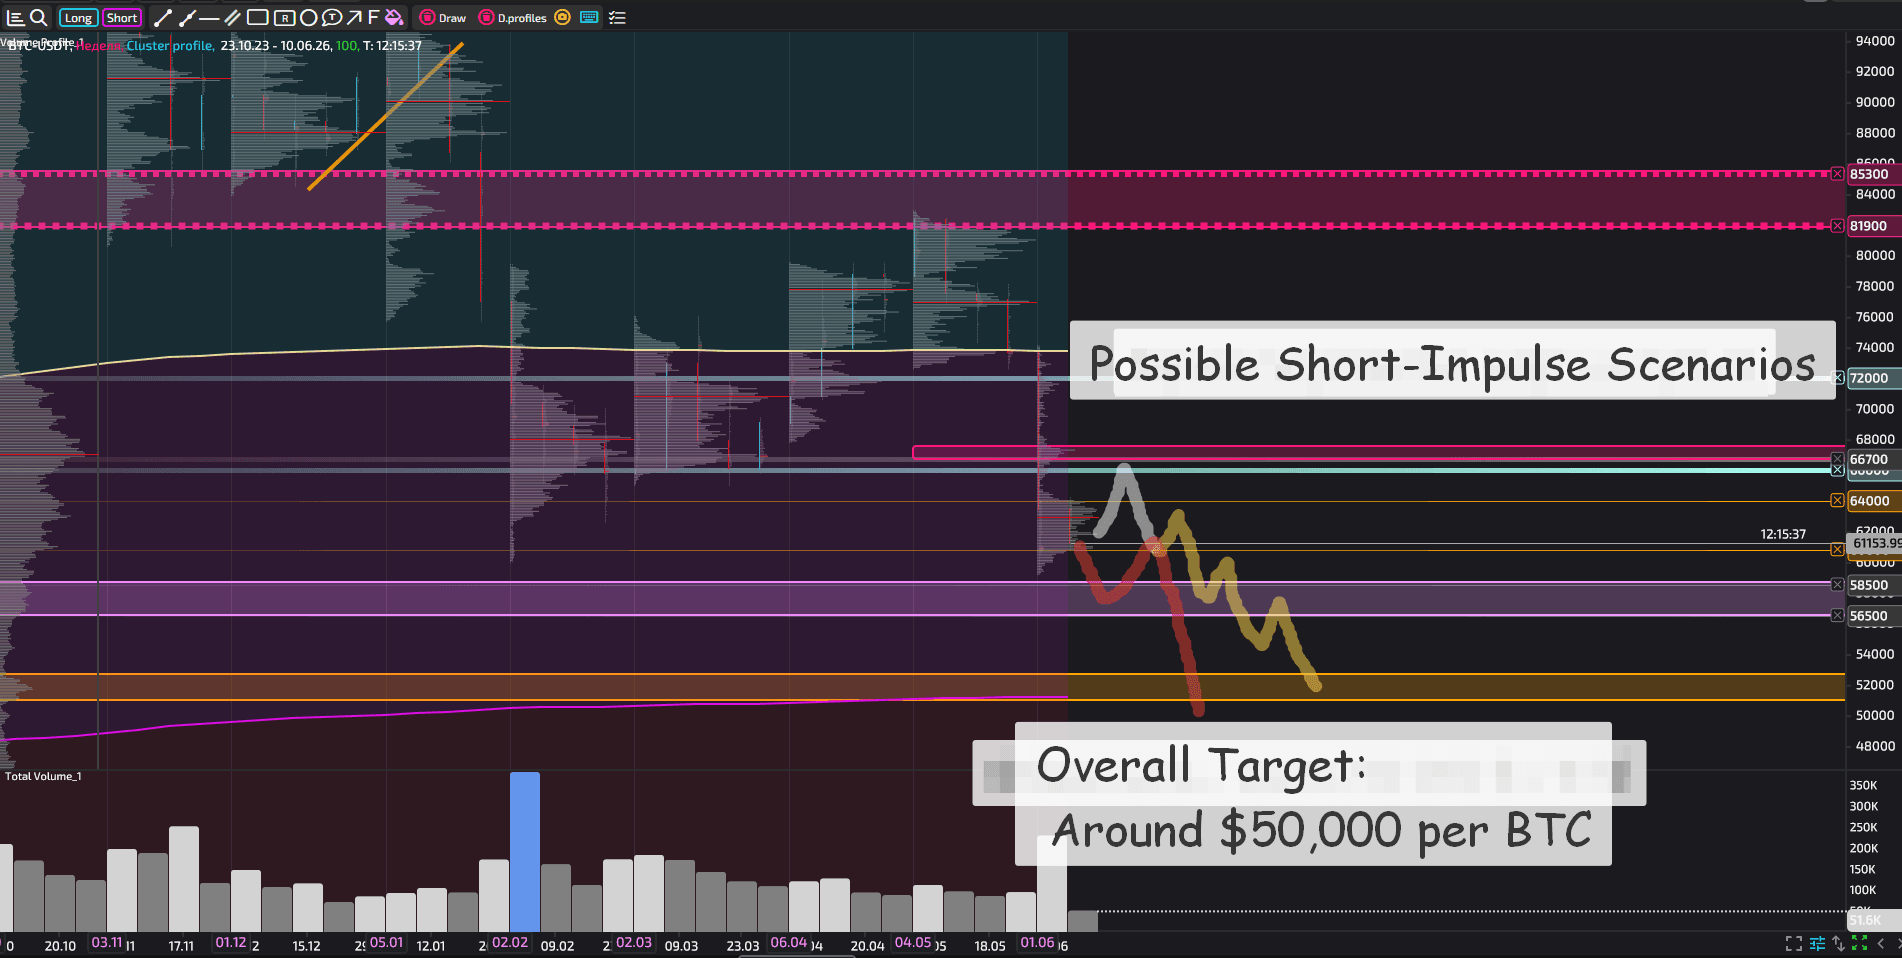
In general and overall, this scenario implies movement toward 50000, where there will again be a bifurcation point that simply makes no sense to discuss now.
Extremely alternative scenario - return above $67,000
The second global scenario for the coming quarter implies a return to the 66000-72000 accumulation zone.
In this scenario, two plot developments are possible: either pushing through the local bottom all the way to 57000 with a further sharp return, or from 59-60 thousand a jump upward (this is very unlikely).
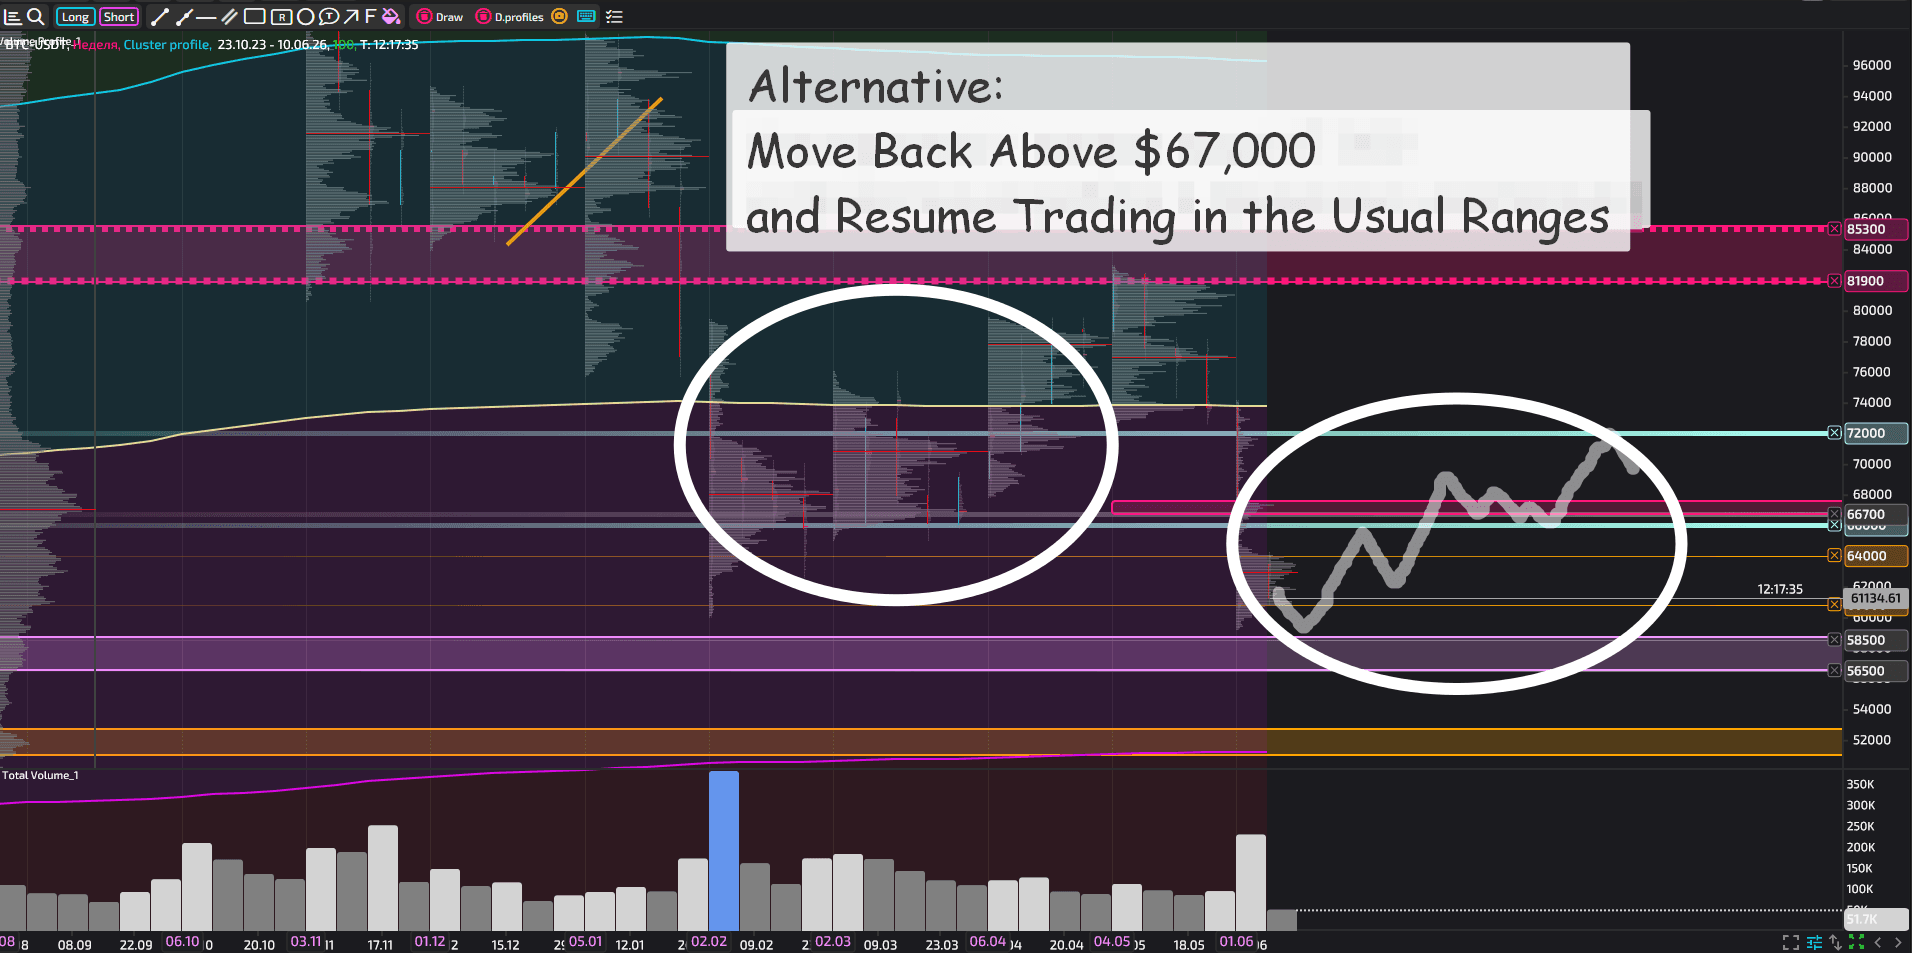
The marker of this scenario will be consolidation on the daily timeframe above 67000-68000 dollars. Further on, this scenario implies long work in the 66000-72000 range (2-3 months), after which a new bifurcation point will arrive.
Key external factors
Let's examine what may influence the development of the global auction for BTC.
Policy of the new Fed chair
Until recently, it was generally assumed that the new Fed chair, Kevin Warsh, should begin easing monetary policy. But the acceleration of consumer inflation that began even before the Iranian crisis sharply reduced the likelihood of Fed rate cuts. The U.S. war with Iran only strengthened the trends that had begun somewhat earlier.
Today markets expect the Fed rate, which currently stands at 3.5-3.75% per year, to be maintained. Moreover, even some tightening of monetary policy is a quite expected step to reduce inflation.
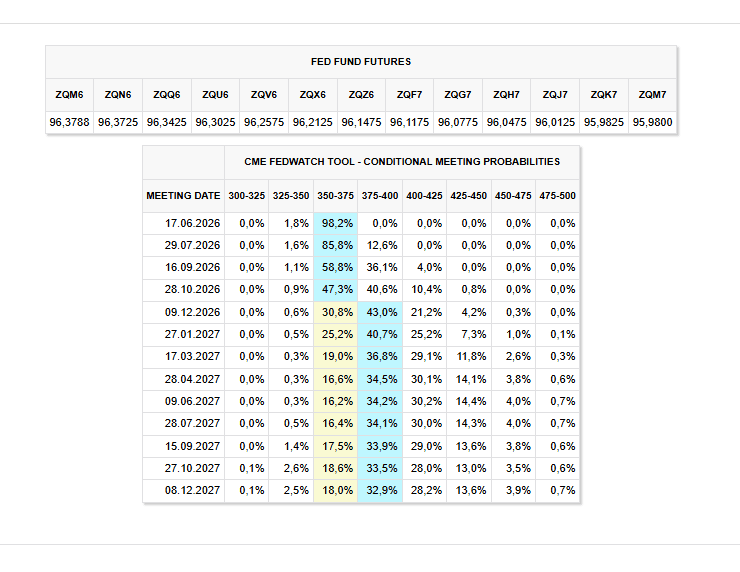
At the current point in time, investors expect the current rate to be maintained up to October 2026. 98.2% are betting on the rate being held on June 17, 85.8% on July 29, 58.8% on September 16, and 47.3% on October 28.
Expectations of a 0.25% rate hike were distributed as follows. In July, 12.6%; in September, 36.1%; in October, 40.6%. By December, 43% of investors already expect the rate to be raised (only 30.8% of investors favor keeping it unchanged). Incidentally, more than 20% expect the rate by that time to be 4-4.25% or higher.
Expectations are shifting toward an increase and will change significantly depending on current data. But right now this is exactly the situation, and it does not bode well for risky assets. And cryptocurrencies are the riskiest asset class.
Outflow of Funds From Risky Assets
Taking into account the circumstances mentioned above, an outflow of funds from risky assets, which include stocks and cryptocurrencies, is possible.
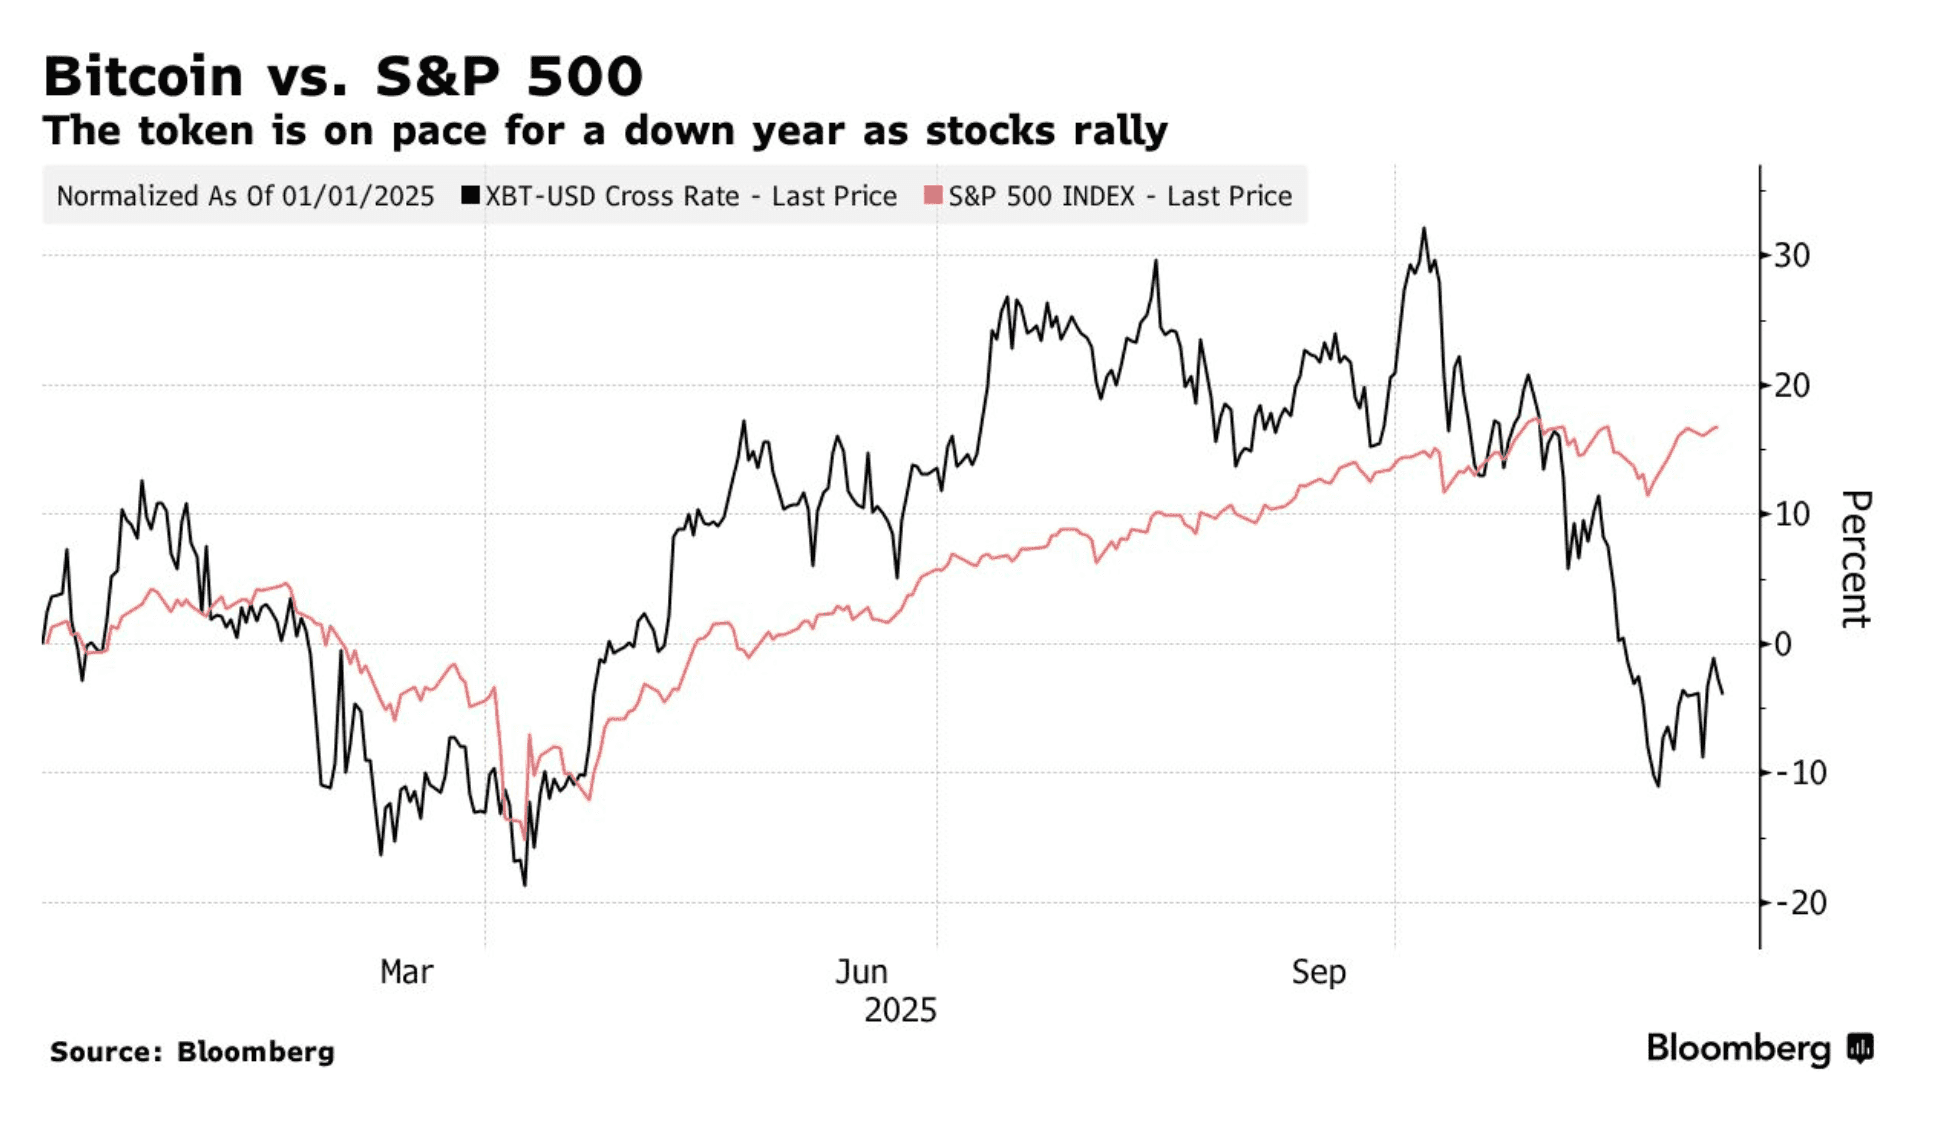
Money has been leaving crypto for a long time. So far, not into cash. It is simply flowing to where things are interesting: technology-sector stocks, earlier metals, oil, and so on. But if something happens that forces money to leave stocks entirely, there is a high probability of an even stronger decline in BTC.
The correlation with the S&P 500 makes it clear: they rise together (crypto with a lag, though much more vigorously), while crypto falls much earlier and harder.
What do investment bankers say about these risks?
Bank of America (BofA) warns investors that it is time to take profits. Which is perhaps what we are seeing right now. In a note dated June 5, strategists led by Savita Subramanian wrote literally the following: “Too many warning signs. <…> The S&P 500 index is statistically overvalued on 17 of 20 metrics and is trading above technology-bubble levels on eight”.
For their part, analysts of the popular newsletter The Kobeissi Letter analyzed the market using the Buffett indicator, the ratio of market value to GDP, and reported that it stands at 238%. This is 90% higher than before the dot-com bubble crash in 2000.
Of course, today this is a completely different market: as soon as investors are gripped by panic, the Fed sharply eases policy: if not by cutting rates, then by providing liquidity in various ways. And a market operating in previously unseen conditions of unlimited money supply can, of course, operate, and is operating now at such extreme Buffett indicator values. But one still needs to stay alert.
Based, by and large, precisely on this consideration, JPMorgan analysts assume that any market decline will be bought up instantly.
But still, we are talking about stocks, not cryptocurrencies. For the latter, an inflow of fresh free or almost free money is extremely necessary. And that is not here yet.
IPO of SpaceX / Antropic / OpenAI
On June 12, 2026, SpaceX plans to list on Nasdaq under the ticker SPCX. They plan to raise $75 billion. And this is live money, not inflated capitalization. It has to be found somewhere.
By the way, demand exceeds supply threefold. The offering price will be extremely interesting.
IPOs of Anropic (Claude) and OpenAI (ChatGPT) are already planned for the fall. This also requires money, a very large amount of live money. Where can it be taken from?
The only way today to conduct a successful IPO of such significant companies is to extract money from other assets. And tell me, what is the role of cryptocurrency here? Only that of a liquidity donor, nothing more.

Electricity Shortage and AI Priority
The sharp growth in demand from AI companies for hardware and electricity does not contribute to the development of the cryptocurrency market. In the competition for computing power and access to a power outlet, AI always wins.
Moreover, many companies that were engaged in mining (either independently or by leasing out computing power) are already shifting their focus to AI.
What Is the Bottom Line
As a result, there is no point in talking about serious growth in cryptocurrencies in general and BTC in particular. At least in the near term.
But the market exists, and the market is relatively not small. Yes, the capitalization of cryptocurrencies is not very large and is comparable to not the largest venues (for example, DAX).
The price of bitcoin cannot fall below the cost of mining BTC and maintaining the network, which today averages around $50,000 worldwide. This value is exactly what looks like the downside target within the framework of long-term auction analysis.
Overall, today the Bitcoin network consumes 202.79 TWh per year, which at a price of $0.05/kWh corresponds to approximately $10.14 billion per year.
We should also note that mining can effectively be frozen, since approximately 20.03 million BTC out of the maximum possible 21 million BTC have already been mined (as of June 2026). This amounts to about 95.4% of the total limit.
So, in general, one can avoid bothering with mining and focus only on maintaining the network and transactions, which is substantially cheaper than mining. And that means the price can also be lower. But this is, of course, alarmism.
In any case, bitcoin has occupied its niche. General impulses are possible, as is many years of gradual growth, but with further market regulation (both from the point of view of BTC as a commodity and from the point of view of BTC as a means of payment), sharp moves should not be expected. Hundreds of thousands, let alone millions of dollars per coin, should not be expected.