
The Best Inside Bar Indicator
 Greetings, trader friends!
The Inside Bar pattern is among the fundamental Price Action patterns whose effectiveness has been proven over decades. But, despite the simplicity of the setup, finding a correctly formed pattern requires attentiveness and perseverance from the trader, which are by definition exhaustible resources. It is much easier to give this task to an indicator that automatically signals the appearance of a new pattern on the chart. The name of this indicator is InsideBarSetup.
What Is an Inside Bar

As the name suggests, an Inside Bar is located within the boundaries of the previous bar. Its high is always lower than the previous high, and its low is always higher. In the traditional pattern, the size of the inside bar is assumed to be significantly smaller than the previous (outside) bar. That is, after an active rally the market takes a "breather" and the price temporarily consolidates before the next push.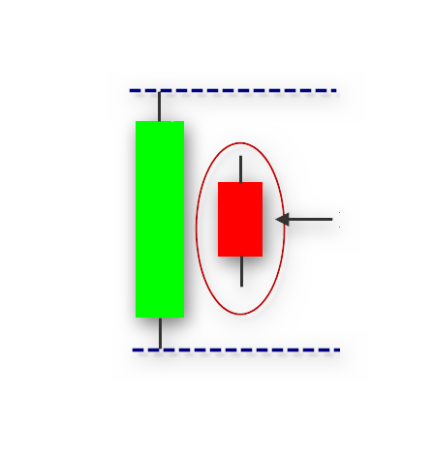 In addition to the patterns themselves, the indicator displays full-fledged setups on the chart. The essence of the setup is trading the breakout of the inside bar boundaries. This is one of the most popular ways of trading this pattern.
Installing the Indicator
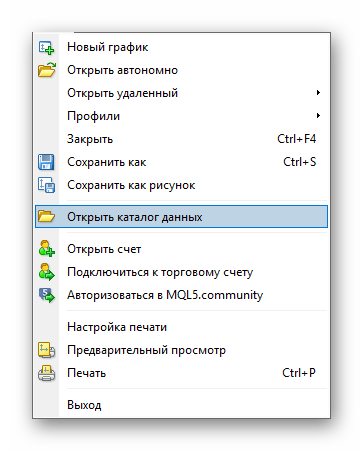
There is nothing unusual about installing the indicator - the installation process is similar to any other indicator for MT4. In the terminal, go to File - Open Data Folder and move the file "InsideBarSetup" into the MQL4 - Indicators folder, then restart the terminal.
 The author of the indicator did not skimp on settings - everything can be configured to suit your preferences. Four blocks are responsible for the main indicator settings.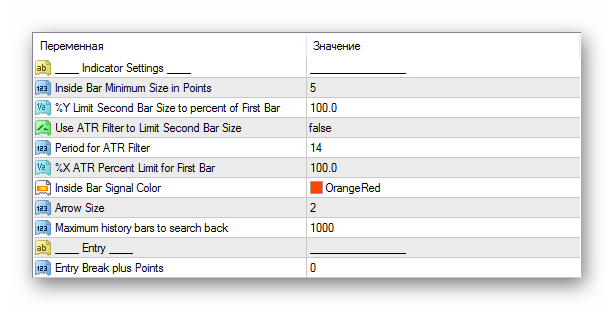
- Inside Bar Minimum Size in Points - the minimum size of the Inside Bar in points;
- Limit Second Bar Size to percent of First Bar - the maximum size of the inside bar as a percentage relative to the outside bar;
- Use ATR Filter to Limit Second Bar Size - use the ATR filter for the inside bar instead;
- Period for ATR Filter - ATR period;
- ATR Percent Limit for First Bar - the maximum ATR value of the inside bar relative to the outside one;
- Entry Break plus Points - the number of points added to the entry point (false breakout filter).
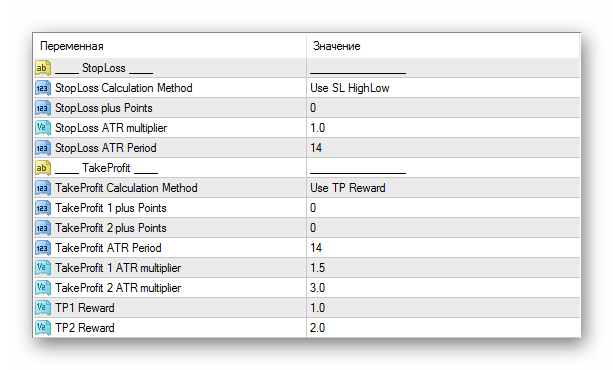
- Calculation Method - the stop loss calculation method;
- Plus Points - additional points added to the stop loss;
- ATR multiplier - ATR coefficient for stop calculation;
- ATR period - ATR period.
- Calculation Method - the take profit calculation method;
- 1 plus points - the number of additional points for the first take;
- 2 plus points - the number of additional points for the second take;
- ATR Period - ATR period for take calculation;
- 1 ATR multiplier - ATR reading coefficient for the first take;
- 2 ATR multiplier - ATR reading coefficient for the second take;
- TP1 Reward - the multiplier of the first take relative to the calculated value;
- TP2 Reward - the multiplier of the second take relative to the calculated value.
The remaining settings are responsible for changing the indicator's appearance and turning alerts on or off.
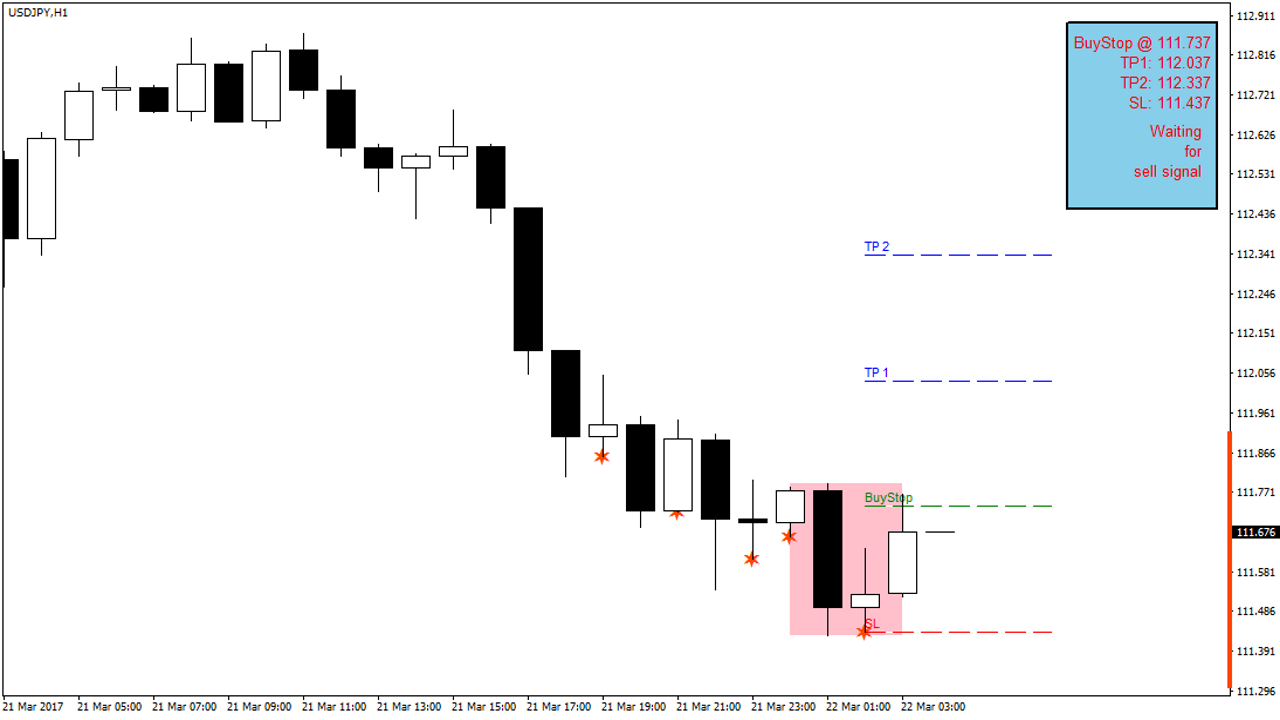
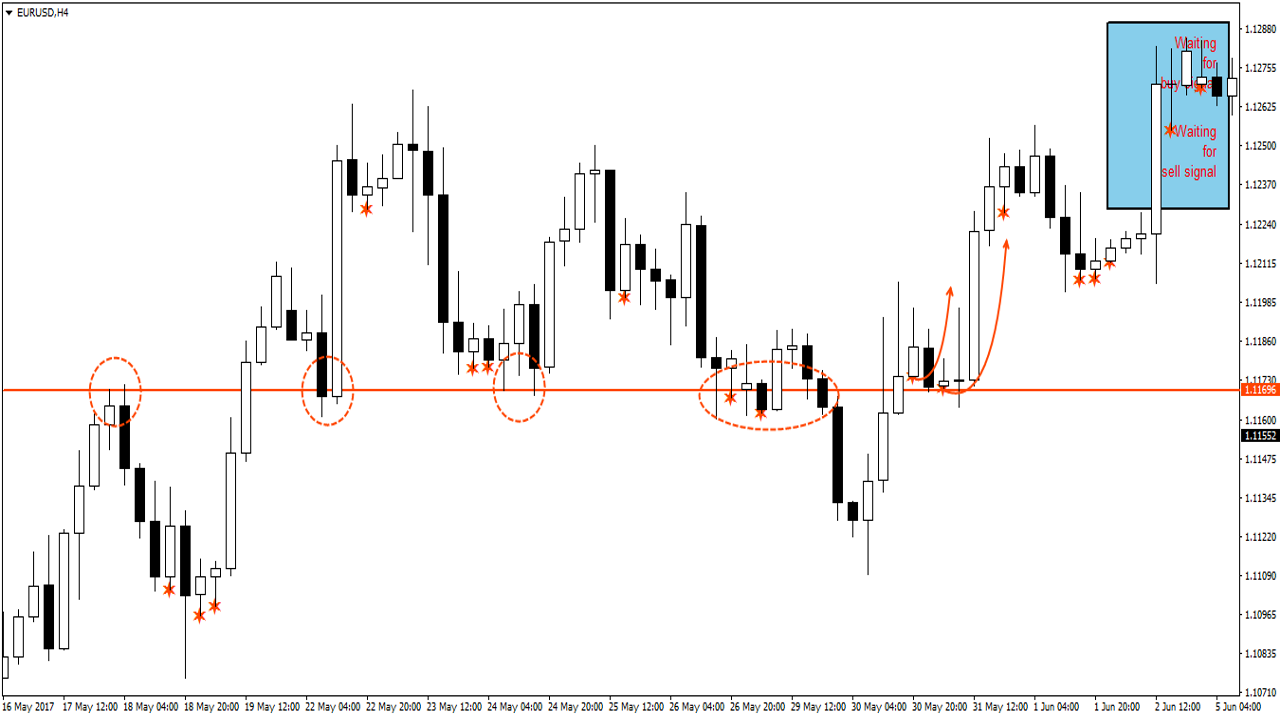
The found setup is displayed at the bottom of the bar as something resembling the Star of David. The color of this star can be changed in the settings. For the current setup, the area of the outside bar is shown (the red zone) - the place for placing pending orders and stop levels (the stop and double take). Also, in the upper right corner, the numerical values shown on the chart are duplicated.
Recommendations for Use

The pattern should be used only on large TFs, preferably H4 and above. If you simply cannot resist, you can trade the setup on H1 as well, but only if there is a good filter against price noise.
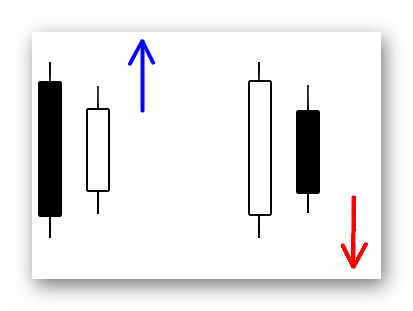
The most primitive way to trade the setup would be to determine the entry direction by the color of the inside candle. But this method is not very reliable, and besides, in the case of a properly formed setup the inside candle may have no body at all, or have too small a body.
 But what many will surely agree with is that entering a position against the trend is a thankless task. Why risk it when the market itself suggests the most likely price direction? The Inside Bar pattern, as we have already found out, is a breakout one, and therefore the probability of a false breakout in either direction is approximately equal to the probability of a real one.
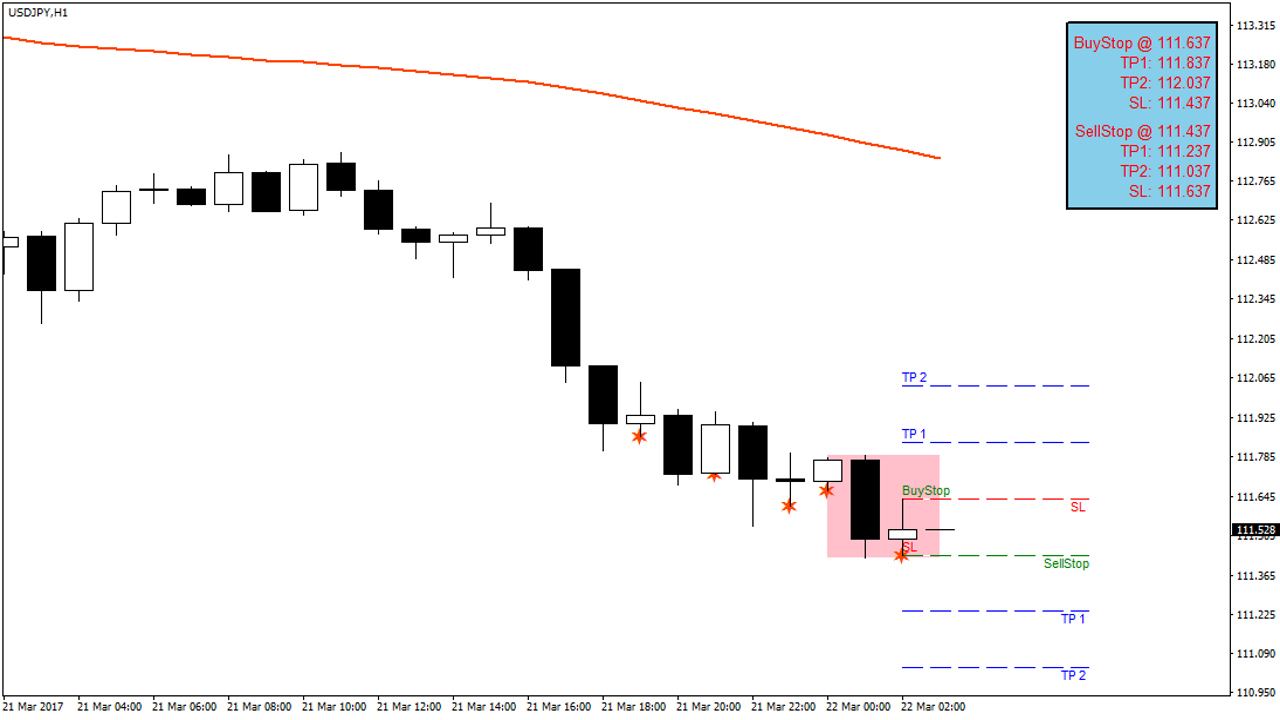
Even by adding the simplest trend filter, you can notice how a significant part of false signals is filtered out. As such a filter, for example, you can use an exponential MA with a period of 100. In fact, the period depends on the TF you trade on, but for H1 the hundred will be just right. As a rule, the larger the timeframe, the smaller the indicator period required.
We will consider that we are dealing with a down trend when the price is below the MA, and an uptrend when it is above the MA. Thus, if the Inside Bar formed below the MA, we trade only downward. To do this, we place only a sell order - Sell Stop.
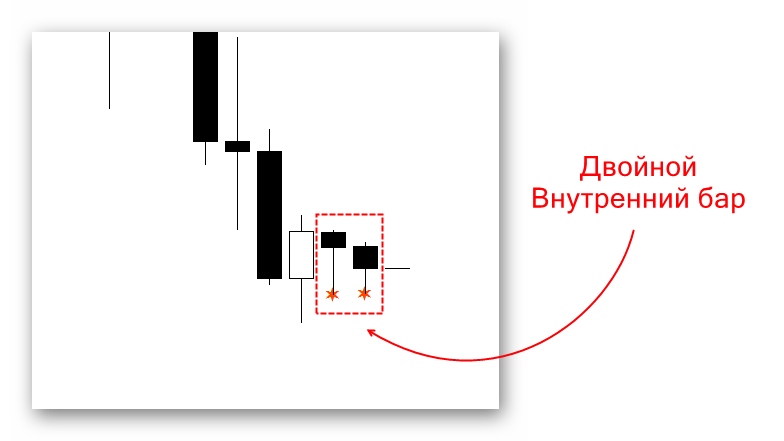
Also pay attention to multi-level setups. A nested Inside Bar is a very strong signal. Such a setup speaks of a longer consolidation, and therefore a stronger price surge can be expected afterward.
An equally strong signal can be obtained when an Inside Bar forms near important key levels. If a level has been tested many times in the past, the probability of a bounce from it is much higher than a breakout. Therefore, in such a case, it would be reasonable to trade FROM the level.
Conclusion

The versatility of the Inside Bar pattern may seem like a drawback to some and, on the contrary, an advantage to others. In any case, if you trade Price Action patterns, the InsideBarSetup indicator will save you a lot of time. At the same time, you will have much more time to react and think through the entry, which can directly affect trading profitability.
Download the Inside Bar Indicator
 Best regards, Alexey Vergunov
TradeLikeaPro.ru
Best regards, Alexey Vergunov
TradeLikeaPro.ru
