
Basic Volumes Indicator: Nuances of Using It in Forex

Volumes is the easiest technical indicator for a trader to understand. It reflects the real trading volume (turnover) by the number of bought.sold shares, futures, currencies, or options over the selected period of time.
How can an ordinary currency speculator take advantage of this tool in trading on Forex (and are there any at all?), what should be watched especially closely, and what are the indicator's strengths and weaknesses? Let us figure it out.
Indicator Characteristics
Platform: Any
Currency pairs: any
Timeframe: any
Trading time: around the clock
Recommended brokers: Alpari, RoboForex, NPBFX
In the Forex market, Volumes counts the number of ticks, the triggered orders of traders, without taking into account purchase or sale sizes. They are reflected most correctly only on ECN accounts, where direct trades take place with liquidity providers and clients of other brokers on the combined interbank venue.
Volume is an important complement to price change for understanding the "strength" of the trend and the level of liquidity at the current moment of the session. This explains why the indicator is included among the standard tools of technical analysis on almost all trading platforms.
Description of How the Indicator Works

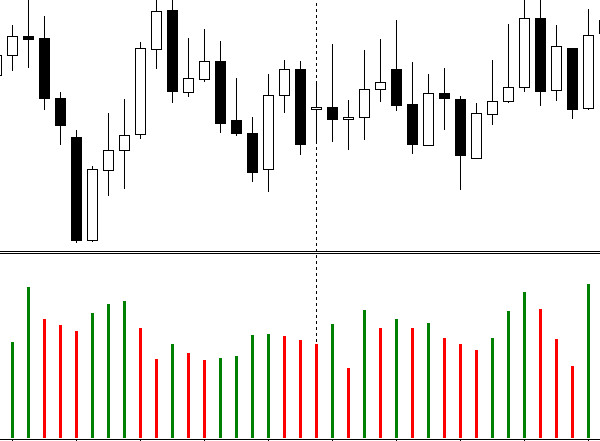
The Volumes indicator contains no complex formulas; it is a tick counter for a specific period of time equal to the selected timeframe. Ticks are displayed in real time as an accumulating histogram that changes as new trades appear in the market.
As soon as a candle closes, a new bar appears on the chart, colored in one of two colors, which is not connected to price change in any way:
Using the Indicator in Trading

Volumes is an informational indicator that is never used on its own, only as part of strategies as an additional filter.
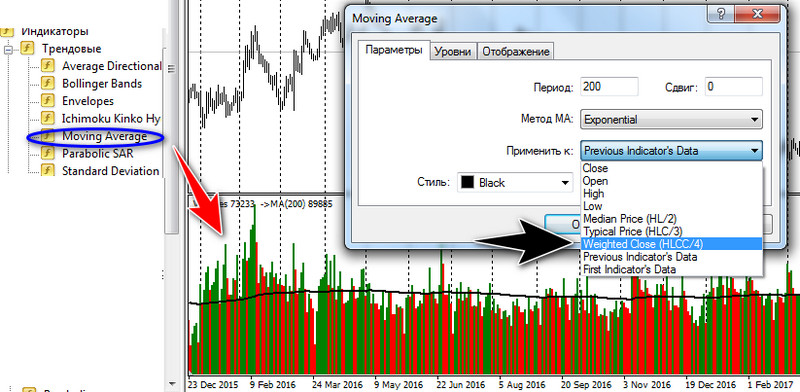
The current level of volumes is a fairly variable value that depends on many factors: seasonality, the day of the week, the time of day, and so on. Traders sometimes add a long-period moving average to the histogram in order to have a relative estimate of trading turnover.
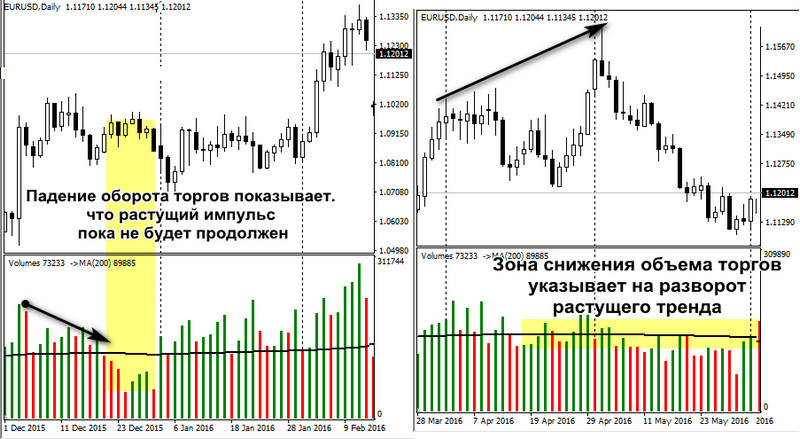
Market theory and practice make rising volumes a mandatory condition of a trend. Trading turnover below average values will help a trader forecast a flat or the end of a trend. In the first case, low volume readings will save the trader from trades in a "whipsaw," allowing entry at the moment the trend resumes. In the second case, they will work as a filter, stopping purchases at the top of the trend.
Consecutive red histograms in a rising or falling trend reveal the price manipulation of market makers, who continue to artificially support the directional move. Volumes gives a signal to refrain from new trades, ignoring entry points from the trading system until the correction begins.
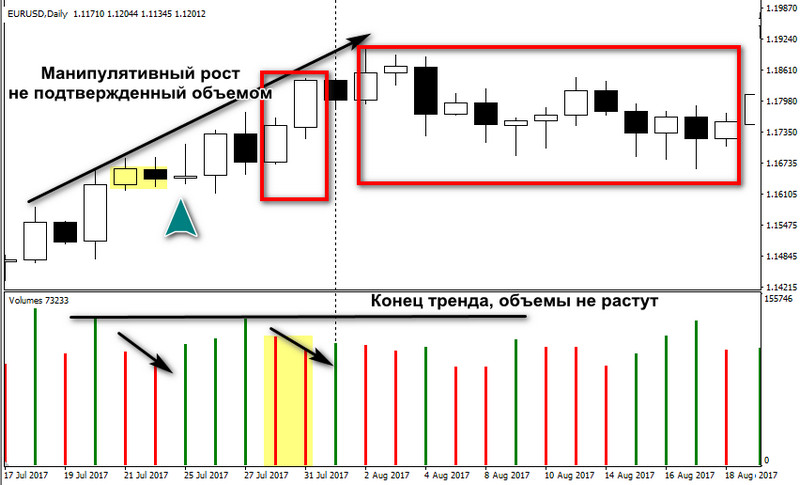
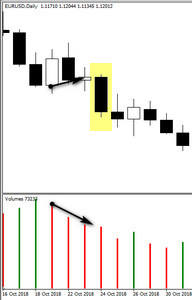
On the daily chart, three falling volume bars in a row can indicate a high probability of a correction candle appearing in a three-bar pattern. It is determined by connecting the opening price of the first candle that led to the formation of the red histogram bar with the closing price of the third candle.
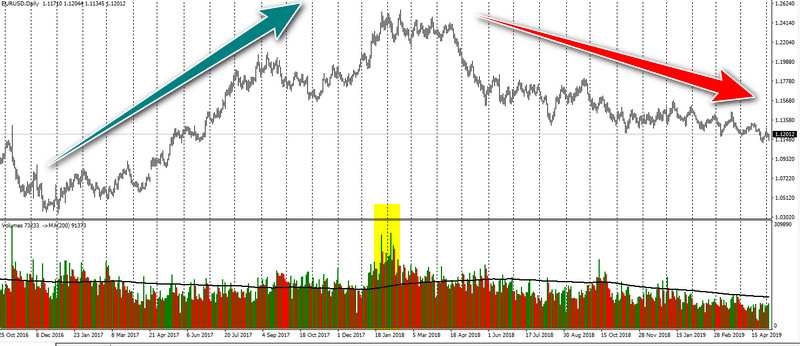
Abnormally high volumes on the Volumes indicator are another sign of a possible trend ending. They arise at the end of a global move, when large players invest very large funds in reversing long-term tendencies.
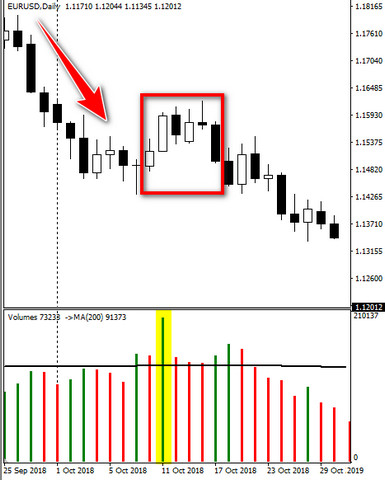
A sharp rise in the Volumes histogram often occurs during local trends, but it does not necessarily lead to a reversal. After a short correction and flat, the movement may continue in the same direction, but the trader will receive a signal allowing them to protect current profit or open a countertrend trade.
Description of Settings

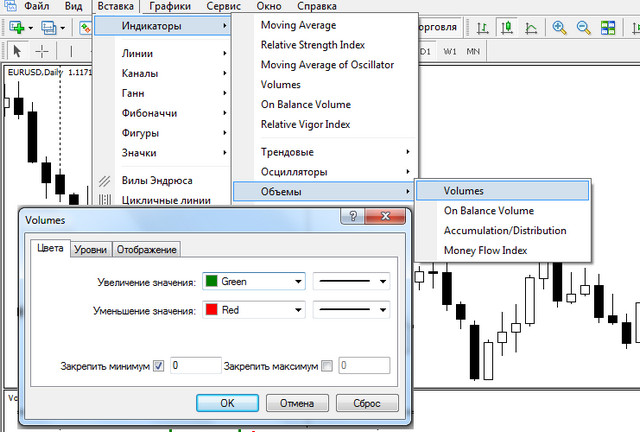
The indicator Volumes is located in the "Volumes" section, the "Indicators" option, of the "Insert" menu in the Metatrader 4 trading platform. The settings window contains no numerical parameters, only the selection of the thickness and color of the histogram bars.
On the "Levels" tab, the trader can set specific marks to designate anomalous historical values. As shown above, they may indicate points of a global reversal in long-term trends of a currency pair.
Conclusion

Volume is the main driver of the market, on which the other parameters depend: volatility, the strength of the reaction to fundamental news, the probability of continuation of currency trends. The founders of the Volume Spread Analysis theory managed to build, on comparisons of the volume histogram with candlestick patterns, a separate full-fledged theory of market analysis.
Often, for its application, a modified Volumes histogram is used, but a trader does not necessarily need to look for another indicator if he works by a different strategy. Volumes will not be superfluous in any trading system because it reflects the current strength of the market in real time.
Respectfully, Aleksey Vergunov
Tlap.io
