
All the Secrets of Trading on D1
 Hello, fellow forex traders!
D1 charts have always been something special: they write about them in books as the first step worth starting with (but nobody starts there), people are afraid of them ("you need a big deposit, ahhhh!!!"), and legends are made about them ("any fool can trade profitably on the daily charts!").
So what are daily charts in reality? The holy grail or an illusion of stability? We will talk about it at the webinar. All the secrets of daily charts, the strategies suited to them, and other nuances will be revealed.
Webinar Program
- Advantages of daily charts;
- Disadvantages;
- Suitable strategies;
- Money management for D1;
- Important trading nuances;
- Psychological aspects.
And as always, a warm homey atmosphere and answers to your questions await you.
Watch the Webinar Recording
Brief Summary
Historically, even before computers appeared, D1 was the only working timeframe. Intraday trading existed, but for most traders only the daily chart was available, and even that one was drawn by hand. Accordingly, the settings of all indicators were originally designed for the daily period. For example, RSI is 14 days, the moving average is 20 days, and so on.
As of today, D1 has been and remains the easiest in terms of difficulty. At the same time, there is nothing shameful about trading on D1, as if it were an obviously too easy task. No matter how you look at it, almost all trading books recommend starting specifically with daily charts.
Advantages of D1

If you use a "coin flip" strategy, then to break even (with an equal ratio of stop and take) on D1 you will need only slightly more than 50% successful trades. But on the minute timeframe, the number of profitable trades must already be 70-80%, which creates a simply colossal difference.
The reason is slippage and spreads, whose impact is not as noticeable on higher TFs. More details about how the statistics were gathered, as well as about testing other Price Action patterns, are described in a separate article.
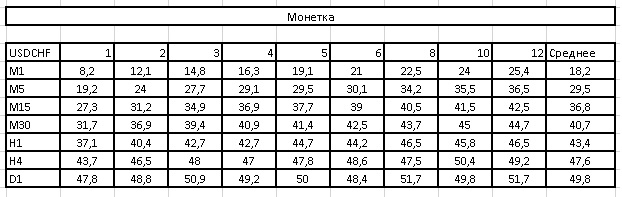
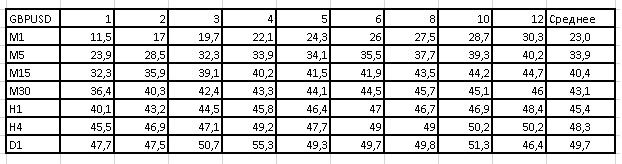
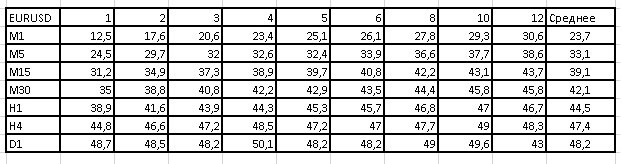
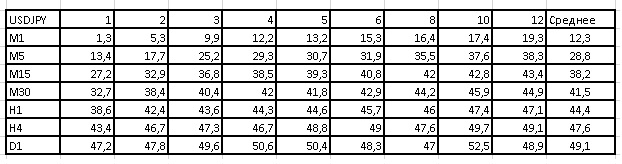
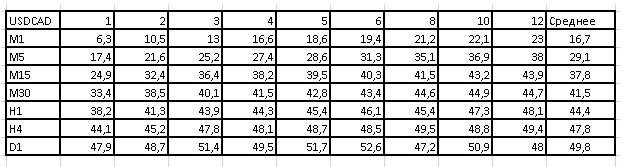
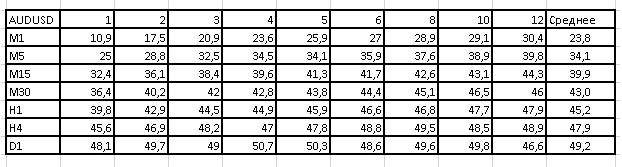
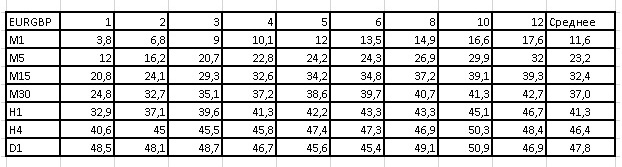
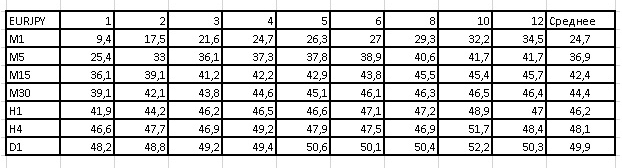
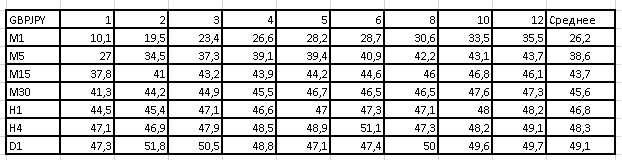
Also, on the daily chart there is much less noise and overall everything is clearer. Chart patterns are as close as possible to the examples from books and are easy to recognize. In turn, looking for patterns on the minute TF is like looking for a needle in a haystack.
Disadvantages

Of course, more time will be required for learning to trade on D1. For example, if you actively trade on M1, your training will take a few weeks. On H1 it will take a few months. But on D1 it will take from half a year.
In fact, there is nothing scary about that. Of course, it will take more time, but the result will be better. In general, almost any specialization requires at least six months of training.
Another disadvantage is that there are fewer strategies for D1 than for intraday timeframes. As a rule, many strategies can be found for M5, M15, or H1, while daily charts receive less attention.
Besides that, this may sound funny, but the next disadvantage is boredom. Indeed, there is no particular thrill in trading on D1, you cannot boast in chat about instant successes, and in general there is much less "showing off" in measured trading. In any case, "I am a scalper" sounds cooler than "I trade the daily charts."
Trading Nuances

There is one point: some traders are very afraid of swaps, arguing that they can "eat up" the whole deposit. In fact, if you hold trades for several months, then this really can become a problem. But if the holding time is around a week, then nothing terrible will happen: any large swap losses will definitely be offset by positive swaps, or the profit on the trade will be such that the swap will not matter much. In most cases, this can be neglected altogether; you may enter a minute later or earlier, and that difference of several points can already compensate for the swap. That is, even spreads and commissions can have more impact than swaps.
As an option, you can open trades in the morning. At the same time, during the Asian session there is very often a pullback. That is, if the trend is upward, then it is quite possible that overnight the price will pull back downward and you will even enter at a better price. But this does not always happen. Follow the rule "the market will still be there tomorrow." There is a pullback, we enter; there is no pullback, we do not enter. The same applies to trades from Friday to Monday. If there is a gap at the open, we trade the gap. If there is no gap, then we enter according to the setup. Everything is simple.
The next nuance is that some brokers have a non-standard candle closing time, because of which there are 6 daily candles per week instead of five. This is a bit confusing, interfering with the work of indicators and pattern identification. In that case, just use a demo of some broker with five daily candles per week for analysis, fortunately most dealing centers are like that.
A great many people try to optimize their trading by connecting a trailing stop, moving to breakeven, and so on to daily charts. The most suitable option is simply to let the market itself close positions by stop and take.
One more nuance is news. In fact, news can safely be ignored on daily charts. But, for example, if you know that non-farm payrolls are coming out today, and you already have a position with a decent profit, close it.
Money Management

There is an opinion that to trade on D1 you need a lot of money. In general, this is nonsense, since today there are both lots from 0.01, and cent accounts, so you can start even with 20 dollars. This is quite enough to build up statistics. When there is a work result, you can open a PAMM account, post your myfxbook monitoring, and attract investors. There is no need for any billions in the account, acceleration strategies, or any other crazy tricks.
The ratio of risk to profit is different for different instruments. If you take the average, then you can set 1 to 3. For example, a stop loss of 50 points and a take profit of 150 points.
On the daily charts, you can use a money management approach called a “fixed fraction.” That is, we use a certain fixed lot, for example, 0.01 lot for every 500 dollars of deposit. The deposit amount increased, the lot increased, and vice versa, the deposit decreased, the lot decreased.
How is this calculated initially? First, you decide on a strategy. Next, with the minimum lot (0.01) you trade in the tester across all major currency pairs. Then you calculate the maximum one-time drawdown in dollars, which at a 0.01 lot equals the number of points divided by 10. You can also add another 20-30 percent on top of this value, considering that in the tester the result is always better than in real life.
Knowing the level of maximum drawdown, we can calculate our risk level. For many traders, the psychological limit is a drawdown of 25%. Accordingly, having received a maximum drawdown of 100 points, which roughly equals 10 dollars, taking into account a risk of 20%, you will need 50 dollars of deposit for each 0.01 lot. In more detail, such a method of capital management is described in a separate article.
Strategies

Now let us consider what strategies can be applied on daily charts. If you, for example, take some strategy on M15 and compare its result in points with a strategy on D1, then do not be surprised if in most cases these will be the same numbers. As a rule, the difference is only in the number of trades; on small TFs there will be far more of them. The reason there are more trades while profitability is the same is slippage, spreads, and so on.
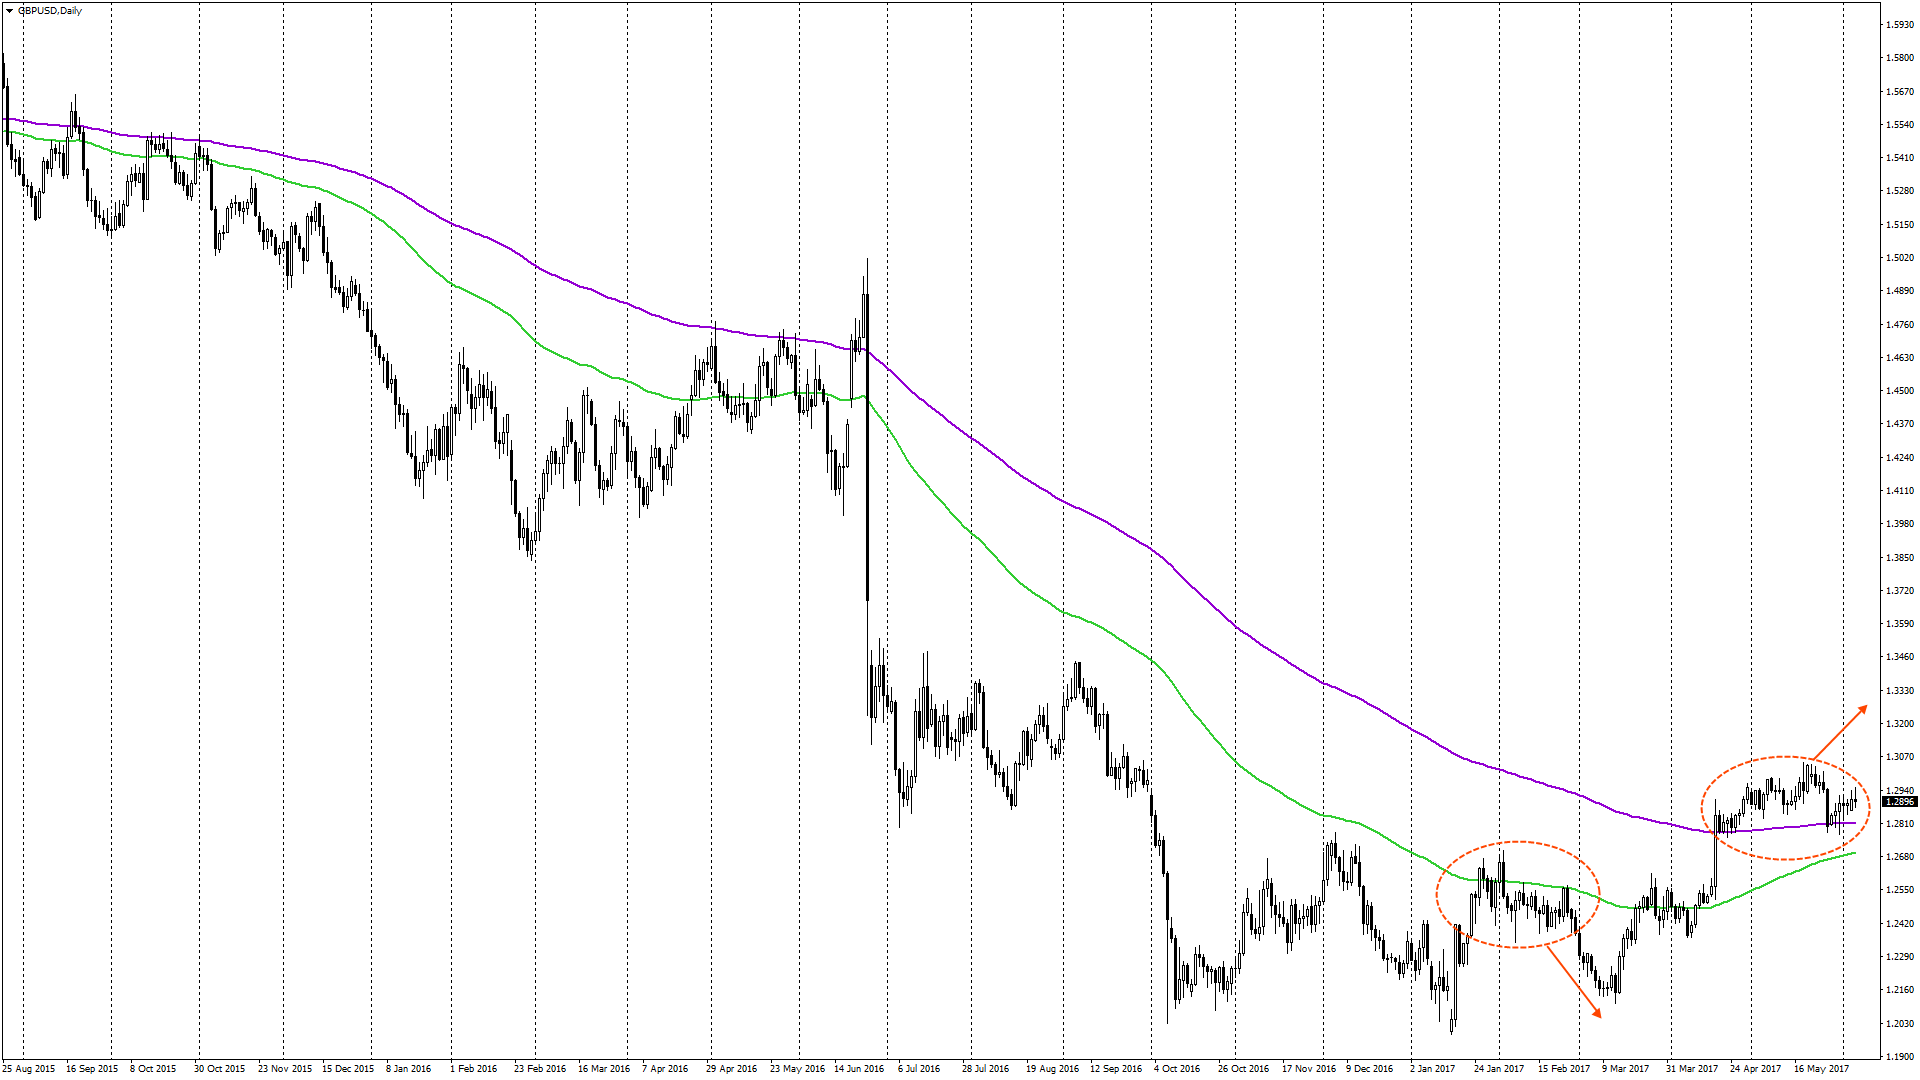
To begin with, set up the chart window that is optimal for you, so that on the one hand it is not too small, but on the other hand not too large either. Next, what is worth watching are the 100 and 200 moving averages. The 200 average has been used since time immemorial as a trend indicator; it is a kind of standard. These periods reflect two natural cycles, half a year and a year (there are roughly 200 working days in a year). The type of average does not matter much overall; EMA will be the optimal option.
As an option, you can trade a bounce from the average. A bounce, as is known, happens much more often than a breakout. In general, both bounces and breakouts with confirmation work; the signals exist and they play out. You can even trade crossings, since on the daily charts even the simplest strategies using a single oscillator work.
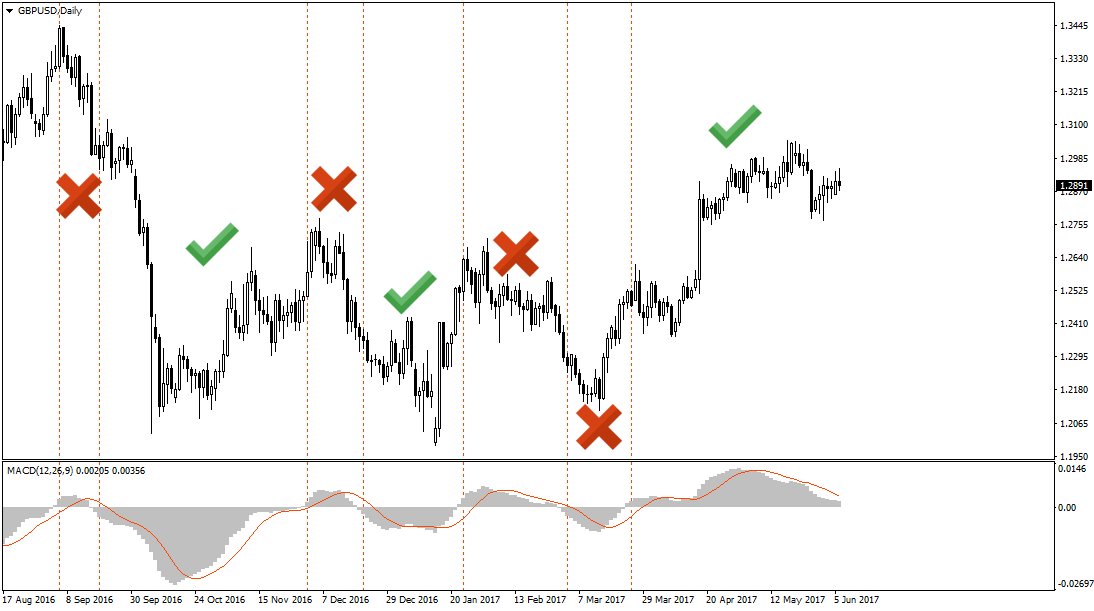
 Here, for example, is the MACD oscillator. On the daily charts, even the most primitive strategy based on the oscillator crossing the zero line will work. In this case, take into account a risk-to-profit ratio of 1/3. This does not mean that you need to trade this way, but even this strategy will work.
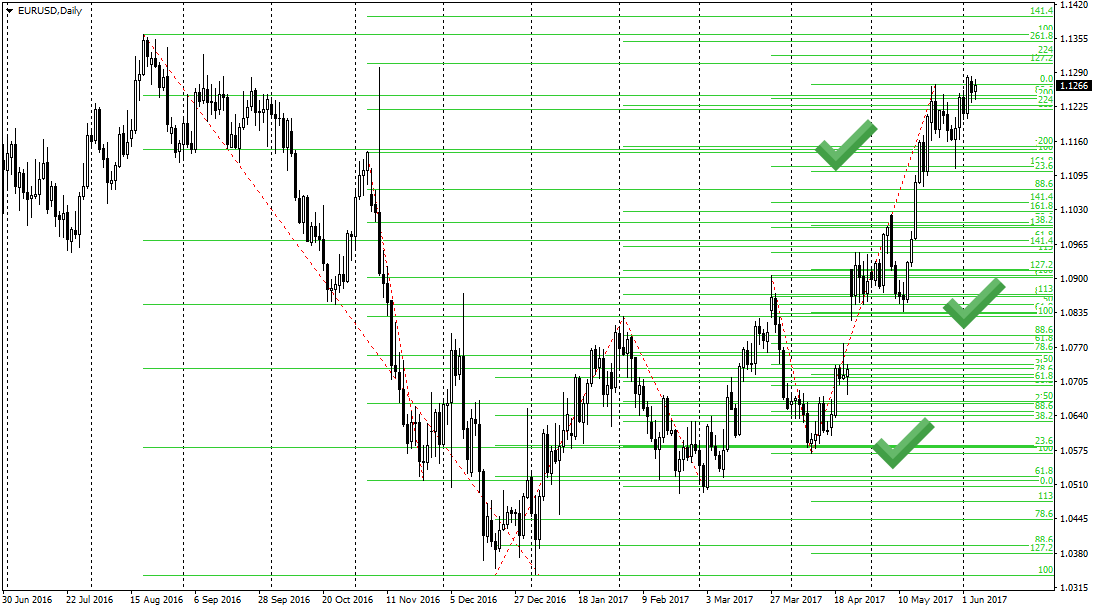
 You can use Fibo levels to determine clusters. You do not even have to look at the deviation readings; simply mark for yourself the places with the greatest concentration of levels.
 You can also work from simple support/resistance levels. Mark all the levels on the chart that catch your eye. If a level is not obvious, there is no point in marking it, since others will most likely not see it either. You can trade directly from the levels. The only condition is the presence of a clear bounce. And it does not matter whether all the rules of Price Action are observed; there is a bounce, we enter the trade. Overall, the main thing we look for on the daily charts is a clear trend and entries on pullbacks.
Psychological Aspects

One of the many advantages of D1 is the amount of time to think. Here you can draw an analogy with one interesting experiment in the game of chess. During it, grandmasters and second-category players were brought together. Regular games were played, where 135 seconds were given per move, and blitz was played with 6 seconds per move. For the masters, there was no strong difference noticed between the two games, whereas for amateurs the presence of time to think played a key role. That is, if you are not a mega professional, D1 will give you a strong advantage: time to think through the trade.
To tune yourself for trading better, you can create a certain ritual. For example, tearing off a new sheet in a notebook, opening a journal, brewing a cup of tea or coffee, in a word, anything. Such a systematic action allows the brain to switch into analysis mode, being less distracted by external irritants. That is, it is a kind of training for switching into working mode.
Conclusion

Despite the fact that D1 gives a lot of time to think, you should not overdo it and stare at the market for too long; everything has a reasonable limit. As a rule, it is the very first decision that is the most correct one, provided there is at least some experience.
Here you need calmness and the ability to wait, since for weeks absolutely nothing may happen. In any case, you need to maintain concentration and note the slightest successes, in which keeping a journal can also help. Even if you took a loss, but it turned out to be smaller than the previous one, that is already work on mistakes. Perhaps it is exactly the slightest edge to the upside that D1 gives that will turn your trading from losing into profitable.
Best regards, Pavel Vlasov TradeLikeaPro.ru