
All About the Versatile Envelopes Indicator
 Hello everyone!
In one of the previous articles, we already got acquainted with such an indicator as moving averages. We also examined one of the representatives of channel indicators, namely Bollinger Bands. These indicators deservedly enjoy enormous popularity among financial market traders. They are included in a huge number of trading systems and have brought many tens of percent in profit. But what if we combine the ideas of these indicators? This time we will examine such a simple yet versatile classic indicator as Envelopes, or Moving Average Envelopes.
Indicator Characteristics
Platform: any
Currency pairs: Any
Timeframe: any from H1 and above
Trading time: around the clock
Indicator type: trend
Recommended brokers: Alpari, Exness, Amarkets
Description
The technical indicator Moving Average Envelopes, or simply Envelopes for short, is formed by two moving averages, one of which is shifted upward and the other downward. The trader determines the choice of the optimal relative value of the band boundary shift based on the average volatility of the market: the higher it is, the greater the shift.
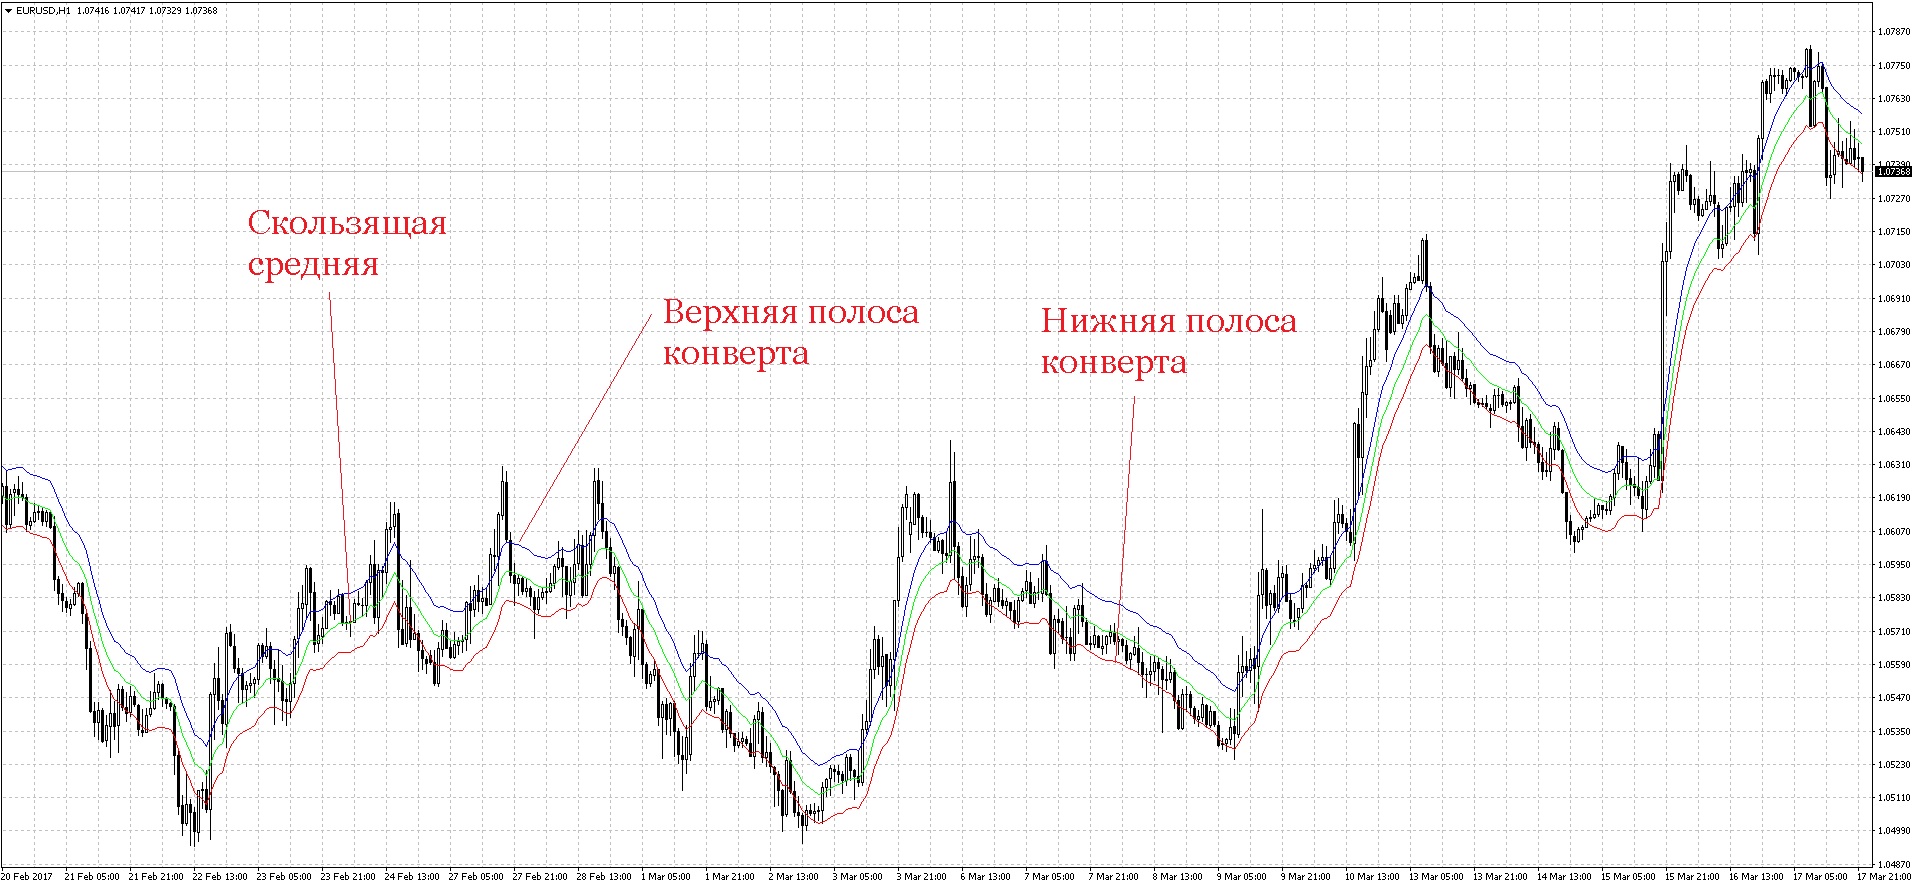 Envelopes define the upper and lower boundaries of the normal range of price fluctuations of an instrument. The simplest interpretation is that a sell signal appears when the price reaches the upper boundary of the band, and a buy signal when it reaches the lower boundary. The use of the Envelopes technical indicator is based on the natural logic of market behavior: when, under pressure from especially zealous buyers or sellers, prices reach extreme values, that is, the upper or lower boundary of the band, they often stabilize, returning to more realistic levels. This logic gave rise to an entire family of trading systems called mean reversion systems, or Reversal Systems, literally reversal systems. The same principle is also used to interpret an indicator such as Bollinger Bands, about which there has already been an article on the blog.
History

As is known, there are several different approaches to trading in the financial markets. These include various types of arbitrage, modern types of systems based on Big Data and Data Mining analysis, analysis of macroeconomic indicators, and more. But there are three universal simple approaches that have proven their profitability over many years. These are trend systems (Trend trading), when a trader determines the presence of a trend, waits for a pullback from the main movement, and enters a trade expecting the trend to continue:
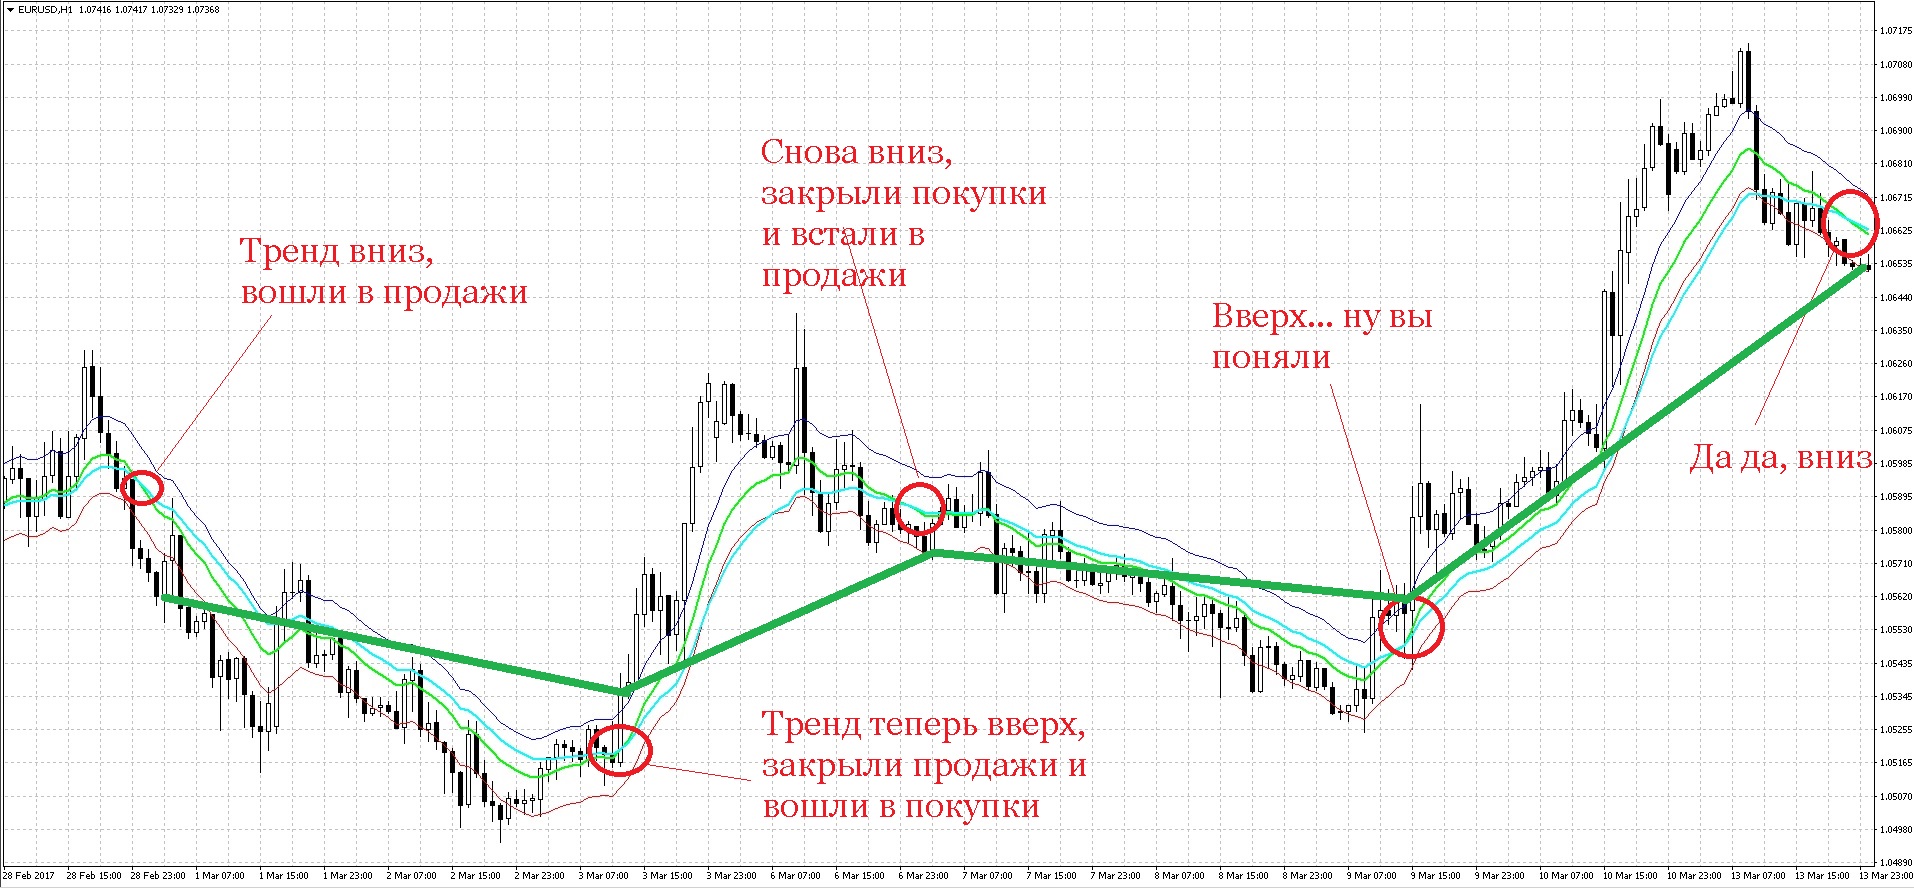 Trend trading is good when those very trends exist. When the market is in a prolonged flat, trend trading brings prolonged drawdowns.
This is a mean reversion trading system (Mean Reversal trading), when a trader determines the average, or fair, value of an instrument's price and waits for deviations from this value in order to enter a trade expecting the price to return to its average value:
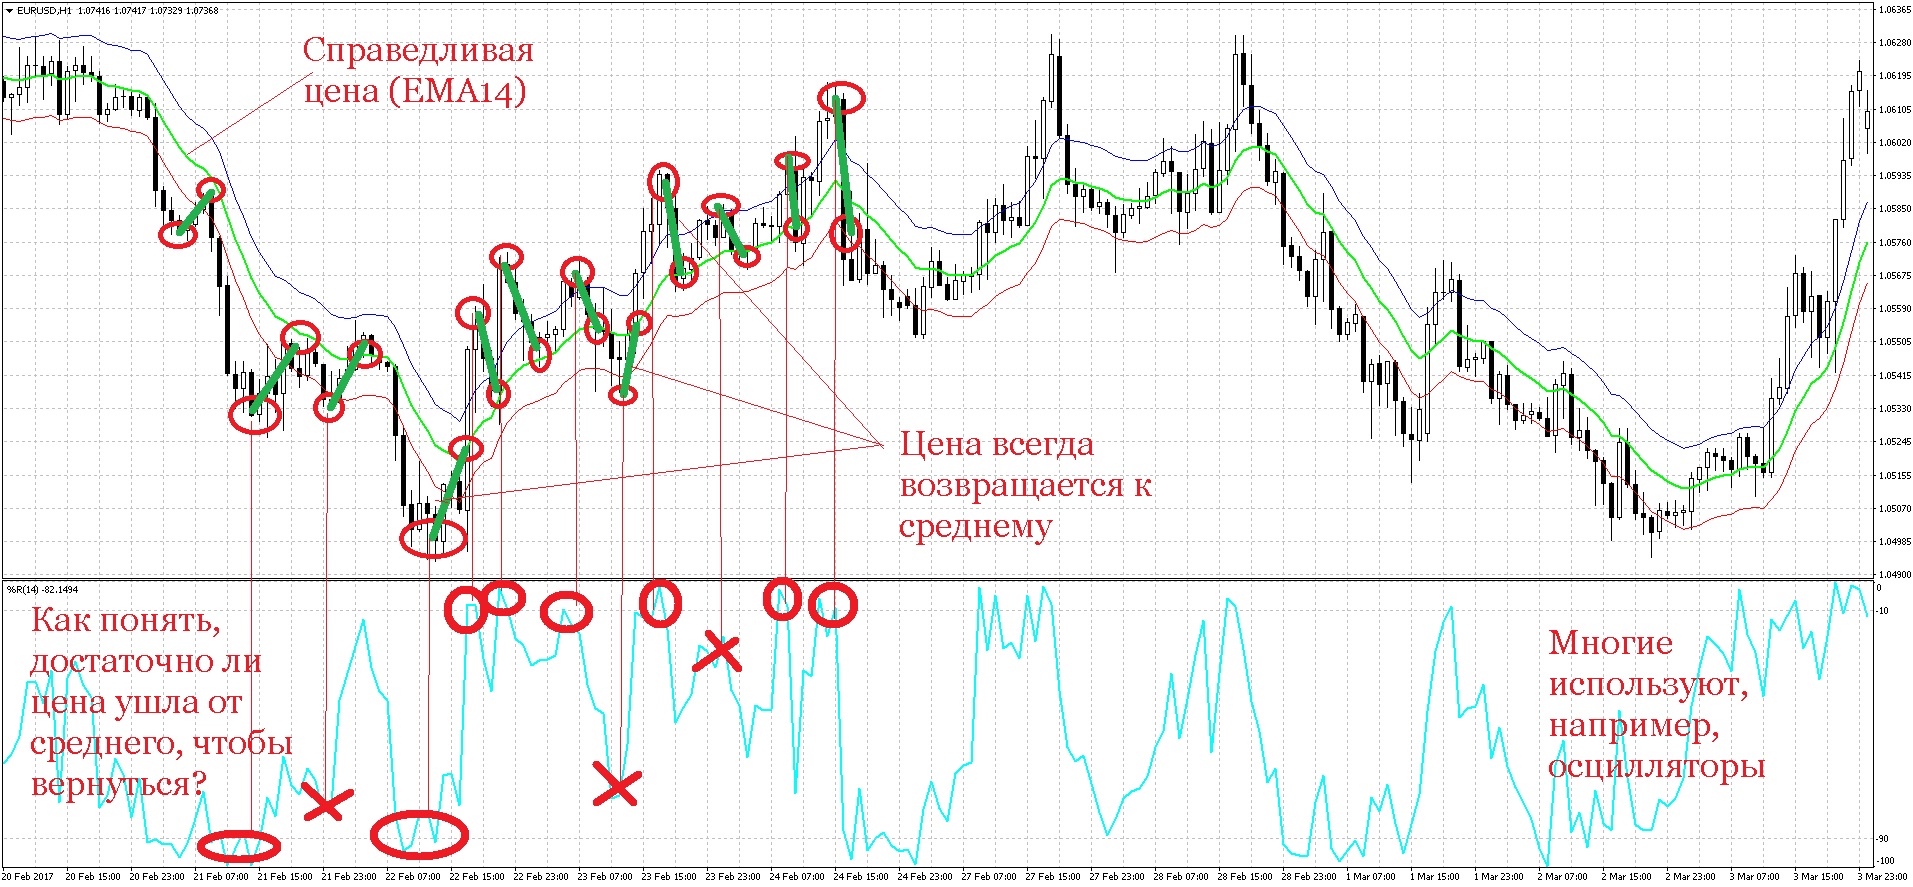 To understand when one should enter a trade, when the price has already moved far enough away from the fair price, as a rule, various methods of constructing channels around the average and various filters are used, such as one oscillator or another. Such trading, in turn, is good when everything is calm in the market. During a trend, systems built on this principle will lose money or mark time. Generic is built on this principle, using Bollinger Bands, and it uses a feature of the forex market, namely a calm market during the Asian session. If you try to trade such a strategy in any market, including during the European session, you will suffer losses. Depending on current volatility, the price can move very far away from the moving average; moreover, such systems work well when that very fair price does not change much over time and remains roughly at one level. In the case of a trending market, the fair price always follows the trend, which is not always easy to take into account in trading.
There is one more simple concept that we will need today. This is momentum trading, that is, trading impulses. Impulses, unlike a trend or a flat, do not require additional preparation. That is, you do not need to analyze and decide whether it is a trend or a flat now, whether now is the right time to trade an impulse. It is always the right time: if there is an impulse, then we trade it.
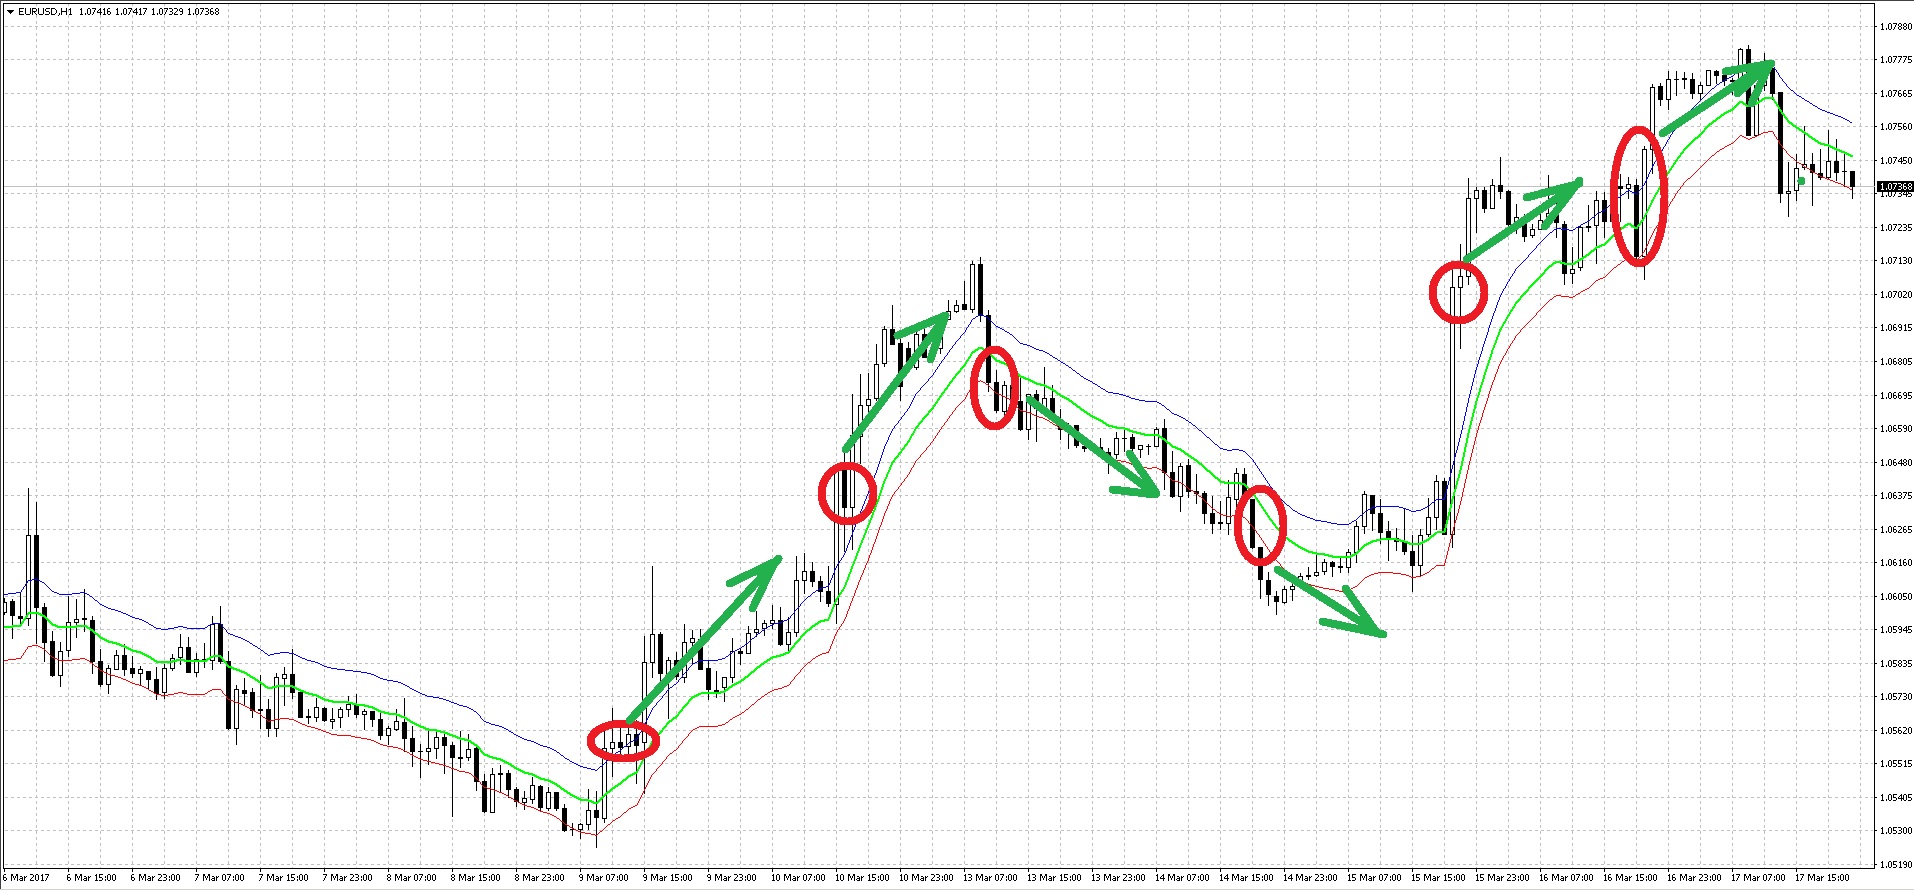 That is, in the general case, we identified an impulse that broke through something and entered in the direction of the breakout expecting the movement to continue. Such trading is very similar to trend trading, but it is more short-term in nature. As a rule, such trading is characterized by the use of channels or local extremes. Entry into trades mostly occurs with pending stop orders. The most famous example that comes to mind is trading by Richard Dennis's Turtles method.
Unfortunately, the author of this indicator is unknown. It is only known that Envelopes were intended to help traders who trade moving average breakouts filter out false signals. Approximately like this:
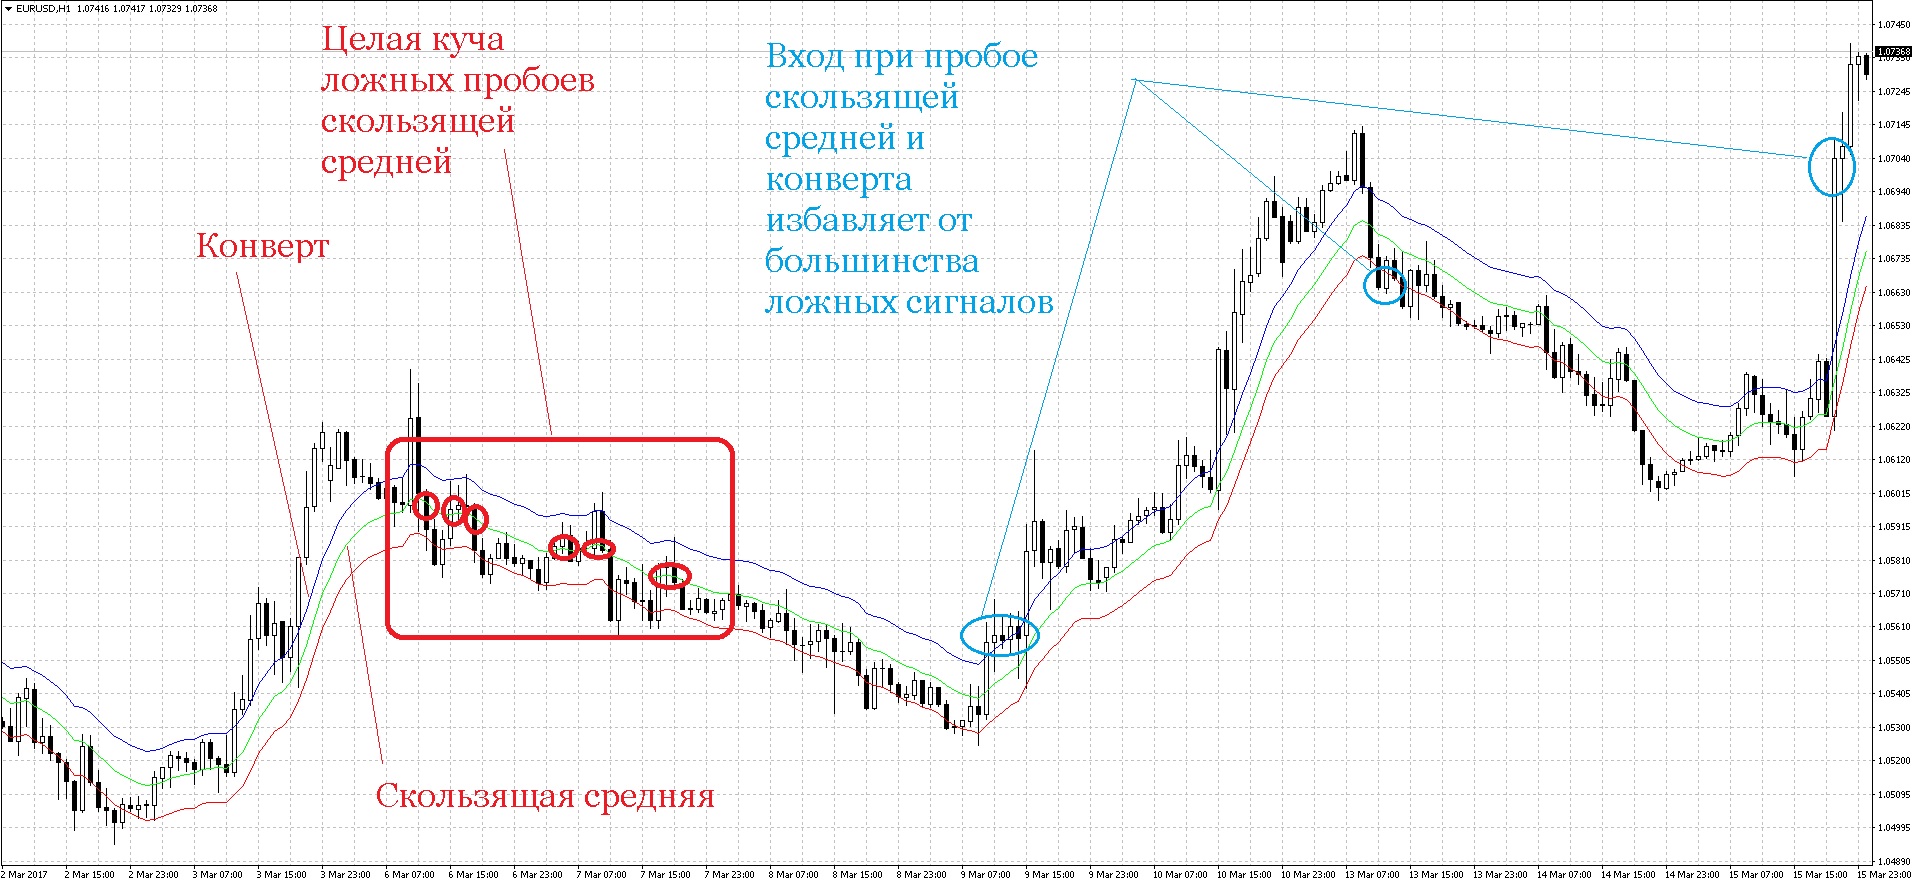 That was the original logic behind the use of the indicator. But nothing stands still, and traders discovered that Envelopes can also be successfully used in mean reversion trading. In addition, the indicator is also used for trend trading: when the price is found near the boundary of the indicator, this is taken as a sign that the pullback from the main trend is ending. So, as you can see, the scope of Envelopes is very broad.
Calculation

Before beginning the study, we need to find out what exactly we are dealing with. How this indicator is structured and what its calculation formula is. In fact, everything is quite simple here:
The indicator includes three moving averages, but the middle one, that very fair price, for some reason is not plotted in many platforms. As you can see, the formula is quite simple.
Parameters

Indicator period - changing the number of periods n for MA averaging, by default = 20. The periods are set in the same way as for moving averages.
Shift – similarly to moving averages, you can shift Envelopes relative to the current bar deeper into history, with a negative number, or to the right into the future, with a positive number.
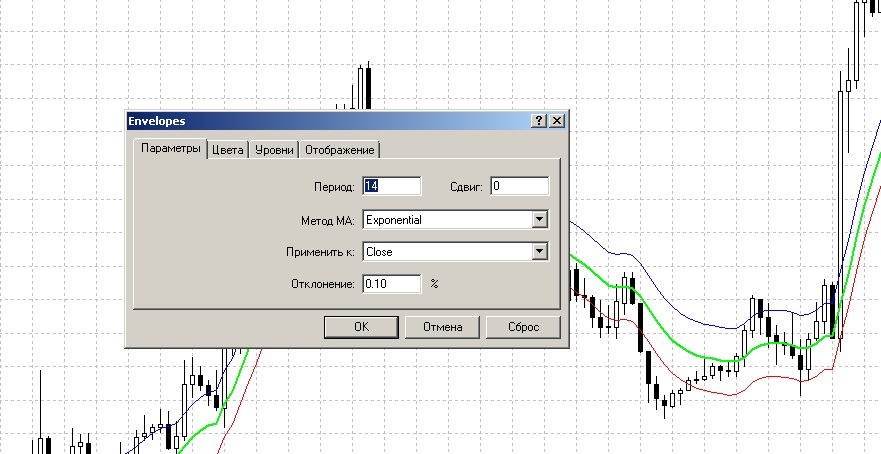 MA Method – the method of calculating the moving average;
Apply to – the price used to calculate Envelopes. Also, similarly to the moving average parameter, it is recommended to build the indicator using the closing price (Close);
Deviations - the value of the shift k, by default equal to 0,1. The optimal value of the shift, expressed as a percentage, depends on the volatility of the instrument. The greater the volatility, the higher the shift value. The parameter needs to be selected visually for a specific market and timeframe, but usually values from 0,05 to 0,5 are used.
Advantages and Disadvantages

The disadvantages of the indicator are considered to be the same as those of moving averages: the lag of the indicator in determining the trend. Nevertheless, the indicator is still a channel, so it is rarely used as an ordinary moving average. More often, Envelopes is used in impulse systems and mean reversion systems. Speaking of the latter option, more complex channel indicators are better suited for determining the reversal point, with formulas that incorporate adaptation of the channel width to current market volatility.
Band Breakout

A simple buy signal occurs when the price closes above the Moving Average, and a sell signal occurs when the price drops below the Moving Average.
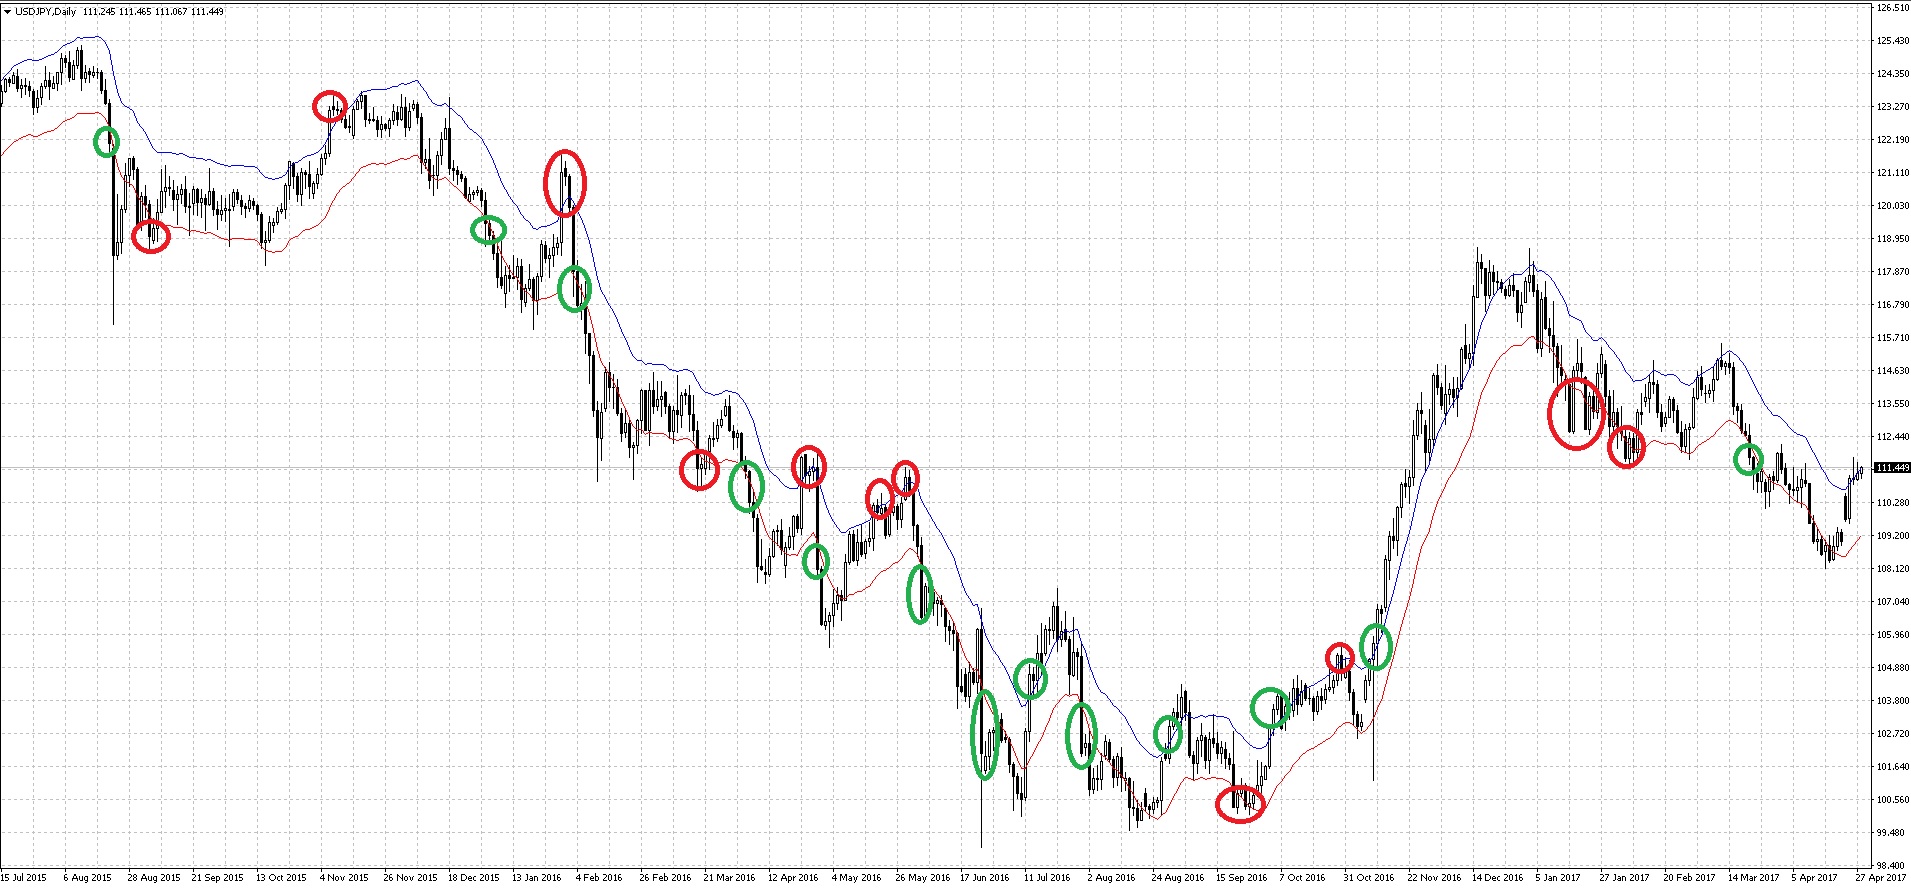 We have already discussed what problems arise with trading based on the Moving Average. To limit the number of losing trades, some technical analysts suggest adding a filter to moving averages. They add lines that are located at a certain distance above and below it, forming envelopes. Trades are made only when the price moves through these lines, called "envelopes" because they surround the original moving line. When one of the Envelope lines is broken, one can judge the presence of a new trend with more confidence.
In the figure above, green circles mark the breakouts that continued and from which it was possible to take at least a small profit. Red marks false breakouts. As can be seen, there are about the same number of both, so the correct ratio of risk to profit comes to the fore, and that is what will generate the trader's profit. As we can see, if the price breaks through the channel and does not return back within the next few candles, quite often one can count on a prolonged trend. Therefore, it is important to use pending orders, set short stops whenever possible, move stops to breakeven fairly early, and not limit the position's profit. Ideally, the stop loss should be set slightly beyond the level of return into the channel, and the pending order should be placed a short distance from the breakout candle. If the breakout candle is closed at too great a distance from the channel, it is better to skip such a trade. It is better not to use take profit at all, but to apply a careful trailing stop by candle shadows following the price. And using a move of the stop to breakeven will save you from losses in half of the false breakout cases.
Bounces from the Envelopes Lines

Among the first supporters of this countertrend strategy was Chester Keltner. Back in 1960, in his book "How to Make Money in Commodities" he described the idea of Keltner Bands, using slightly more complex calculations. Instead of using the close to calculate the Moving Average, he used the typical price, which is defined as the average of the high, low, and close. And instead of building envelopes using a fixed percentage, Keltner changed the width of the envelope, adapting it to the 10-day simple Moving Average of the daily range (high minus low).
Envelopes determine the upper and lower boundaries of the normal price fluctuation range. When the upper boundary is reached, it is a signal to sell, and when the lower boundary is reached, it is a signal to buy. A sell signal occurs when the price reaches the upper boundary of the band, and a buy signal occurs when it reaches the lower boundary. The choice of the optimal relative size of the band boundary shift is determined by market volatility: the higher it is, the greater the shift. The use of envelopes is based on the natural logic of market behavior: when, under the pressure of especially zealous buyers or sellers, prices reach extreme values, that is, the upper or lower boundary of the band, they often stabilize, returning to more realistic levels. The same principle is used when interpreting Bollinger Bands.
Later, John Bollinger, taking as a basis the idea of Moving Average envelopes and Keltner Bands, developed his own bands, which surround a simple Moving Average and are located two standard deviations above and below the Moving Average.
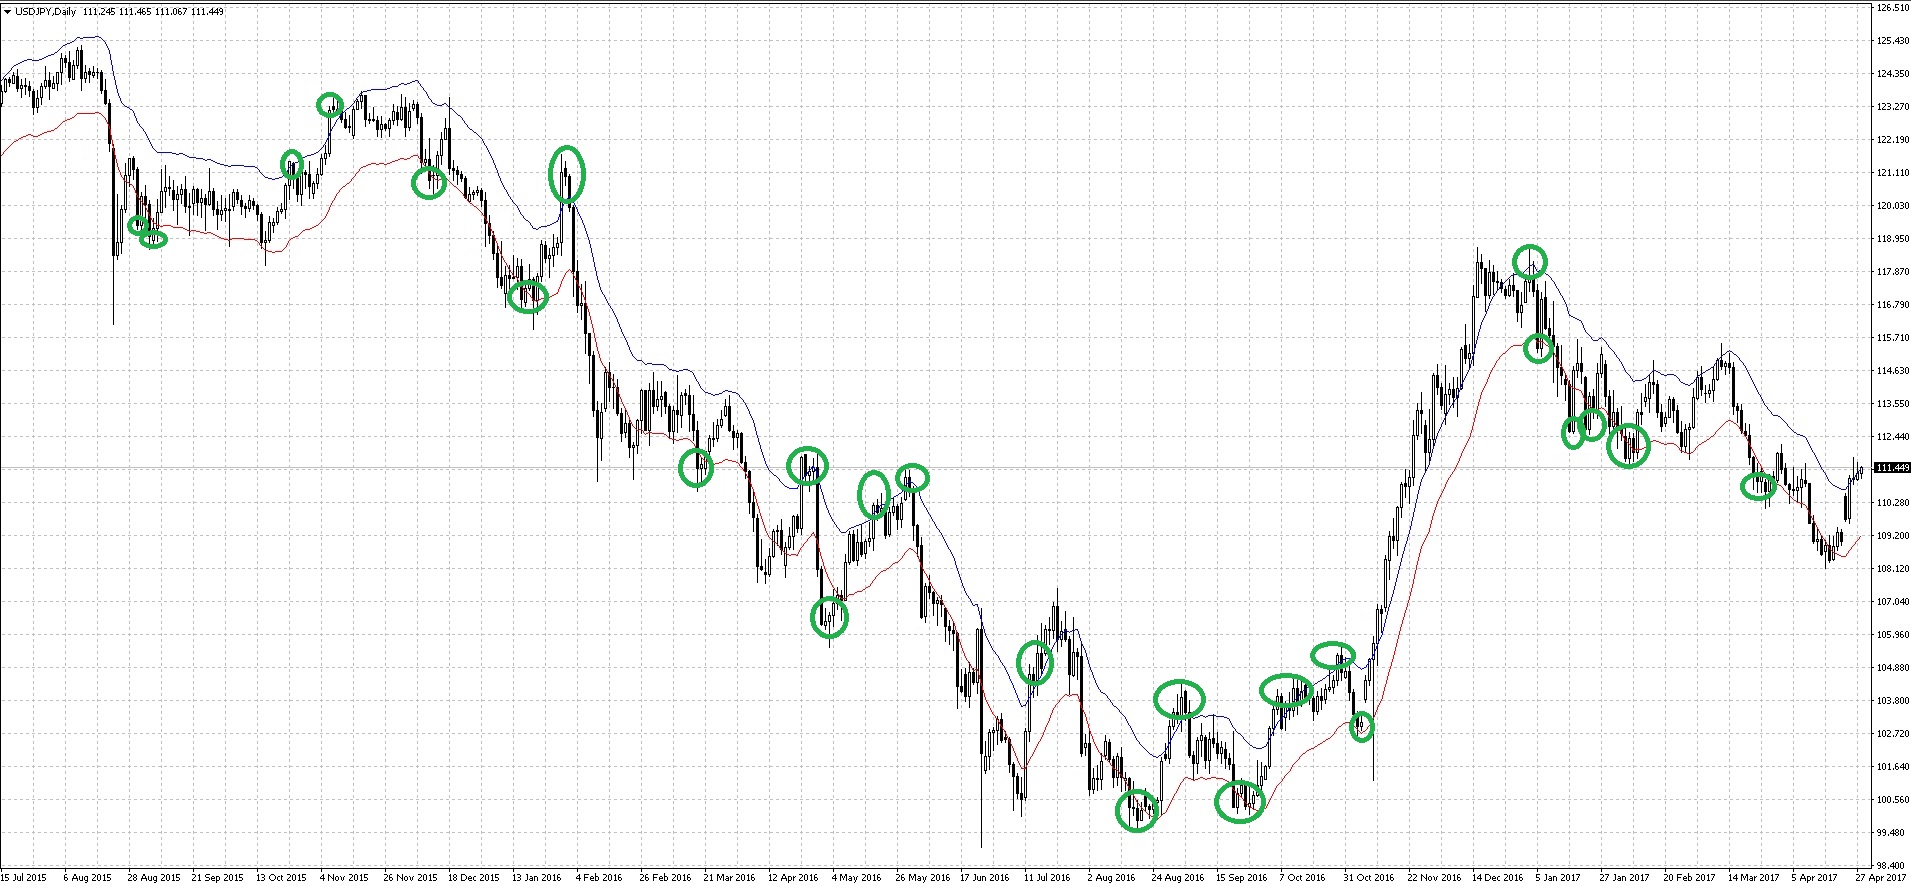 In the figure above, the breakouts after which the price returned back into the channel and went at least to its middle are marked. It is easy to notice that since trading goes inside the channel, the potential profit in this case is limited. But the stop loss, on the contrary, should be wider to give the price a chance to sink a bit more before reversing. False channel breakouts happen more often, but they are harder to trade because the profit-to-risk ratio is not in favor of profit. Therefore, with such trading, success comes precisely from entry accuracy, from the percentage of profitable trades. If a breakout system may well have only 40 percent profitable trades, then here it should be at least 60%. If you look at the chart of any instrument, you will easily see that true breakouts are usually accompanied by increased volatility, whereas false ones occur in calm periods, and this is what you need to start from when building your system. By trading at the "right time", you can significantly increase that very percentage of profitable trades. A vivid example is the overwhelming majority of night scalpers. They use false channel breakouts at night, when volatility in the markets is low, in combination with wide stops and small profit targets. An unpleasant aspect of trading by this principle, in the case of a not entirely successful trading system design, can be an excessively wide stop loss, which in the event of a force majeure situation, and this is not uncommon in the markets, eats up all the profit accumulated over a month. To prevent this from happening, everything must be reasonable. A system with an average profit of 6 points and an average loss of 40 points is rather difficult to work with from a psychological point of view and in the future may bring many losses with a slight change in market character. Of course, it is desirable to strive for a 1 to 1 ratio, but most often in this type of system this is unattainable. Another thing to keep in mind is the system's maximum loss. If it exceeds the average by more than three times, it is worth thinking before trading such a system.
Conclusion

Moving Average envelopes are a useful tool for determining the trend once it has formed. In addition, envelopes can be useful for recognizing, with high probability, reversal points in short-term trends. Traders in any financial market can profitably use this technical tool with the proper skill and experience.
Respectfully, Dmitriy aka Silentspec TradeLikeaPro.ru
