ZUP Indicator - your assistant in identifying harmonic patterns
 Hello everyone!
At one of our previous meetings, we got acquainted with harmonic patterns in Forex: we looked at what they are and how they can be identified on charts. However, finding such setups manually is not so easy even for experienced traders, not to mention beginners. To solve this problem, a Russian developer (nickname nen on the onix-trade forum) created a special indicator, ZUP. The latter automatically detects harmonic patterns (including Gartley and Pesavento patterns), identifies Andrew's Pitchfork, Fan, Arcs, Zones, Fibonacci extensions, and other figures. This is a truly universal tool that saves you from painstaking and lengthy work, and in today's review we will examine it in detail.
Like other developments of this kind, the indicator is based on a fairly ordinary ZigZag. That is, ZZ values serve as the basis for all constructions, as a simplified model of the price chart. This cannot be called either a minus or a plus; the indicator still has its own peculiarities in terms of identifying price extremes. In this regard, the key parameter in the formula for success is a properly configured ZigZag.
Fortunately, unlike other similar developments, ZUP offers a choice of one and a half dozen ZigZag varieties. Thus, you are not limited to a single implementation of it, but can choose the most suitable algorithm. To do this, first you need to understand the differences between the various ZigZag implementations.
ZigZag Indicator
Actually, the indicator itself sets two main tasks. First, it combines many ways of determining extremes on the chart and, second, it provides convenient tools for finding patterns based on the found extreme points. Therefore, the method of determining extremes deserves a separate discussion.
By default, the indicator is configured to search for Pesavento patterns. The ZigZag used to build patterns is selected by the very first parameter, ExtIndicator. This parameter can take one of 15 values.
1. Standard ZigZag from MT4

This indicator works similarly to the one included in the standard MT4 package. The indicator updates only the last wave point. That is, after the indicator has determined a reversal, the point becomes fixed, after which the search for a new reversal begins.
Indicator parameters:
- minBars (ExtDepth in the original) - the minimum period in bars limiting ZigZag convergence;
- ExtDeviation - the distance in points between peaks;
- ExtBackstep - the period in bars between two extremes;
- ExtMaxBar - determines the number of candles for indicator calculation (0 - the entire history);
- ExtMinBar - the index of the first candle.
2. Alex's ZigZag

The indicator determines price extremes based on the average bar price. It is considered that the trend has changed its direction when the average price of the next bar differs by the specified deviation value.
Indicator parameters:
- minSize - the deviation value in points;
- minPercent - the deviation in percent (used when minSize = 0);
- chHL - enables the display of ZigZag support and resistance lines;
- PeakDet - enables the display of previous extremes;
- chHL_PeakDet_or_vts - set the value to false to display iVTS on the chart;
- ExtMaxBar - determines the number of candles for indicator calculation (0 - the entire history);
- ExtMinBar - the index of the first candle.
The indicator's advantages include speed, that is, a lower load on the processor and a more predictable algorithm for determining highs and lows. The disadvantages include a more rigid algorithm, which is why suitable parameters need to be selected for different timeframes in order to correctly determine price waves. The standard ZigZag does not have this drawback.
3. ZigZag Ensign
The indicator's algorithm is similar to that in the Ensign platform. The trend is determined by the lows and highs of the bars. That is, we have a bullish trend when the low and high of the current bar are above the values of the previous one. Conversely, a bar with a decreasing low and high indicates a bearish trend. At the same time, over the minBars segment the trend must remain in a single state. A trend change occurs when the price changes by more than minSize points. In this case, the indicator values are redrawn only after the bar closes.
Indicator parameters:
- minBars - the minimum number of bars for decreasing highs or increasing lows;
- minSize - the minimum movement in points for the trend-change condition;
- chHL - enables the display of ZigZag support and resistance lines;
- PeakDet - enables the display of previous extremes;
- chHL_PeakDet_or_vts - set the value to false to display iVTS on the chart;
- ExtMaxBar - determines the number of candles for indicator calculation (0 - the entire history);
- ExtMinBar - the index of the first candle.
4. ZigZag Ensign (modified)

The algorithm is almost identical to the standard Ensign, except that the minSize parameter value specified in the input parameters will be ignored and calculated automatically.
Indicator parameters:
- minBars - the minimum number of bars for trend accounting;
- chHL - enables the display of ZigZag support and resistance lines;
- PeakDet - enables the display of previous extremes;
- chHL_PeakDet_or_vts - set the value to false to display iVTS on the chart;
- ExtMaxBar - determines the number of candles for indicator calculation (0 - the entire history);
- ExtMinBar - the index of the first candle.
5. Tauber's ZigZag
ZigZag based on a recursive algorithm. First of all, across the entire section of history the indicator searches for a single maximum. Then, on the segments before and after the found maximum, two minima are searched for, and so on. The search for new extremums stops when the distance between neighboring peaks becomes smaller than the minSize value.
- minSize - the minimum distance between a neighboring maximum and minimum;
- minPercent - the same as minSize, but as a percentage of price;
- PeakDet - enables the display of the levels of previous extremums.
6. ZigZag Gann Swing

The algorithm is based on the idea of constructing Gann swings. Unlike the original interpretation, the indicator ignores the outside bar rule. This was done because of the mismatch between ZigZag calculations in real time and on history. For the sake of consistency in calculations, it was decided to move away from the original algorithm.
Indicator parameters:
- minBars - here the parameter sets the trend level: 0 - a 1-bar trend (minor); 1 - a 2-bar trend (intermediate); 2 - a 3-bar trend (major); more than two - a higher-level trend;
- PeakDet - enables the display of the levels of previous extremums;
- ExtMaxBar - determines the number of candles for indicator calculation (0 - entire history);
- ExtMinBar - index of the first candle.
7. DT-ZigZag (standard)

ZigZag based on a higher timeframe. The external indicator “ZigZag_new_nen3” is used for the calculation. The calculation method is similar to the standard indicator from MT4.
Indicator parameters:
- GrossPeriod - selection of the timeframe on which the ZigZag will be calculated;
- minBars (ExtDepth in the original) - limits the minimum number of bars on which ZigZag can converge by no more than ExtDeviation points;
- ExtDeviation - distance in points between peaks;
- ExtBackstep - is responsible for the number of bars between peaks;
- PeakDet - enables the display of the levels of previous extremums;
- ExtMaxBar - determines the number of candles for indicator calculation (0 - entire history);
- ExtMinBar - index of the first candle.
Please note that all indicators with the DT prefix must be located in the same folder as ZUP.
The indicator is drawn like a regular ZigZag, except that the peaks are displayed by several points, the number of which is a multiple of the higher period.
It is also necessary to take into account that the maxima and minima found on the higher TF may not correspond to the maximum values on the lower TF. The ZigZagHighLow parameter, when set to true, will use the lower TF values for drawing, and when set to false, the higher TF data. In the second case, there may be a situation where the extreme ZigZag values will hang in the air.
8. DT-ZigZag (Klota)

In this case, the indicator “DT_ZZ” is referenced.
Indicator parameters:
- GrossPeriod - selection of the timeframe on which the ZigZag will be calculated;
- minBars - the minimum number of bars for trend consideration;
- PeakDet - enables the display of the levels of previous extremums;
- ExtMaxBar - determines the number of candles for indicator calculation (0 - entire history);
- ExtMinBar - index of the first candle.
9. DT-ZigZag (Candida)

An indicator called “CZigZag” is used.
Indicator parameters:
- GrossPeriod - selection of the timeframe on which the ZigZag will be calculated;
- minBars (ExtDepth in the original) - the minimum period in bars that limits ZigZag convergence;
- ExtDeviation - distance in points between peaks;
- PeakDet - enables the display of the levels of previous extremums;
- ExtMaxBar - determines the number of candles for indicator calculation (0 - entire history);
- ExtMinBar - index of the first candle.
10. DT-ZigZag on Gann swings

An indicator called “Swing_ZZ” is used. The algorithm is similar to ZigZag Gann Swing, but it is applied on a higher TF.
Indicator parameters:
- GrossPeriod - selection of the timeframe on which the ZigZag will be calculated;
- minBars - the minimum number of bars for trend consideration;
- PeakDet - enables the display of the levels of previous extremums;
- ExtMaxBar - determines the number of candles for indicator calculation (0 - entire history);
- ExtMinBar - index of the first candle.
11. Searching for Gartley Patterns

The Search Patterns value includes searching for Gartley patterns based on the standard ZigZag indicator. The ZigZag itself for searching Gartley patterns can be selected via the AlgorithmSearchPatterns parameter, which can take 7 different values:
- 0 - the standard ZigZag from MT4;
- 1 - Alex's ZigZag, in which the ray size is specified in points;
- 2 - The same ZigZag, but the size is set in percent;
- 3 - Similar to the Ensign ZigZag;
- 4 - Touber's ZigZag;
- 5 - ZigZag based on Gann swings;
- 6 - Talex's ZigZag.
Also, take these parameters into account:
- ExtMaxBar - determines the number of candles for indicator calculation (0 - full history);
- ExtMinBar - the index of the first candle.
12. Talex's ZigZag

The search for extremes is carried out in a not entirely standard way - from left to right.
Indicator parameters:
- ExtPoint - the number of points (ZigZag extremes);
- PeakDet - enables the display of previous extremum levels.
13. SQZZ ZigZag (Tovaroveda)

A fairly complex algorithm is used here. The area is calculated along the ZigZag rays, and the ZigZag itself is computed based on the results.
Indicator parameters:
- minSize - the minimum distance between a neighboring maximum and minimum;
- minBars - the minimum number of bars for taking the trend into account;
- PeakDet - enables the display of previous extremum levels;
- ExtMaxBar - determines the number of candles for indicator calculation (0 - full history);
- ExtMinBar - the index of the first candle.
14. Wellx's ZigZag

A ZigZag based on levels, developed by wellx.
Indicator parameters:
- auto - use of automatic level calculation;
- minBar - the percentage parameter for the StLevel level;
- maxBar - the percentage parameter for the BigLevel level;
- StLevel - the first zigzag level;
- BigLevel - the second zigzag level;
- PeakDet - enables the display of previous extremum levels;
- ExtMaxBar - determines the number of candles for indicator calculation (0 - full history);
- ExtMinBar - the index of the first candle.
The ExtStyleZZ parameter is responsible for displaying the ZigZag on the chart. When set to true, the ZigZag is drawn with lines; when false, it is drawn on the chart with dots. Colors are set via the standard “Colors” tab.
Installation and Setup
The indicator is installed in the usual way, that is, by moving the file into the Indicators directory. To do this, open the terminal data folder via File - Open Data Folder. The required folder will be located in MQL4 - Indicators. For the indicator to appear in the terminal, you need to restart the program or click Refresh via the context menu of the navigator window.
The indicator is constantly evolving, so you can find a large number of ZUP versions on the web. Unfortunately, most of them no longer work with the latest MetaTrader builds. In version 63, the ability to build Fibonacci Arcs was added. In version 64, 2 new ZigZags were added - Talex's and Tovaroveda's, and for Mikmed channels it is now possible to set custom extensions. In version 137, the pattern search algorithm was improved and the ability to save and load patterns from files appeared. Also, in the latest versions, most of the errors related to building patterns using standard MT4 objects were fixed.
We will consider version 150 specifically, although a newer version with expanded capabilities has already appeared in the Market. In particular, manual wave markup and traditional wave levels are supported. Version 150, nevertheless, has more than all the necessary functionality for automatic pattern identification and is distributed free of charge. You can compare the functionality yourself by downloading the demo product from the Market.
Including the ZigZag settings, all indicator parameters are divided into 16 blocks.
- Selecting the main ZigZag for calculating Pesavento patterns;
- Managing Fibonacci lines;
- Pesavento pattern settings;
- Gartley pattern settings;
- Andrews Pitchfork parameters;
- Mikmed channels;
- Fibo Fan;
- Fibo Expansion settings;
- Versum levels;
- Fibo Arc (Arcs);
- Golden Spiral;
- Pivot ZigZag settings;
- Channel parameters;
- Fibo Time Zones parameters;
- Additional indicator settings;
- General settings.
We will consider only the parameters related to Gartley patterns, since these formations are of the greatest interest. The indicator itself has four hundred parameters available, and it makes no sense to discuss each of them separately. Detailed instructions and a description of the input parameters from the indicator's author are attached to the article.
After setting all the necessary parameters, you do not need to do anything else. It is enough to place the indicator on the chart, after which it will immediately show the latest formed pattern.
Gartley Patterns

To begin with, you need to choose a ZigZag for building patterns. Here you have a choice of 7 options. The AlgorithmSearchPatterns parameter is responsible for this, and it takes effect when ExtIndicator is set to "search Patterns".
First of all, you may want to disable the display of Andrews' Pitchfork. Even if you use Andrews' Pitchfork in trading, a large amount of visual clutter will still interfere with your perception of the market. If you only need pattern search, it is better to disable all extra functions. To disable Andrews' Pitchfork, set the ExtPitchforkDynamic and ExtPitchforkStatic parameters to 0.
You can also disable the display of correction values on the ZigZag slopes. To do this, set the ExtHidden value to 0 in the Pesavento patterns block. This way, a clean ZigZag will be shown on the chart.
A Gartley pattern detected on the chart looks approximately like this:
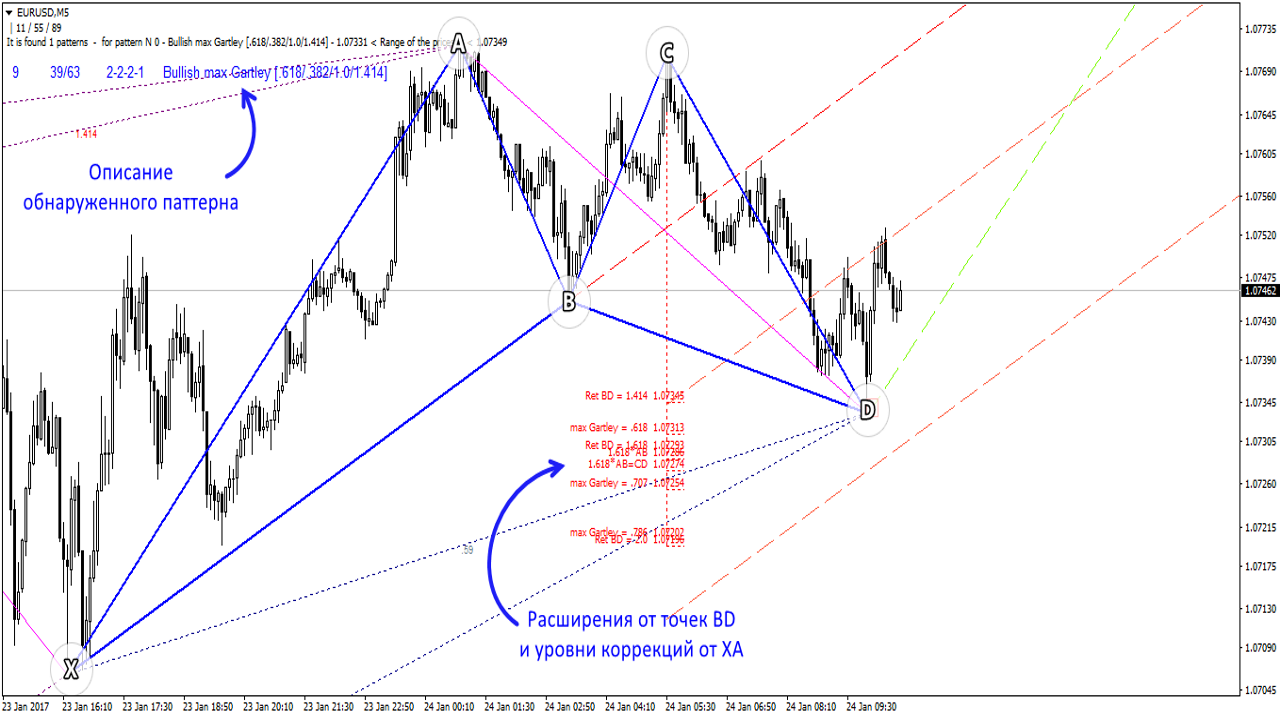 A description of the detected pattern is displayed in the upper left corner of the chart. You can also find out the name of the pattern by hovering over the formed figure. Below point D, the expected extension levels from points XA and BD are marked. You can disable the display of levels by setting the PotencialsLevels_retXD parameter to 0. Specifically which levels to display is specified in the visibleLevelsABCD parameter.
The green line on the chart is the mirrored trendline of the last leg. The red channel levels are built parallel to segment XB. Both lines indicate the expected price reversal after the pattern is formed.
If the last ZigZag extremum is redrawn, the pattern will also be redrawn to fit the new peak and all levels will be recalculated.
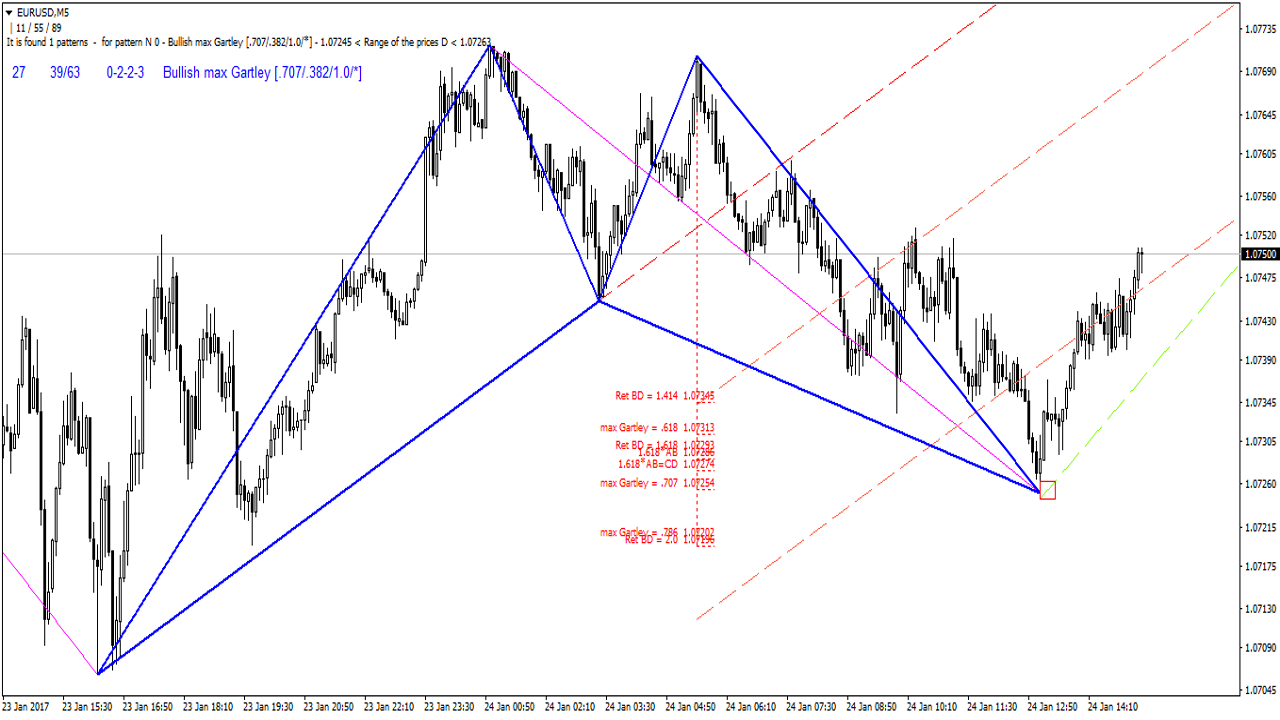 By default, only the latest pattern is displayed. But you can also display all patterns on a certain section of history by changing the ExtGartleyTypeSearch parameter. A value of 1 will display all patterns on the maxBarToD section with recalculation when ZigZag extrema change. A value of 2 will run the search only once, meaning the found patterns will not be recalculated when ZigZag changes.
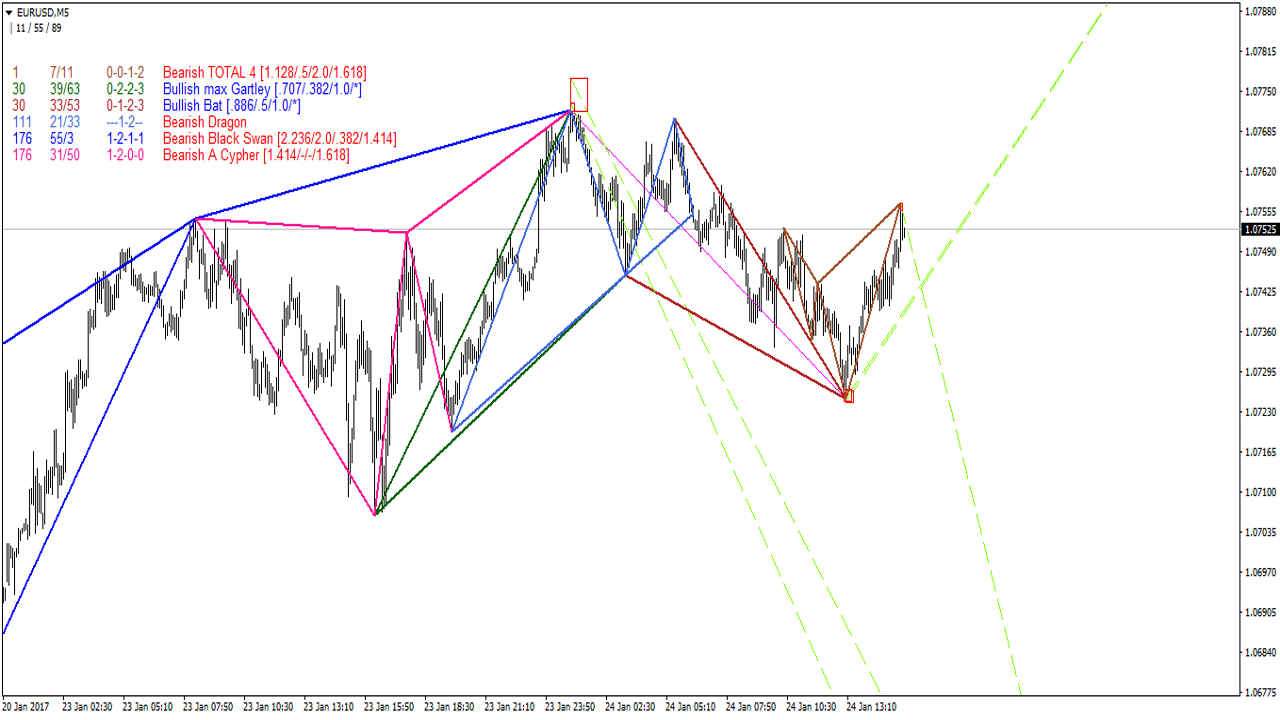 The SelectPattern parameter determines which specific patterns to search for on the chart. You can leave it at 0, then the search will be performed across the entire set of patterns. Or you can leave the display of only one specific pattern (starting from index 9), for example, Black Swan.
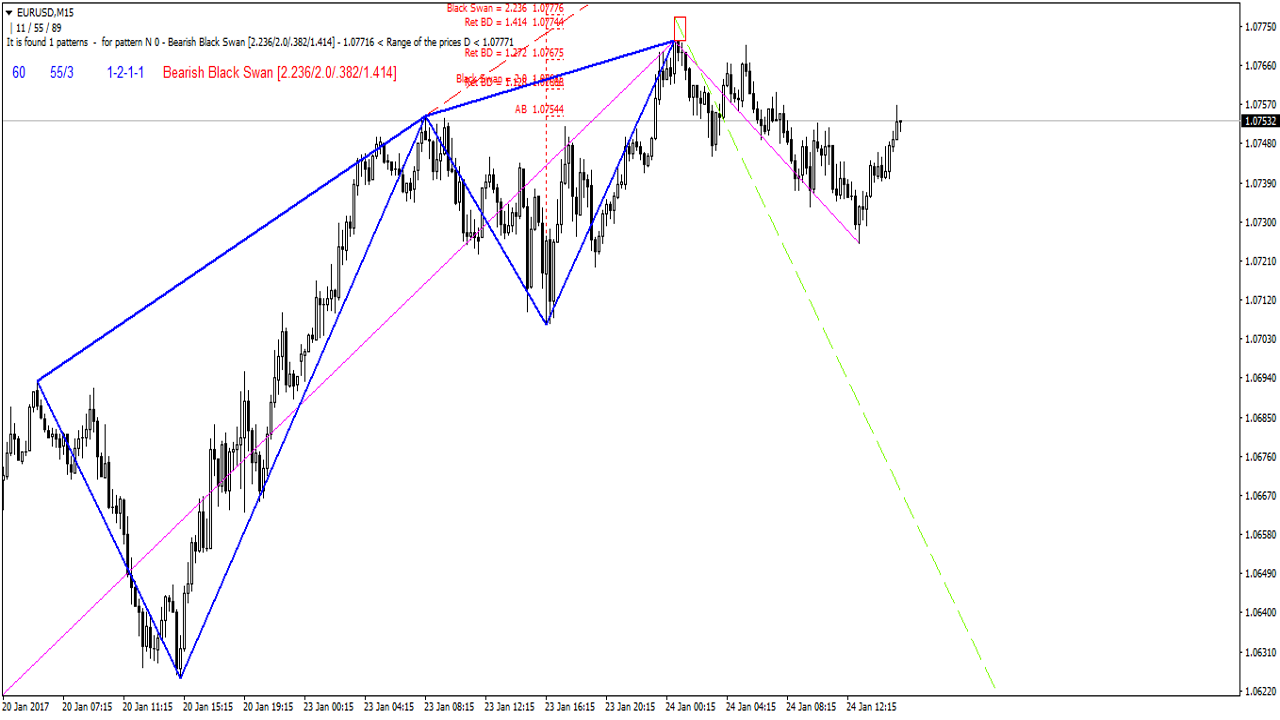 Overall, ZUP is capable of recognizing about 4 dozen patterns, each with its own unique characteristics.
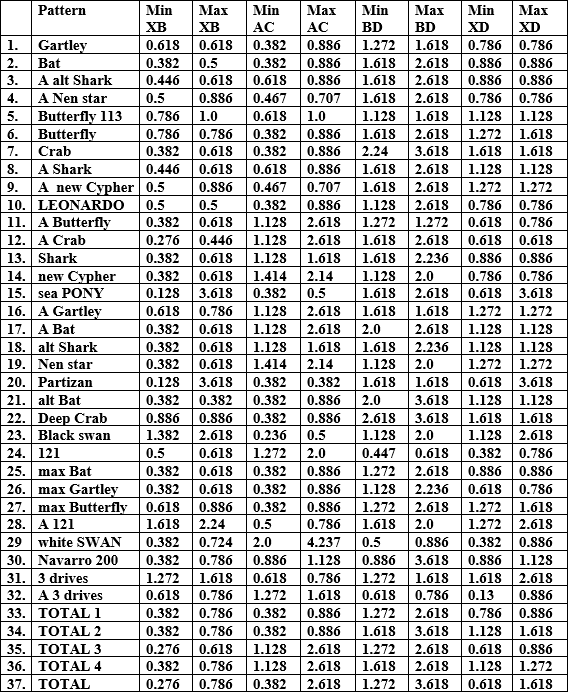 SelectPattern can take 9 sets of figures:
- 0 - search for all patterns;
- 1 - search exclusively for classic figures (Gartley, Butterfly, Bat, Crab);
- 2 - classic and anti-classic patterns;
- 3 - search for exotic patterns;
- 4 - exclusively anti-patterns;
- 5 - all patterns except the "Total" set;
- 6 - exclusively "Total";
- 7 - any five-point patterns selected through the visiblePattern bit parameter (0 do not show, 1 show);
- 8 - without five-point patterns.
Using separate parameters, you can enable or disable the display of ABCD patterns, 3 Drives, and the 4-point pattern:
- ABCD - can take 3 values, from 0 to 2. 0 - do not display the pattern at all, 1 - display any formations, and 2 - display only harmonically correct ABCD formations;
- Ext_3Drives - display of the "3 Drives" pattern;
- Dragon - display of the Dragon pattern;
- Ext_4PointPattern - display of the 4-point pattern.
In addition, you can define your own patterns through the corresponding parameters:
- CustomPattern - the way custom figures are displayed. 0 - do not display on the chart, 1 - display together with the other figures, 2 - display only custom figures;
- NameCustomPattern - the name of the custom figure;
- ...the following parameters define the shape of the pattern, namely the XB, AC, BD, and XD corrections.
Use in Trading
The indicator is not tailored for use on a specific timeframe or symbol, so you can freely apply it to any trading instruments. At the same time, some of the built-in ZigZags may need to be reconfigured, or you may need to use the time-tested ZigZag from MT4.
A pattern is marked on the chart when all setup points have been formed, including point D. That is, for this the ZigZag must have time to redraw to the current peak. At the same time, if the last ZigZag leg changes, the figure will be redrawn according to the current peaks, or it will disappear if the point leaves the correction zone. In other words, only valid patterns corresponding to harmonic proportions are displayed on the chart.
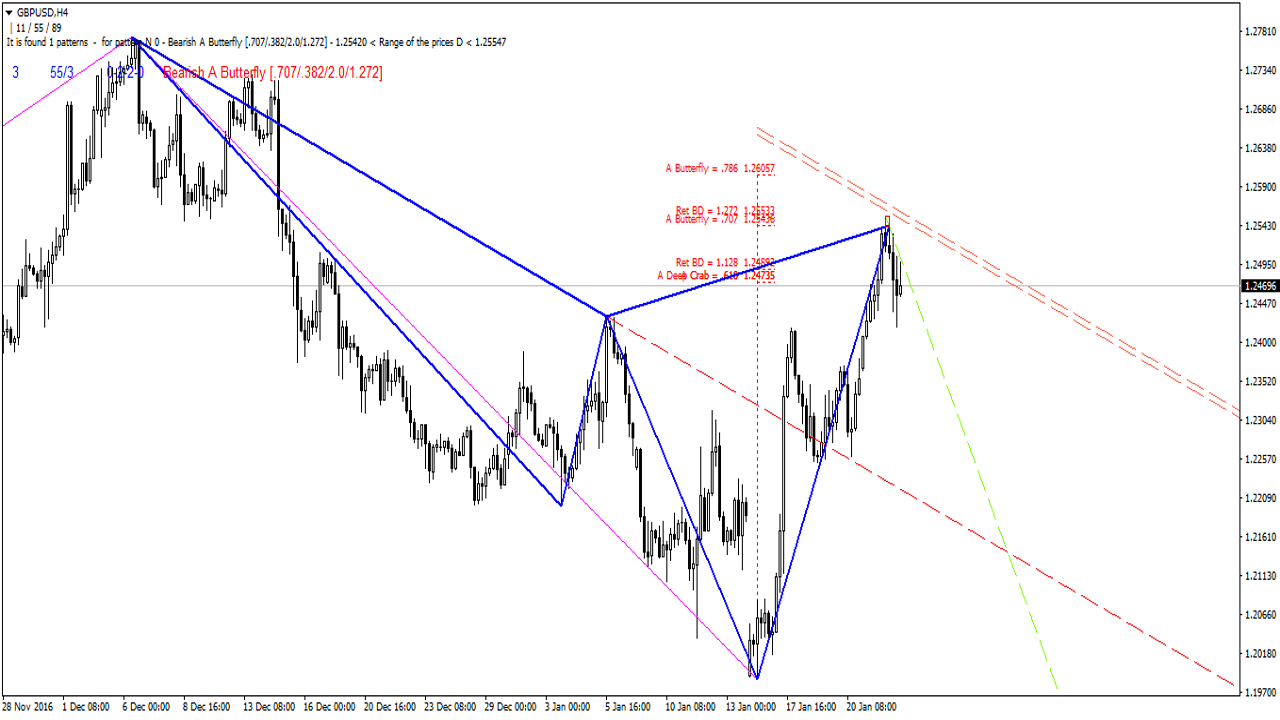 Therefore, you should enter the market immediately after the pattern appears or a little later. For example, after the breakout of the three-bar high/low. Our website already has a detailed article on which targets to use for different harmonic patterns. The indicator itself draws trend lines corresponding to the XB and CD legs. You can also use them as a guide when setting trading targets.
Conclusion

It is worth understanding that ZUP is a professional tool that performs several functions at once. And, like any tool of this kind, ZUP is heavily overloaded with settings, which at first may cause rejection and a desire to return to simpler programs. But once you understand the parameters, you will definitely appreciate the functionality of the indicator. It can become a source of inspiration or simply a working tool - the choice is yours. In any case, the presence of this indicator in the arsenal of any trader engaged in chart analysis is essential!
Download the ZUP Indicator Files
 Sincerely, Alexey Vergunov
TradeLikeaPro.ru
Sincerely, Alexey Vergunov
TradeLikeaPro.ru