
The Wyckoff Method and Its Implementation on TradingView
Explore current ranges across 19 instruments in the Wyckoff accumulation screener.

Richard D. Wyckoff's method (1873-1934) is a time-tested approach to technical analysis that every beginner trader should become familiar with. The Wyckoff Method is based on the idea that big capital, or "smart money," leaves traces in price and volume.
We found the best Wyckoff Method indicator on TradingView. It is Wyckoff Schematic, which visualizes all Wyckoff Method schematics: phases A-E, key events (SC, AR, Spring, SOS, LPS), and distribution signals (BC, UTAD, LPSY).
The Wyckoff Schematic indicator became the platform editorial team's choice, which means it is worth taking a closer look at.
A Few Words About the Wyckoff Method and Schematics
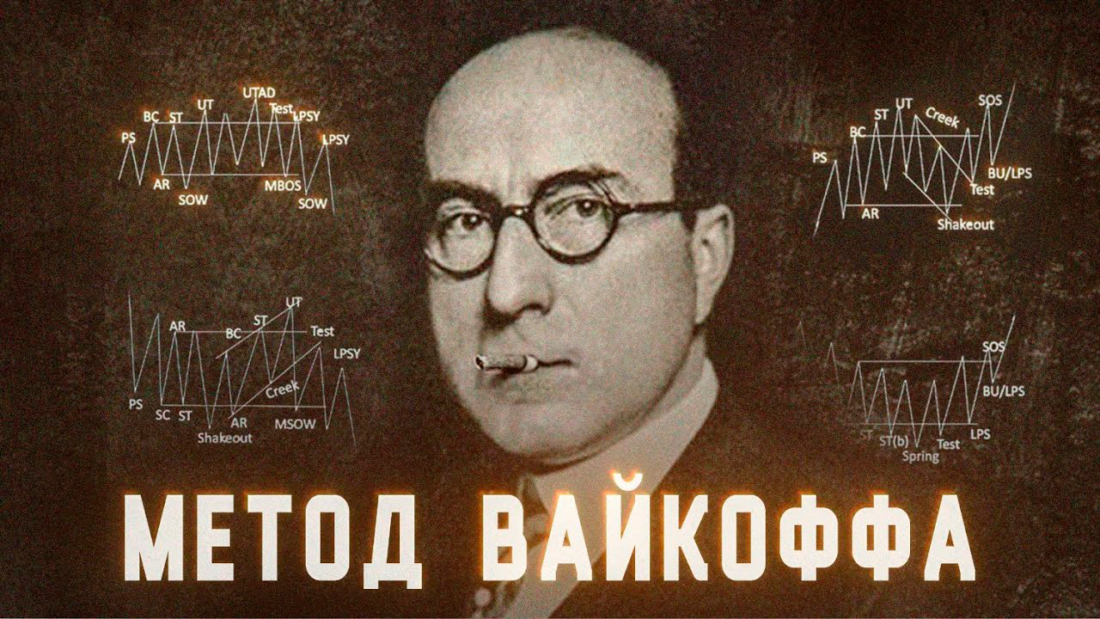
In his method, Wyckoff identified three laws:
- The Law of Cause and Effect (Cause & Effect) - accumulated volume (the cause) leads to subsequent price movement (the effect).
- The Law of Effort versus Result (Effort vs Result) - a mismatch between volume and price movement signals a reversal.
- The Law of Supply and Demand (Supply & Demand).
In addition, Wyckoff was one of the first to start talking about the concept of "smart money," which he called the "composite operator." Wyckoff suggested that traders think of the market as a single intelligent player that manipulates price in order to buy cheaper from the crowd and sell more expensively to the crowd. Sounds familiar, doesn't it?
After developing the theoretical foundation of his method, Wyckoff moved on to practical implementation and developed his own schematics.
The main idea of the Wyckoff Method is that the market moves cyclically, going through four phases: Accumulation - Mark Up - Distribution - Mark Down. Wyckoff schematics describe in detail what the first and last phases of this cycle look like on a price and volume chart.
This schematic shows the process of preparing for a major price rise (a bullish scenario). A large player accumulates the asset while the crowd sells in panic.
Accumulation Schematic
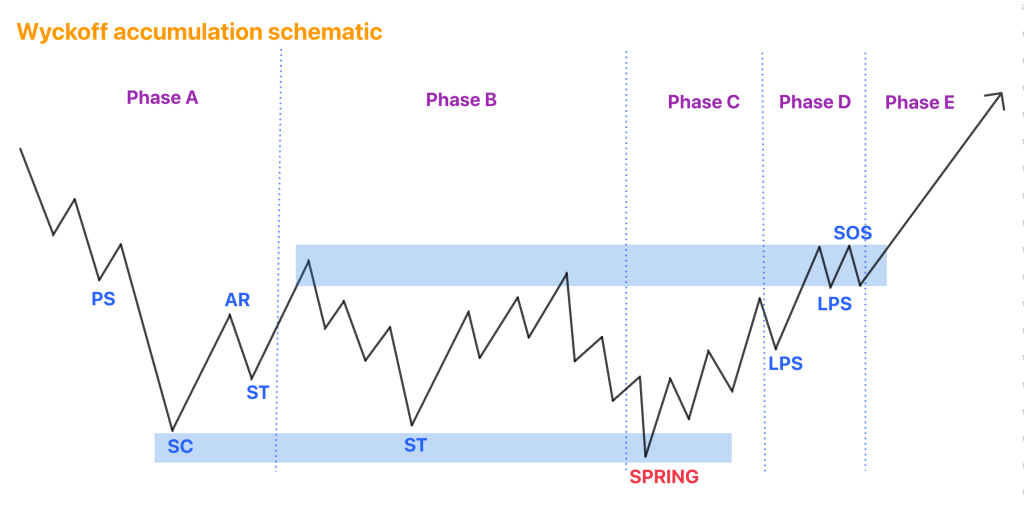
Phase A: Stopping the Downtrend
- PS (Preliminary Support): the first signs of major demand appear after a prolonged decline. Volume is high.
- SC (Selling Climax): the climax of selling. Price drops sharply on enormous volume, which indicates a panic sell-off by small players that is being absorbed by the "Operator."
- AR (Automatic Rally): an automatic rebound. After the panic, price quickly moves upward because selling pressure disappears, while the large buyer continues to hold orders.
- ST (Secondary Test): a secondary test. Price tries again to approach the lows (the SC level), but on significantly lower volume. This confirms that selling has dried up.
Phase B: Building the "Cause" (Trading Range)
Price forms a clear corridor (an accumulation zone). The "Operator's" task is to continue absorbing the asset by using price fluctuations.
- The upper boundary of the range is tested, but for now it is not allowed to break through.
- The lower boundary is also tested. Sometimes false breaks downward occur ("bear traps") in order to shake the remaining "bulls" out of their positions and provoke new sellers to open short positions.
Phase C: The Strength Test (Spring)
The key moment. The "Operator" checks whether any selling liquidity remains.
- A sharp false break of the lower boundary of the range often occurs. This is called a Spring. Price quickly moves down, triggering stop orders and fresh selling, and then instantly returns back. This is the final "trap" before the rise begins.
- Sometimes, instead of a spring, a higher low forms - LPS (Last Point of Support).
Phase D: A Clear Sign of Strength (SOS)
Price begins to move confidently upward within the range on rising volume.
- SOS (Sign of Strength) - a strong upward movement, often breaking through local levels.
- LPS (Last Point of Support) - after the upward surge, price pulls back on lower volume. This is the last chance to buy before the range breakout. At this moment, the "bulls" become convinced that there are no sellers left.
Phase E: The Upward Exit (Mark Up)
Price breaks through the upper boundary of the range. The markup phase (trend) begins. Volume on the breakout is high, which confirms the validity of the move.
Distribution Schematic
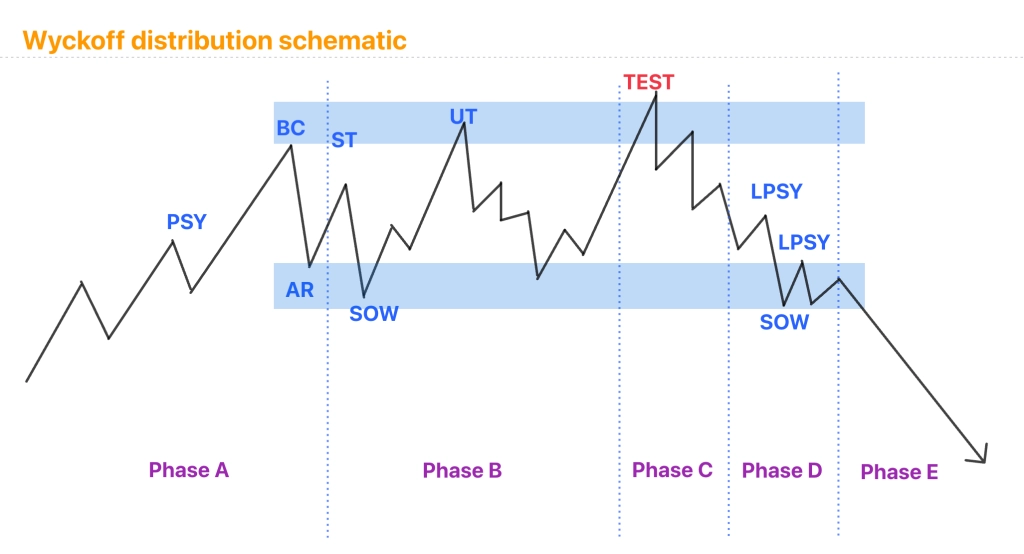
This is a mirror reflection of accumulation, occurring at the top of the trend. A large player sells the asset to a crowd that is in euphoria.
Phase A: Stopping the uptrend
- PSY (Preliminary Supply) — preliminary supply. A large player begins putting shares up for sale, the rise slows down.
- BC (Buying Climax) — buying climax. A powerful upward price surge on huge volumes. The crowd buys up the asset, believing in endless growth, while the “Operator” satisfies this demand.
- AR (Automatic Reaction) — automatic reaction. After the large buyer leaves, the price falls.
- ST (Secondary Test) — a secondary test of the top. The price tries to rise again, but volumes are already low. It becomes clear that demand is drying up.
Phase B: Building the "cause" for the decline
The price forms a trading range. Inside it, the “Operator” continues selling. Buyers try to push the price up, but each subsequent rise is less confident. Signs of weakness begin to appear.
Phase C: A trap for bulls
- UTAD (Upthrust After Distribution) or simply UT (Upthrust) — a false breakout upward. The price briefly breaks above the upper boundary of the range, creating the illusion of a continuation of the trend and luring in new buyers, after which it falls back. This is the last opportunity for the “Operator” to unload the asset at a good price.
Phase D: A clear sign of weakness (SOW)
The price increasingly tests the lower boundary of the range, sometimes breaking through it.
- LPSY (Last Point of Supply) — the last point of supply. After a small bounce upward, the price runs into selling and cannot rise. This is the moment when short positions can be opened.
Phase E: The move downward (Mark Down)
The price confidently breaks below the lower boundary of the range. The decline phase begins. Volumes on the breakout are high, confirming the dominance of supply.
How to use the Wyckoff method in trading
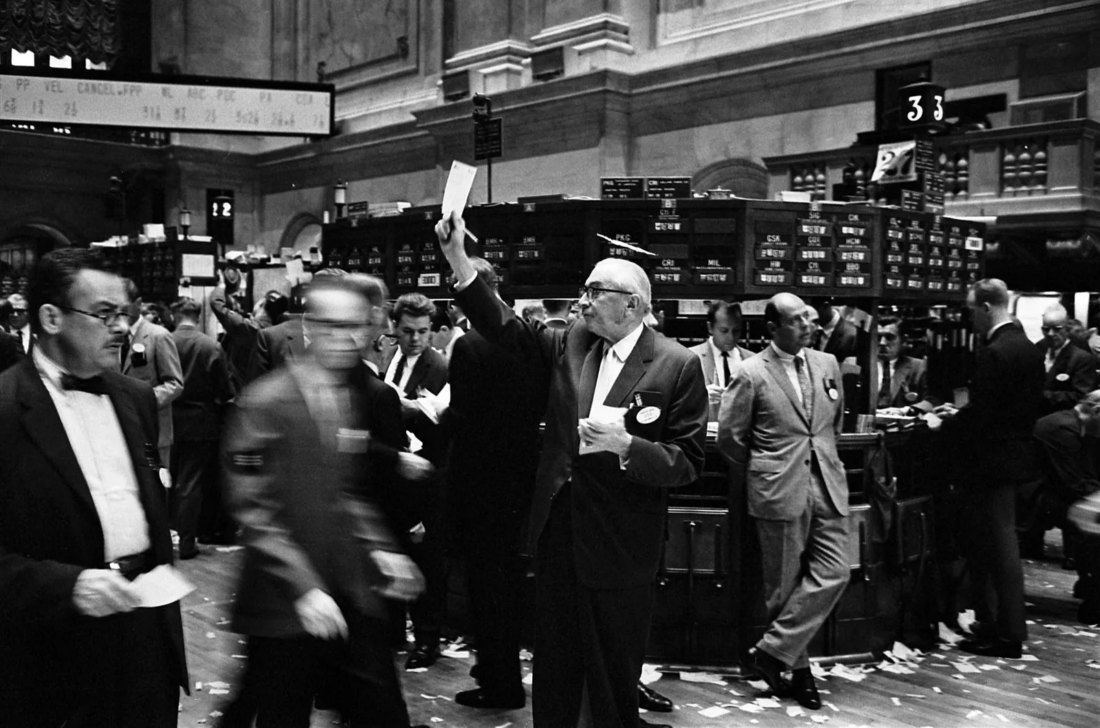
- Determining the phase: market analysis and waiting for a suitable schematic.
- Entry points: In accumulation: ideal entry points are after the “Spring” or at the last point of support, LPS, in Phase D. In distribution: entering a short is possible after the false breakout upward, UTAD, or at the last point of supply, LPSY.
- Volume analysis: Volume is the key confirming factor. Growth on increasing volume indicates the strength of the move, a decline on decreasing volume indicates a healthy correction. A divergence between volume and price is a danger signal.
The Wyckoff Schematic by Kingshuk Ghosh indicator on TradingView
The Wyckoff Schematic indicator was developed by the author Kingshuk Ghosh. The code is open (Pine Script 6) and fully customizable.
The author has fewer than 600 followers, but he has several very popular indicators, among them Wyckoff Schematic.
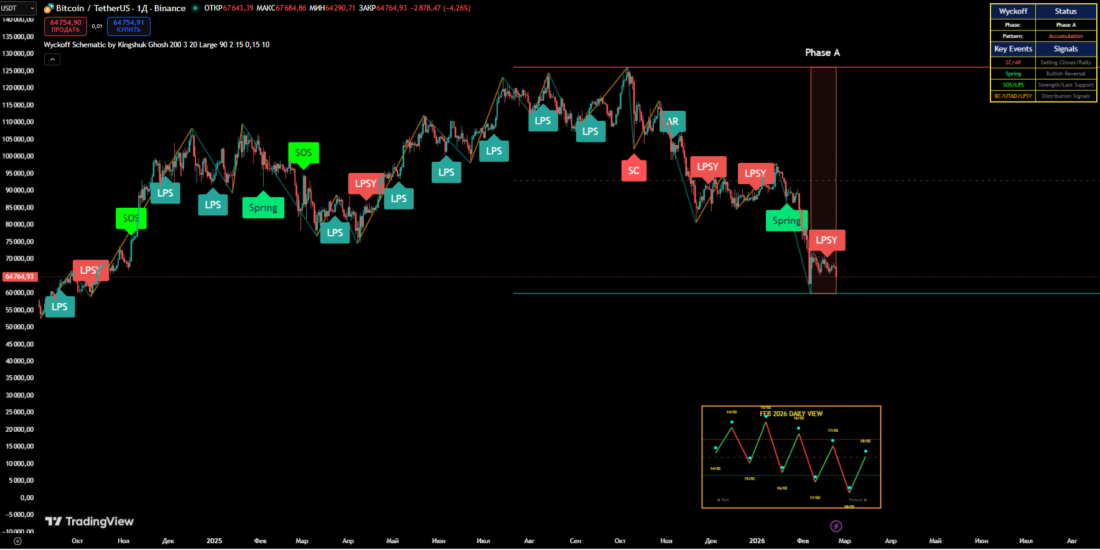
The Wyckoff Schematic indicator was published in January 2026 and immediately became a TradingView Editor’s Pick. At the time of writing the article (late February 2026), the indicator had received more than 1000 likes with 20000 views. Reviews are generally very positive.
The Wyckoff Schematic indicator automatically identifies and visualizes the phases of the Wyckoff schematic (A-E), key events for accumulation (SC, AR, Spring, SOS, LPS) and distribution — (BC, UTAD, LPSY), draws phase blocks, dynamic horizontal support/resistance levels, zigzags, and a phase table. It helps recognize smart money movements and phase changes according to the Wyckoff method.
The indicator draws colored semi-transparent phase boxes (A — red, B — turquoise, C — blue, D — green, E — yellow) and generates alerts for all critical events and phase transitions.
The indicator works well on timeframes from H4 and above (best on Daily/Weekly).
Settings (Inputs)
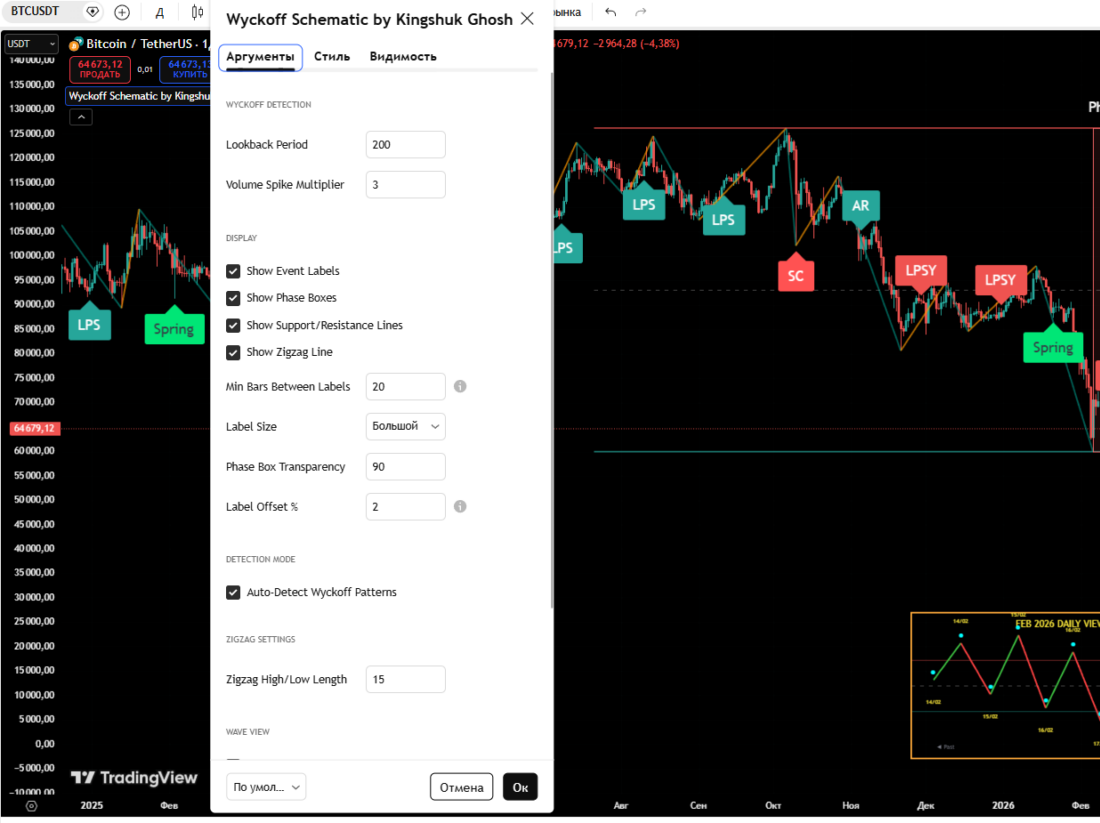
- Lookback period — 20–300 bars (the main period for searching for the schematic).
- Volume spike multiplier — sensitivity to volume spikes.
- Zigzag sensitivity / High-Low length — sensitivity of swing detection.
- Display Settings: Show Event Labels, Show Phase Boxes, Show S/R Lines.
- Visual Settings: Label Size, Transparency, Offset %.
- Wave View Settings: Enable Wave View, Height %, Swing Legs.
- Alerts — separate alerts for each event (SC, Spring, SOS, etc.).
Recommendations for use
- Trading by phases: In Accumulation, they look for buys — key points: Spring → SOS → LPS (buying at LPS after confirmation). In Distribution, they take profits or look for shorts at BC / UTAD / LPSY.
- Multi-timeframe and Wave View: the indicator has a built-in Wave/Monthly view; it is recommended to use 4H / Daily / Weekly to filter noise and confirm structures (the author explicitly notes that the indicator works better on 4H and higher).
- Entry algorithm: wait for critical events (alerts: SC, AR, Spring, SOS, LPS, etc.), confirmation from volume, and the price reaction at phase boundaries. Trades can be entered on retests of key lines/levels after phase confirmation.
- Risk management: stop losses are placed beyond structural extremes (SC/BC/UTAD), the position size depends on the width of the phase and the risk per trade; take profits are phase markup levels / the next S/R zones.
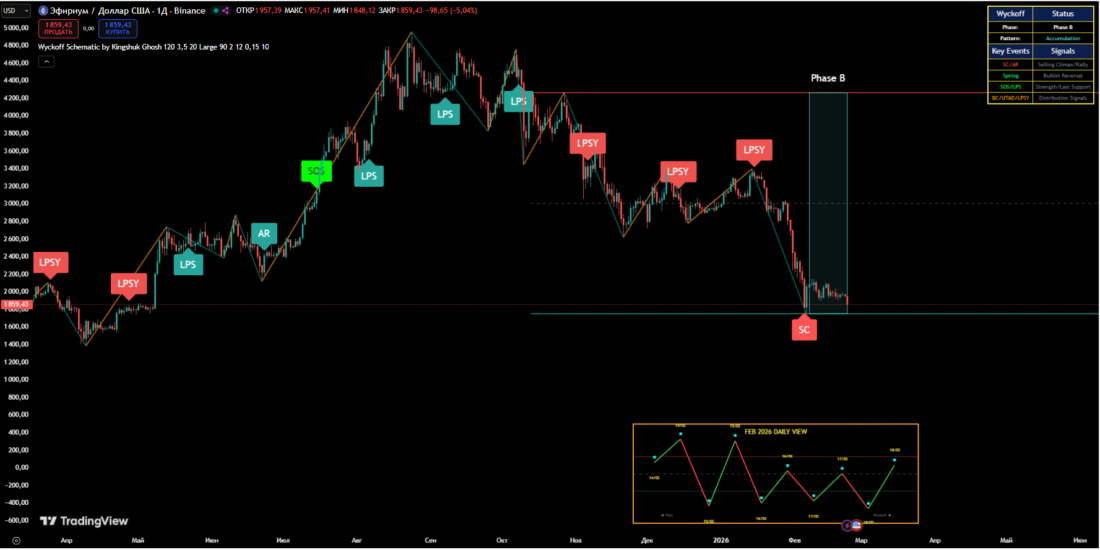
For example, when trading Last Point of Support (LPS), you need to pay attention to the following points:
After the Spring and SOS, the price makes a pullback within phase D. The search for an entry point is possible provided there is a pullback inside the range after SOS/Rally, and the indicator shows an LPS signal, a weak negative pullback on low volume. The entry point itself is formed on the confirming bounce from LPS, and the stop is placed below the local low. The targets are floating and depend on the strength of the growth in phases D/E.
Analysis of Indicator Signals
What immediately stands out is that the indicator correctly marks important points. On the one hand, other indicators do this too, and on the other hand, there is a clear methodological justification here.
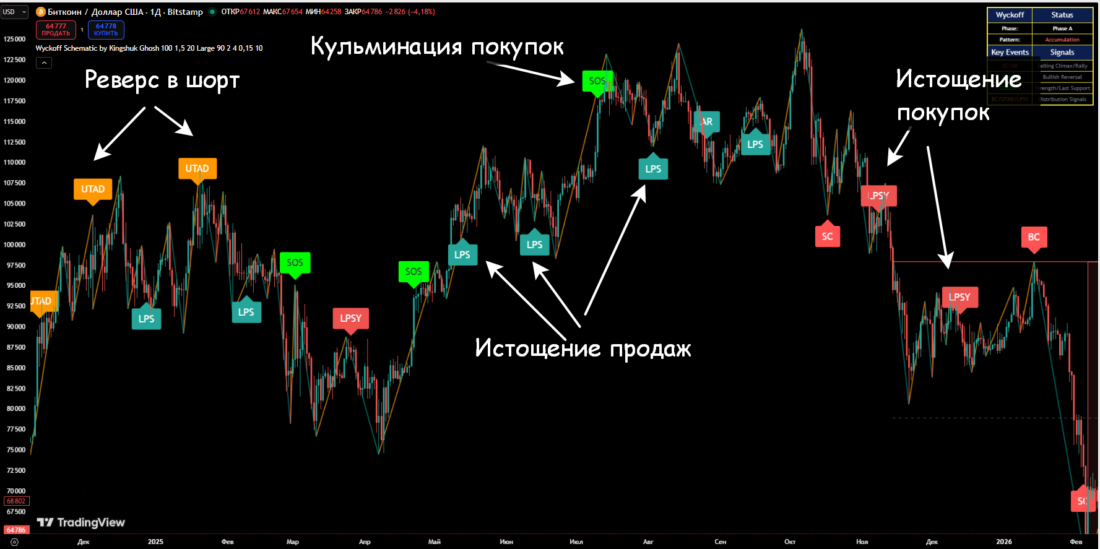
There are also false signals, but what indicator system does not give them? All indicators make mistakes, so it is necessary to have several indicators to confirm the signal.
Conclusion
Schematics based on the Wyckoff method underlie many modern concepts of technical analysis. The Wyckoff method underlies the basic ideas about the phases of the market auction, about the accumulation of volumes in balance, and their distribution in the impulse.
An important point is that the designation of schematic points according to the Wyckoff method forms a trader's thinking based precisely on the indirect analysis of the behavior of large players. At the same time, some traders make the mistake of viewing the Wyckoff method as a complete trading strategy.

Thus, the Wyckoff method is suitable for beginners, although it is difficult for quantitative analysis and for creating algorithmic strategies based on it.
The Wyckoff Schematic indicator is useful in that it visually plots points specifically according to Wyckoff schematics; this helps beginners become familiar with the method.