
WPR - the best oscillator for scalping
 Good afternoon, fellow forex traders!
When you are looking for one of the key indicators for your trading system, you should certainly turn to the experience of several generations of successful traders. The indicators they use really work and really bring profit - this can easily be verified by their growing capital. And if such an indicator is included by default in most trading platforms, that is not without reason either. You have surely encountered the WPR indicator (Williams Percent Range) or at least heard about it. It will be useful to get to know it better; perhaps it can become your reliable assistant in trading.
Today we will talk about such an indicator as Williams Percent Range (WPR, %R or Wm%R), developed by Larry Williams. Williams Percent Range (%R) is a dynamic indicator that determines overbought and oversold conditions. As is known, stochastic lines were introduced by George Lane in the 1950s. All calculations had to be done manually, and a group of traders developed formulas for oscillators, successively giving them names: %A, %B, %C, and so on. Only three proved workable: %K, %D and %R. The first two curves are known as Lane's stochastics, and the last bears the name of Larry Williams. This indicator was introduced in 1973.
Larry Williams, in J. Lane's words, "honed and perfected" the %R indicator invented through joint effort. Williams even published a book with the promising title "How I Made One Million Dollars Trading Commodities Last Year".
Indicator characteristics
Platform: any
Currency pairs: Any
Timeframe: any from H1 and above
Trading time: around the clock
Indicator type: oscillator
Recommended brokers: Alpari, Exness, RoboForex
Description of Larry Williams' %R indicator

Historically, it is the stochastic that has become the most widespread indicator among traders, especially in the forex market. This indicator is very often used to build trading systems and can be combined with moving averages, Bollinger Bands, and many other indicators that determine the direction of the trend. The %R indicator is much less well known, despite the fact that software developers never forget it. The meaning of the indicator's operation is this: it measures the ability of bulls and bears to close prices each day near the edge of the range over the past period. The Williams index confirms trends and warns of their coming changes.
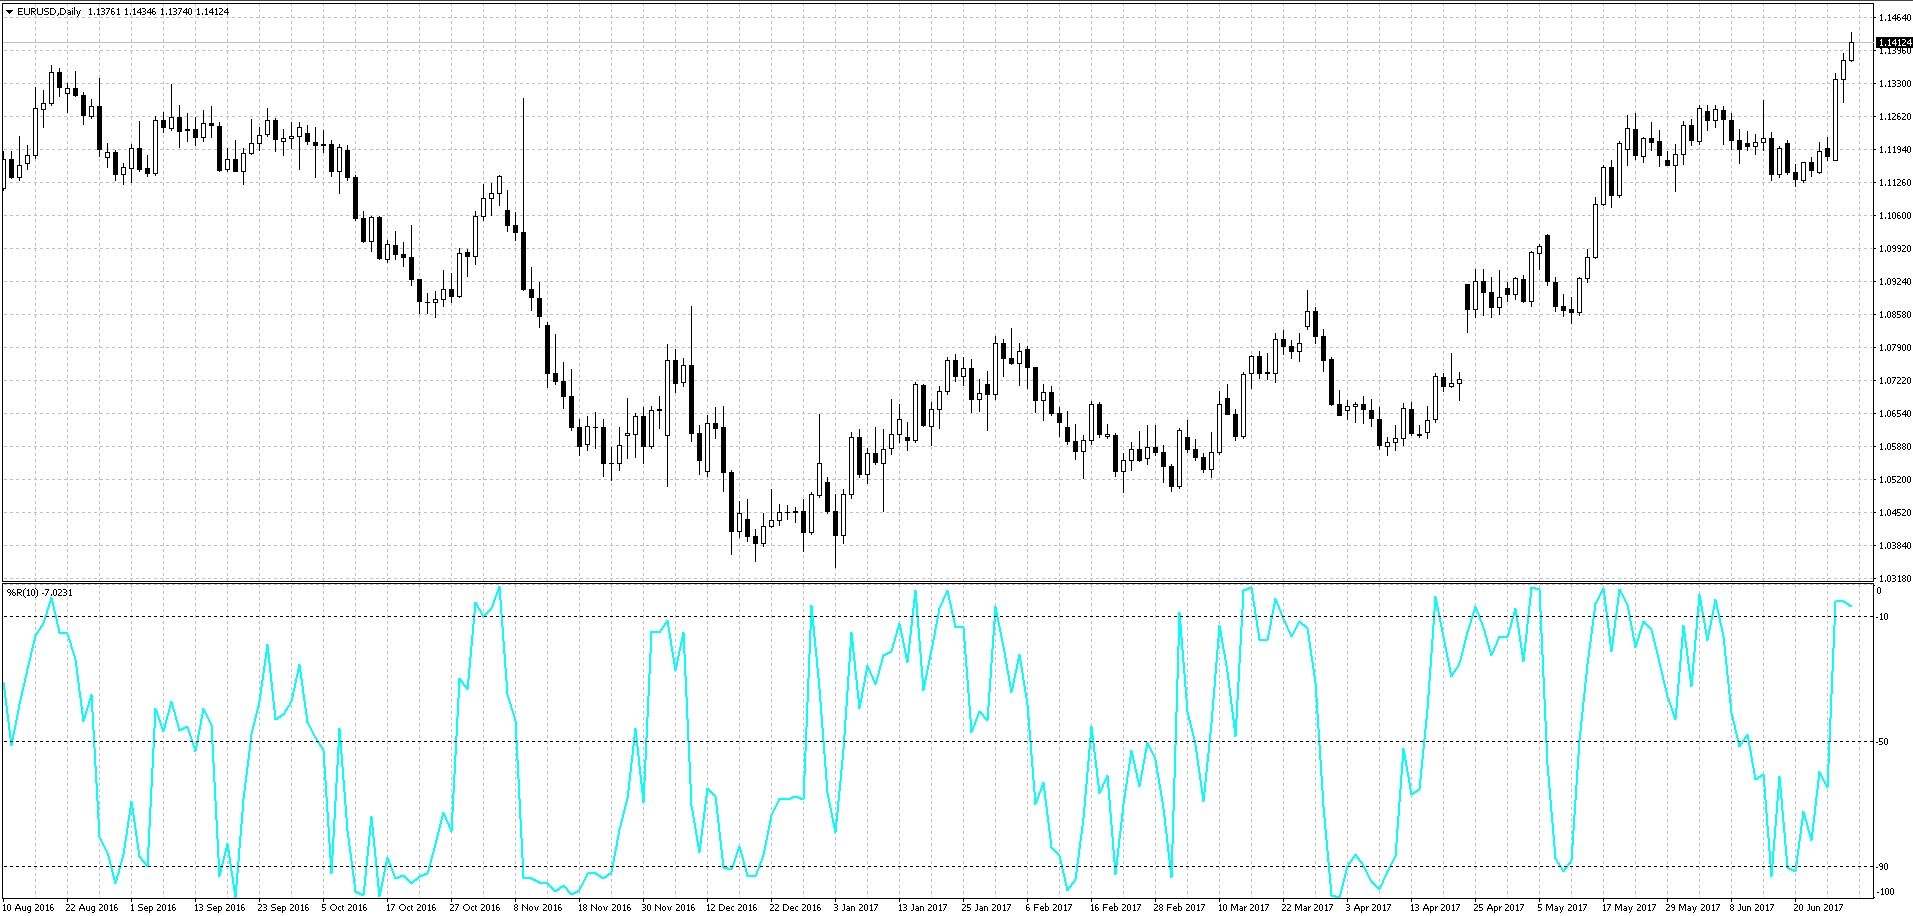 The basic principles of interpreting oscillators discussed in previous articles also apply to the %R oscillator. The main signal factor here is also divergence in overbought and oversold areas, or so-called divergences. To construct the %R indicator on an inverted scale, its values are usually assigned a negative sign, for example -30%. Indicator values in the range from -80% to -100% indicate an oversold condition. Values in the range from -0% to -20% indicate that the market is overbought. The Williams Percent Range indicator has one special feature - it can accurately predict price reversals.
Williams' %R takes into account the position of the latest closing price relative to the range, the highest-to-lowest price over the recent period. It expresses the difference between the closing price that occurred a selected number of days ago and today's closing price as a percentage of the range over the recent period. If the WPR chart rises above the upper line, this indicates the strength of the bulls, but also that the market is overbought. If WPR falls below the lower line, one can conclude that the bears are very strong and that the market is oversold. The indicator reflects the balance of power between bulls and bears at the market close. It shows whether bulls can close the market near the top of the range over the recent period or whether bears are strong enough for closing prices to end up near the bottom of the range.
Settings of Larry Williams' %R indicator

In the MT4 terminal, the indicator is called William`s Percent Range and allows you to set the averaging period, the signal-line levels, which by default are -80 and -20, as well as the display style, color, line thickness, and so on. Larry Williams recommends using a 10-day period for calculations, while MT4 sets 14 by default. He places the boundaries of the overbought and oversold zones at 90% and 10%, respectively, note that these are not 80 and 20 as in the terminal. The indicator can be used for various time intervals: daily, intraday, or weekly. The direction of weekly %R usually changes a week before the weekly MACD histogram does. A bend in %R indicates the need to review targets and stops more strictly, or to close profitable trades. Finally, it should be noted that one cannot constantly rely only on %R line crossings, because in ranging and trending markets the indicator behaves completely differently.
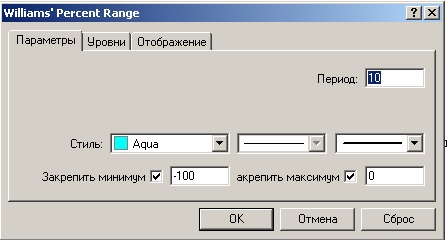 Williams recommends using a 10-day period for calculations. He places the boundaries of the overbought and oversold zones at 90% and 10%, respectively. The rules for using the %R line are practically no different from those already described for stochastic lines.
The importance of market cycles when choosing the calculation period

A special way of using %R is its use in Cycle Theory. It is recommended to take 5-day, 10-day, and 20-day intervals corresponding to calendar periods of 14, 20, and 56. But for a more accurate calculation, a time period equal to 1/2 of the cycle length is used.
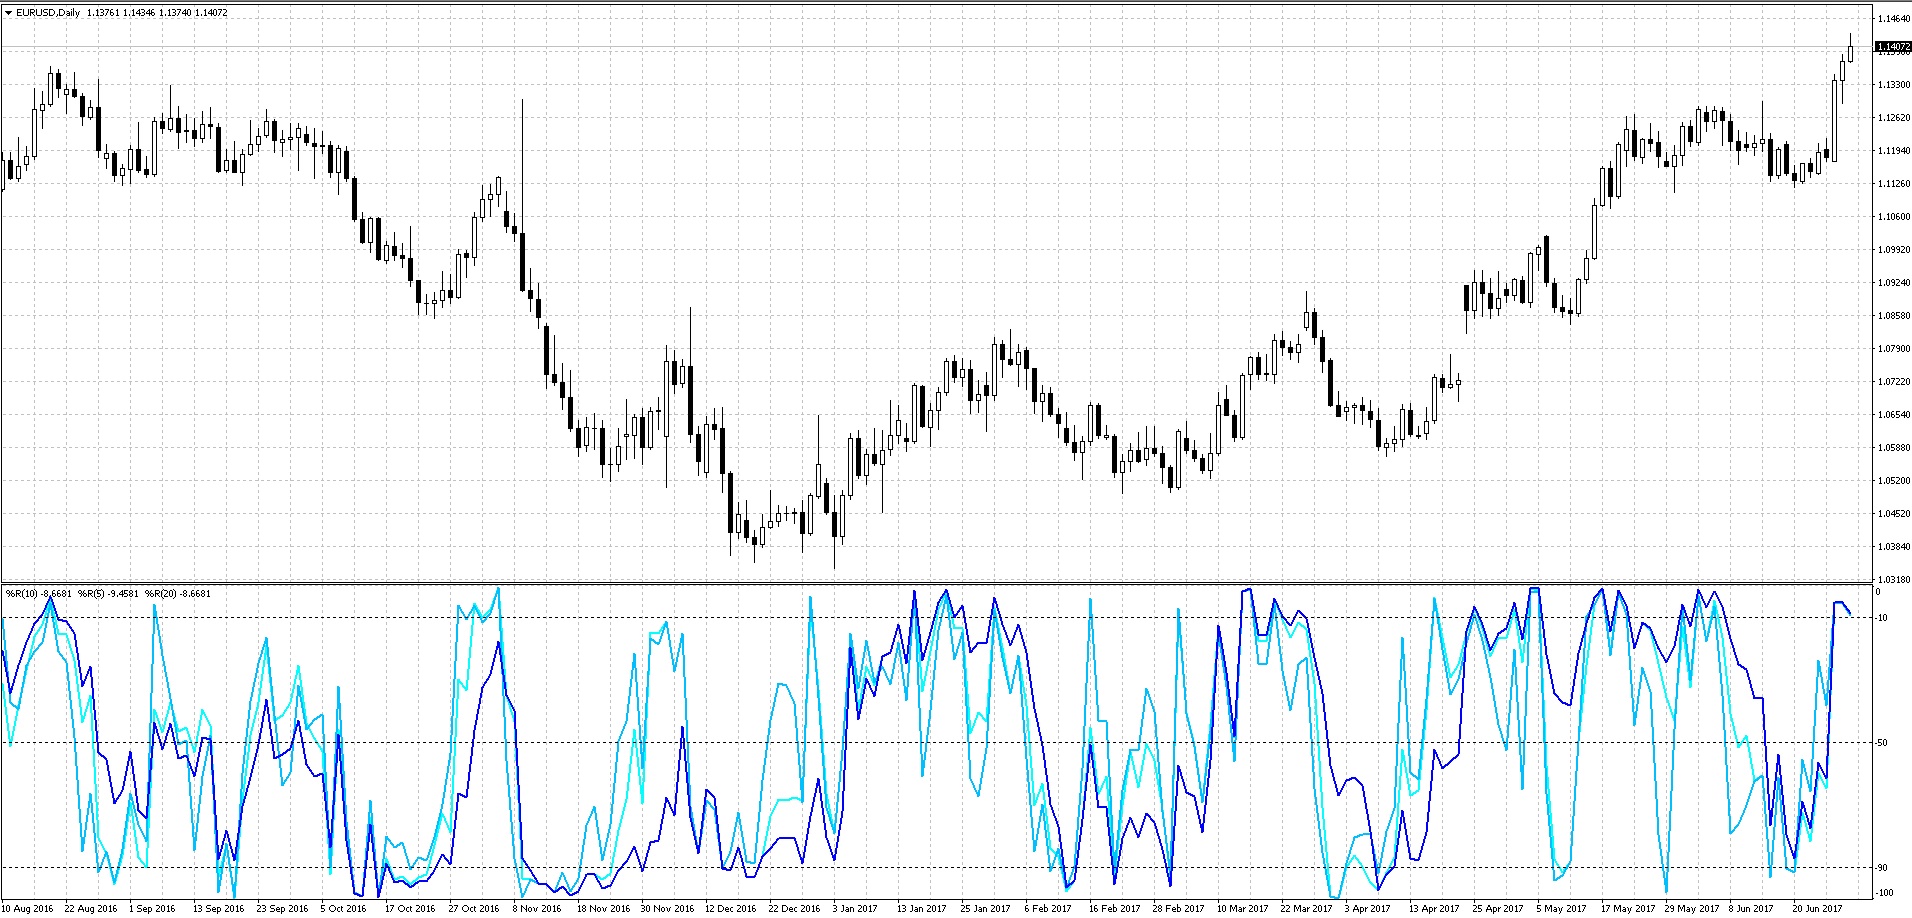 Thus, when calculating Wilder's RSI index, a period of 14 is used, amounting to half of 28. It is enough to mention that twenty-eight calendar days, or twenty exchange working days, represent the dominant monthly trading cycle, to which other time intervals harmoniously submit. It is precisely thanks to the 28-day trading cycle that one can explain the spread of five-day stochastic analysis, the ten-day momentum indicator, and the fourteen-day RSI index, each of which essentially covers a period equal to 1/4 or 1/2 of this cycle.
Calculation

Strictly speaking, its calculation is a modified formula for %K from the Stochastic Oscillator indicator:
The value of the latest closing price is subtracted from the maximum value recorded over a certain number of days. Then the difference is divided by the size of the price range over the same period. The indicator fluctuates from 0 to -100%. It equals 0 when the price closes at the very top of the range.
Advantages and disadvantages

Overbought and oversold indicators often remain in an overbought or oversold condition for a long time while the price continues to rise or fall. Entering short positions only because of apparent overbought conditions can lead you to leave the market mistakenly long before clear signs of weakness appear. This happens especially often during long, established trends, when the indicator can remain within overbought and oversold zones for a very long time. In general, trying to catch a trend reversal has always been considered a very difficult task that is not suitable for a beginner.
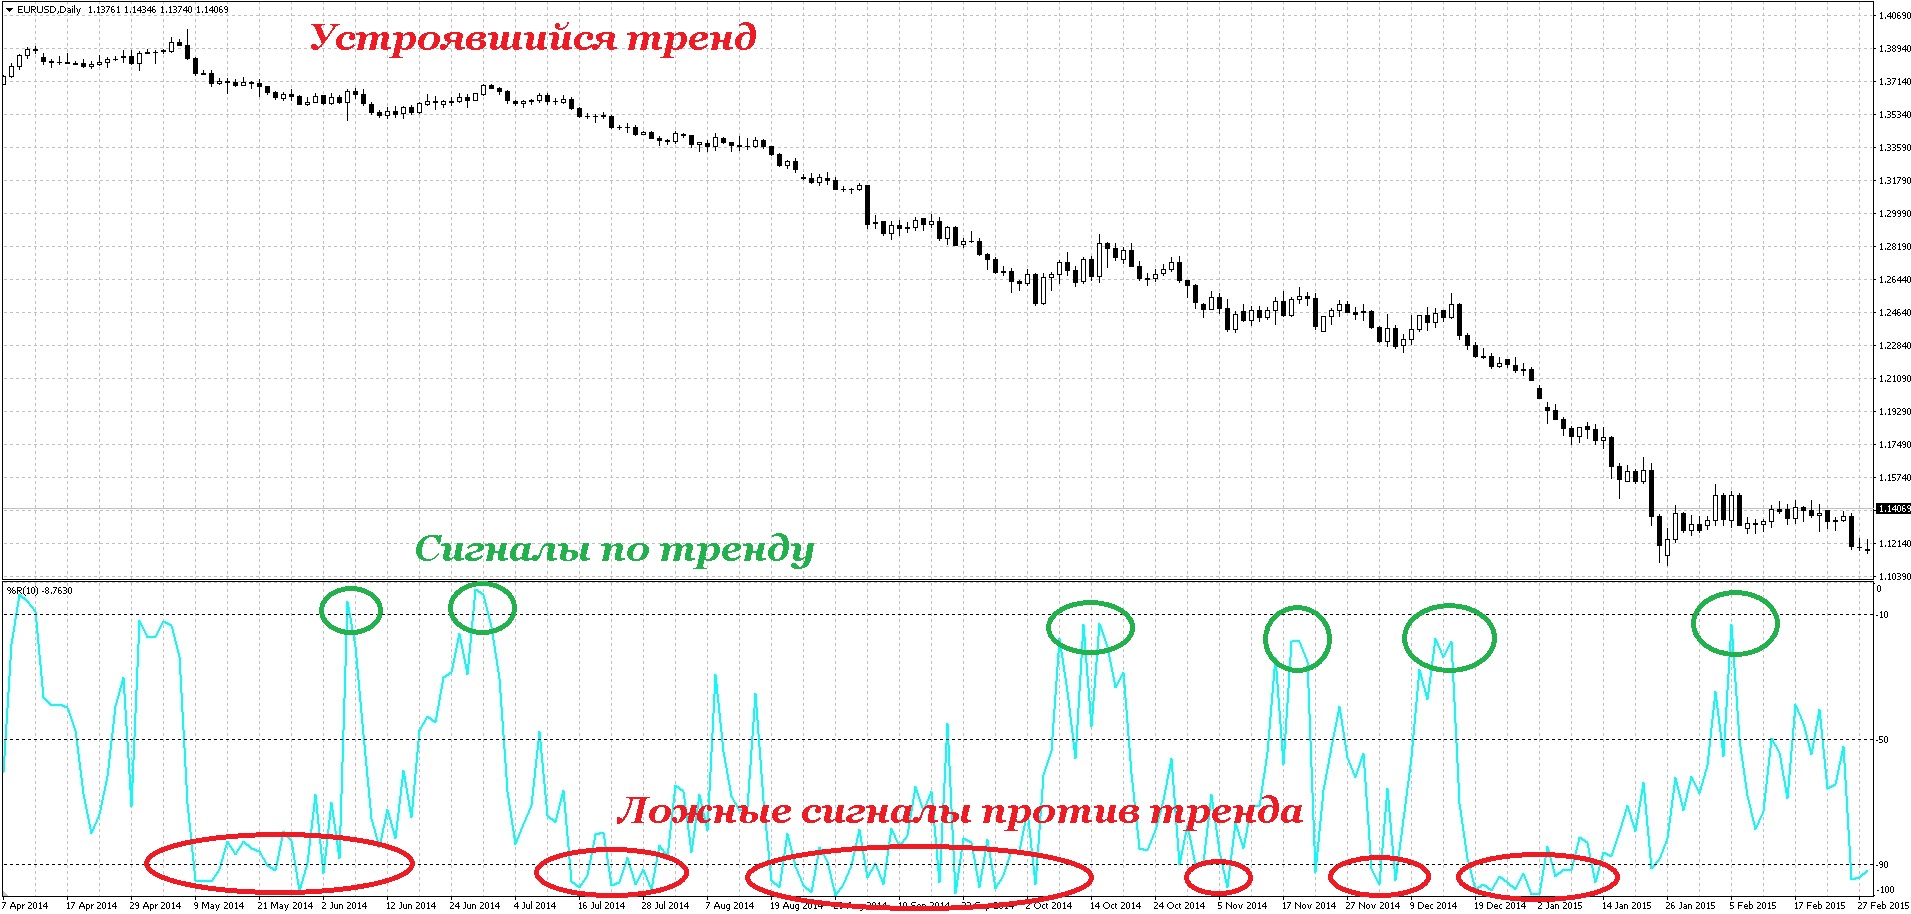 Nevertheless, with competent analysis, for example when trading with the trend on pullbacks, WPR shows reversal points well. The indicator also performs very well in conditions of low volatility and when working in ranging markets.
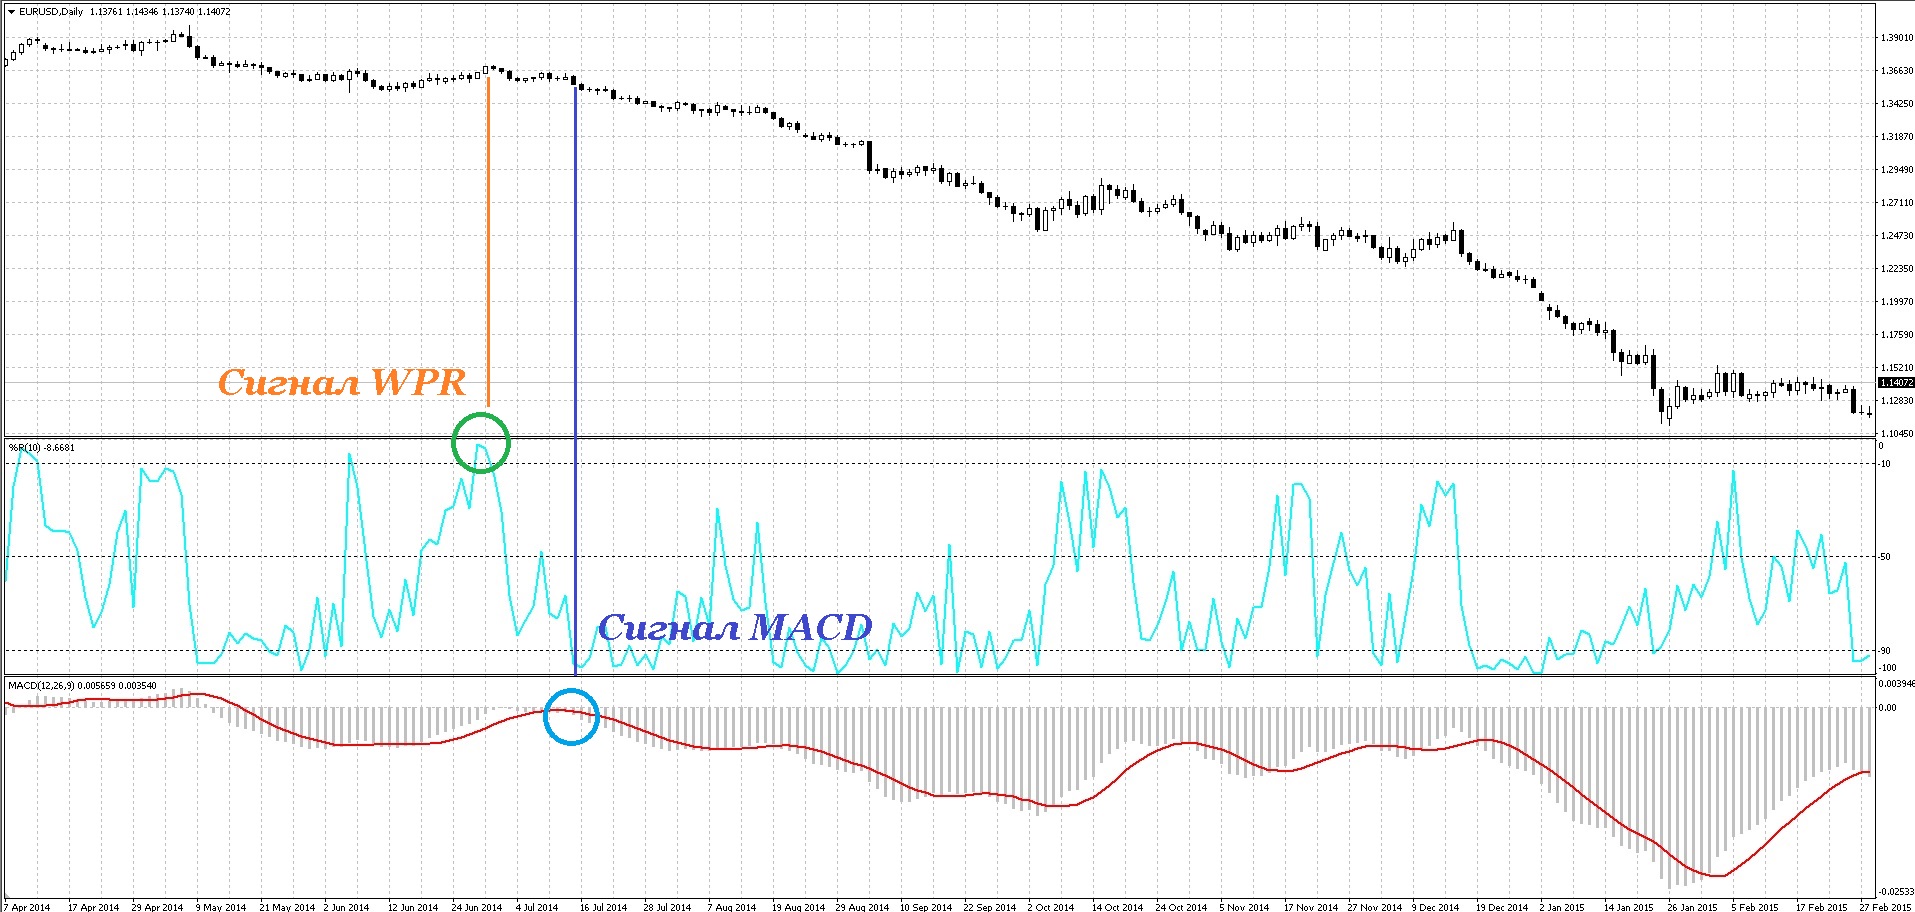 As was already mentioned above, the WPR indicator really does react very quickly to short-term changes in the direction of an instrument's price. For example, WPR indicator signals on daily charts usually lead MACD indicator signals by at least a day.
Signals from Larry Williams' %R Indicator

In general, the analysis of this indicator is exactly the same as for any other oscillators. Therefore, I will not dwell in detail on the ways it is used. I will mention only the main ones.
The %R indicator, being an oscillator, gives signals of market overbought and oversold conditions by crossing its signal lines. It is also often useful to wait for the indicator to leave the zone and only then enter trades. As I said above, in clear trends the indicator gives many false countertrend signals. However, like all oscillators. In general, when trading pullbacks in the direction of the trend together with WPR, the BollingerBands indicator is a perfect fit. Other channel indicators will also work, for example, Envelopes and Keltner Channels.
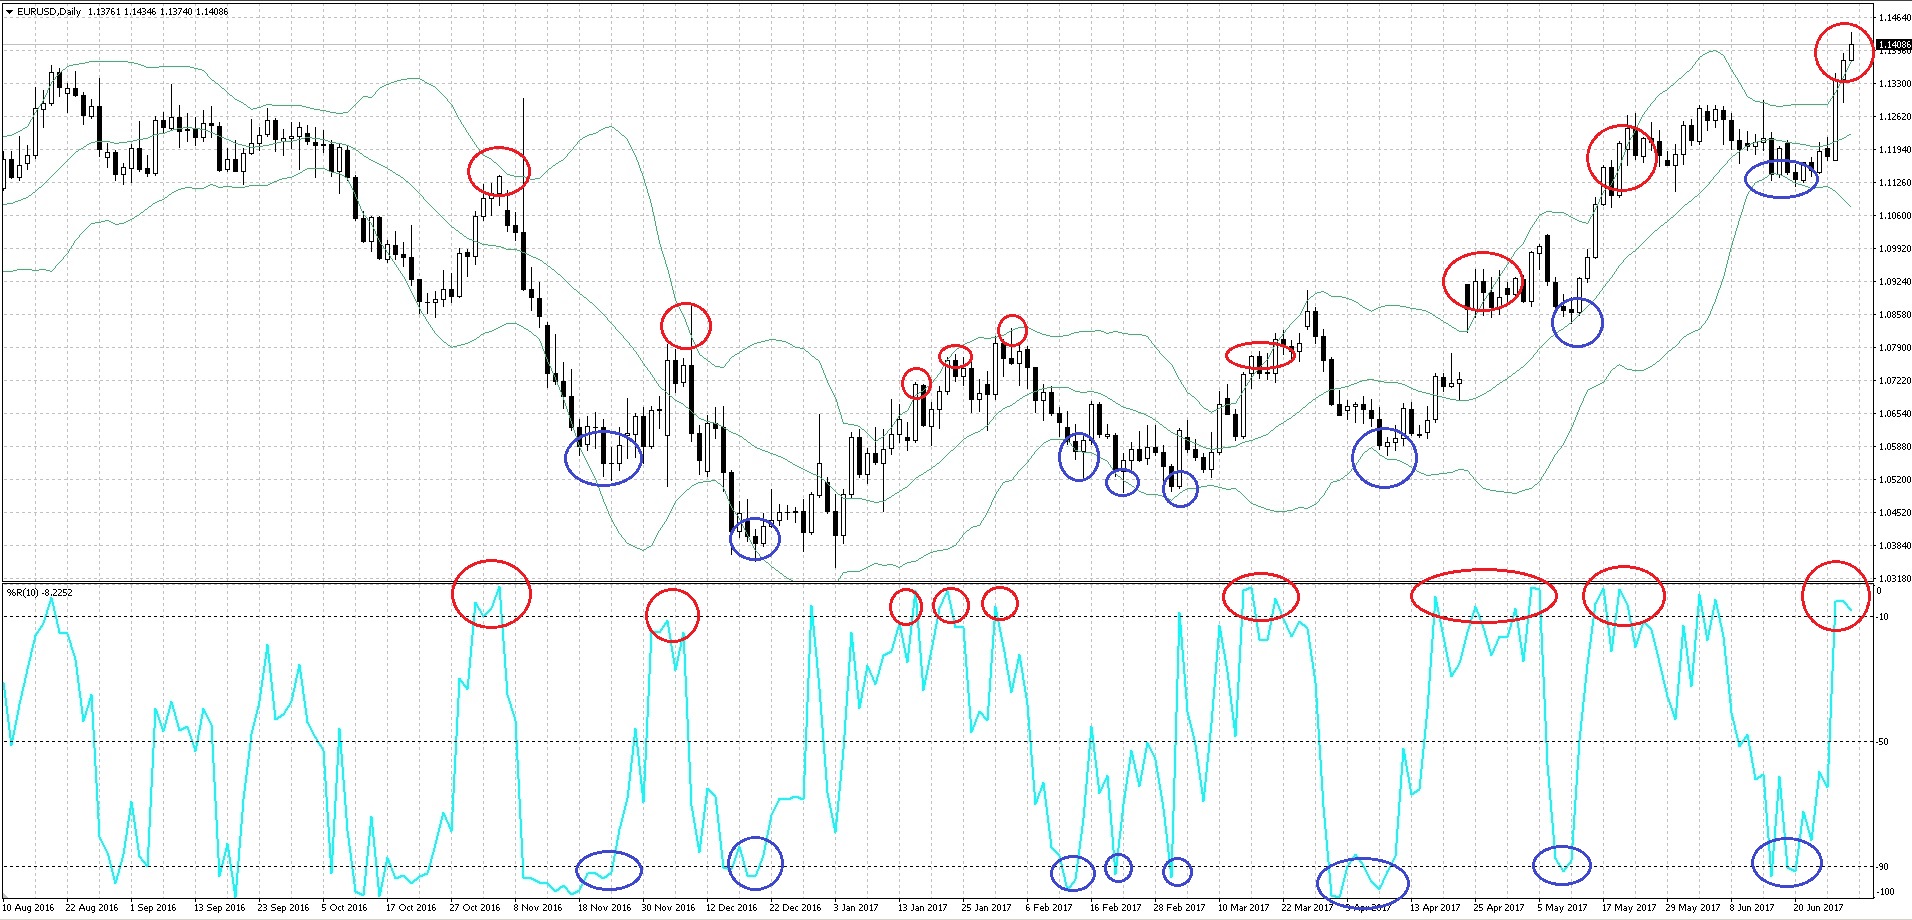 Price Action patterns work well with the WPR indicator, such as doji, rails, the engulfing pattern, the inside bar, the pin bar, and others.
As for choosing the timeframe, when working with PA, the D1 and H1 periods are best suited. In addition, the WPR indicator performs very well in scalping and pipsing.
Conclusion

Today we became familiar with another wonderful classic indicator. Of course, it is not without the drawbacks inherent in all oscillators. Nevertheless, WPR is very fast and sensitive, thanks to which it is the most popular oscillator in scalping, along with the CCI indicator, and perhaps even more popular. But never forget that no matter how perfect the indicator you use may be, it is important to combine its readings with other signals and always under any circumstances stick to your trading plan, and then success will invariably accompany you.
Respectfully, Dmitry aka Silentspec TradeLikeaPro.ru
