
Why Does a Forex Trader Need Lagging Indicators?

"All indicators lag!" How many times have you heard such cries across the internet?
Perhaps the dream of all traders in the world is to create an indicator that will describe and forecast the market situation as accurately and effectively as possible. However, no matter how many attempts are made to create such a grail, the problem of signal lag always remains. Only afterward does the trader realize: if only I had entered the market a little earlier, at a better price, but, as they say, the train has already left.
Of course, there are effective and strong signals, for example, divergences, but they occur rarely. Therefore, currency speculators have to fit, tune, and test indicators in their trading systems. So, what should be done about indicator lag, are there any effective methods for eliminating such a phenomenon - you will learn from today's material.

Most of us drew and expanded our knowledge of currency trading from the Internet or specialized forums, obtaining information, including from our website. Browser search engines return information for a specific query. On any topic about Forex, a trader can independently broaden or narrow the search.
A frequent query topic is indicators. Market professionals track new trends this way, while beginner traders are searching for the grail. When starting to create a trading system or modernizing an existing strategy, traders type more than a hundred possible combinations with the word "indicators" into search engines. Statistics from query analysis show that there is not a single question among them with the word "lagging."
Perhaps it is a matter of psychological associative perception: who might need a lagging signal? But in real trading, it is precisely a delayed definition of a trend that guarantees the development of a medium-term or long-term tendency.
Leading or coincident indicators, which can also include Price Action, give far more false signals and far fewer opportunities for holding a position for a long time. But how can you understand which type the chosen indicator belongs to?
Lagging, leading, and trading Forex without time lags

Leading indicators are a price analysis tool with a high degree of forecasting, unlike lagging indicators, which determine the current tendency on the basis of actual data or rules (for example, a series of highs or lows).
Trading without lag is possible only on the basis of Price Action or candlestick analysis. According to the theory of Charles Dow, price reflects all events and fundamental news. Thus, those who trade by price signals and volume gain an advantage in trades without spending time studying economic statistics and with the ability to participate in insider trading.
Leading fundamental analysis indicators are indirect measures of falling consumer demand, inflation, and economic activity. By analyzing the values of building permits, retail sales, and changes in employment, investors can forecast in advance a drop in GDP, the size of the Central Bank rate, etc.
More complex constructions, for example the leading LEI indicators of The Conference Board, make it possible to predict an economic crisis reliably; proof of this is the not-so-distant market decline in 2020.
An example of leading indicators of technical analysis on Forex and other markets is various oscillators, especially divergences between their readings and price. Overbought or oversold conditions can cause a reversal and the emergence of a new trend, an ideal entry point at the very start of the move at the bottom or at the top.
The unemployment rate, the Central Bank discount rate, GDP, and even inflation are lagging fundamental indicators. This classification can explain why the market sometimes reacts in the opposite way to the release of the listed data. Analysts explain such an anomaly by saying that the statistical figures have already been priced in by speculators.
The "wrong reaction" is a correction lasting one or several days; changes in fundamental indicators cause long-term trends on the market lasting up to several months due to cyclicality in the economy. It is rare for the Central Bank rate to be lowered for such a short period that the crisis would be overcome - economic recessions and upswings last for years.
Lagging indicators in technical analysis, like fundamental indicators of the same kind, determine the trend based on analysis of past price values. These are moving averages - indicators that build a curve of average values over the period specified by the trader.
The simple principle of trend analysis by averaging prices formed the basis of many indicators, the most famous being MACD, Bollinger Bands, and Ichimoku. The creators of these oscillators - leading indicators - also could not do without moving averages; such signals can be classified as lagging analysis tools.
Why don't traders trade moving average crossovers?

Moving Average (Moving Average) is one of the first technical analysis indicators, developed in 1901 by the English statistician P. X. Hooker. The name "moving average" was given to the indicator by George Udny Yule, who discovered the crossings of moving averages with different periods (the fast and slow lines).

The Scottish mathematician did not make use of his own work, but the first traders who applied the crossover principle became millionaires; their earnings and the simplicity of calculating the Moving Average caused the indicator to spread widely.
The indicator's performance raised no questions until the mid-1930s, when a period of flat appeared in the market. Moving Average ruined many currency speculators, but it gave an impetus to the development of various formulas that in one way or another took into account the influence of the latest price values (EMA, WMA, LWMA, etc.).
The second period of stock market flat came at the end of the 1960s and lasted more than 10 years, becoming the starting point for algorithmic trading. The appearance of computers and asset price charts led to the flourishing of indicator-based technical analysis. Programmers created mechanical trading systems for traders by request - prototypes of modern Forex advisors.
A multitude of solutions and variations of technical tools could not completely eliminate the use of moving averages in trading; these indicators are still the most effective trend identifiers.
Despite the variety of Moving Average indicators (more than 600 versions of the indicator are presented in the corresponding forum topic), the most effective remains the original simple moving average model proposed by statistician Hooker. Attempts to solve the flat-market problem directly in the indicator formula using various mathematical approaches, including artificial intelligence, still have led nowhere.
How can lag in a moving average be turned into a perfect trading tool?

A simple moving average becomes a reliable and profitable trading indicator if the following set of rules is observed:
Standard Metatrader settings suggest calculating the average value over 20 days; this figure allows a position to be held for up to several months. Medium-term trend trading is the very best way to follow currency rise/fall cycles.
The absence of liquidity, that is, essentially flat, is easy to identify by a sharp drop in trading volatility, which is defined as the standard deviation of the current price. The formula for calculating this parameter is built into the Standard Deviation indicator, whose period should be slightly smaller (18) than the analogous period of the moving average on the chart of the analyzed asset.
In the figure above, a moving average with a period of 20 has been added to StDev; to display it, drag Moving Average "into the basement" and select the calculation item "Previous Indicator's Data".
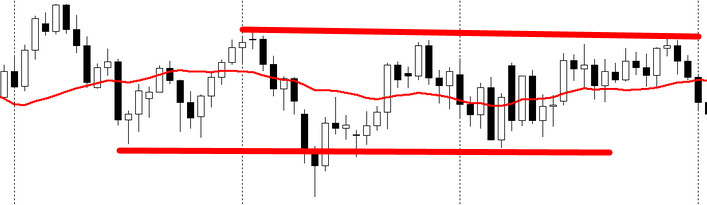
The two-month flat period shown in the example was reliably filtered by standard deviation. Below is another example with a length of one and a half months. Recall that the combination of indicators uses "double lag," while working in flat better than the more complex MACD or the trend-following Parabolic SAR.
Lag manifests itself at the start of a trend, but the entry rules make it possible to turn this drawback into yet another advantage of trading with lagging indicators.
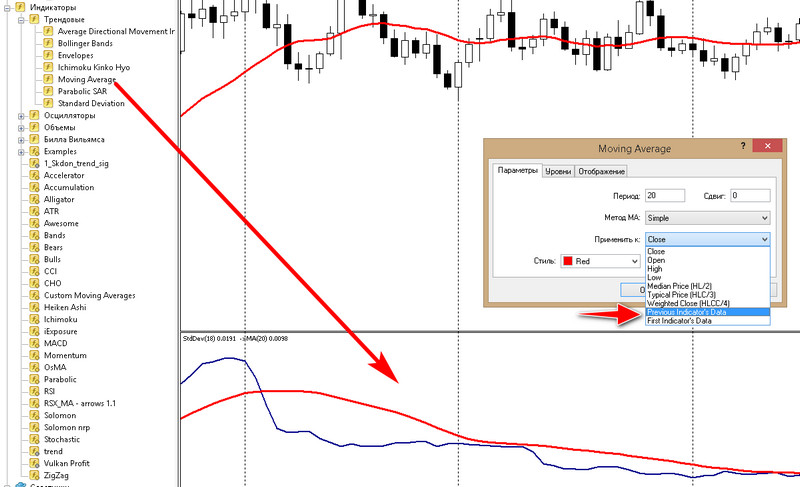
In the figure above, a moving average with a period of 20 has been added to StDev; To display it, drag the Moving Average “to the basement” and select the “Previous Indicator's Data” calculation item.
The position of the StDev indicator below the moving average means a ban on any trades based on signals from the simple SMA moving average. In the strategy they are standard:
All trades are taken only by pending orders placed after StDev crosses the moving average located in the basement together with the indicator from below upward:
Rules for working with trends and flats

If quotes cross the moving average line on the chart at a moment of high StDev volatility, then positions are opened at market:
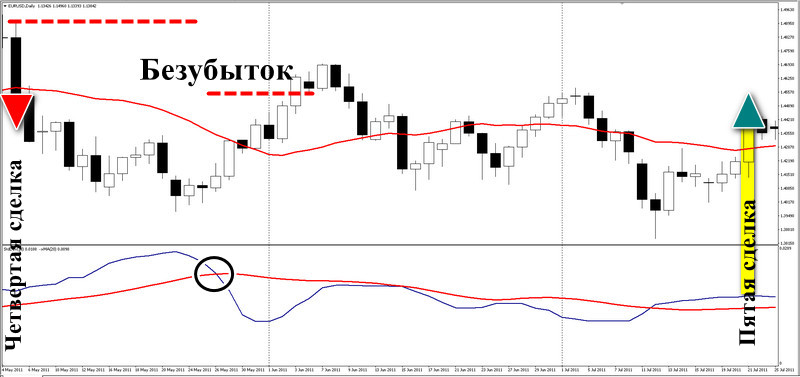
Money management in the strategy is quite simple: the stop loss is placed at the low or high of the "signal" candle whose closing price is above or below the SMA line. It is moved to the breakeven point as soon as the StDev curve drops below its own moving average line.
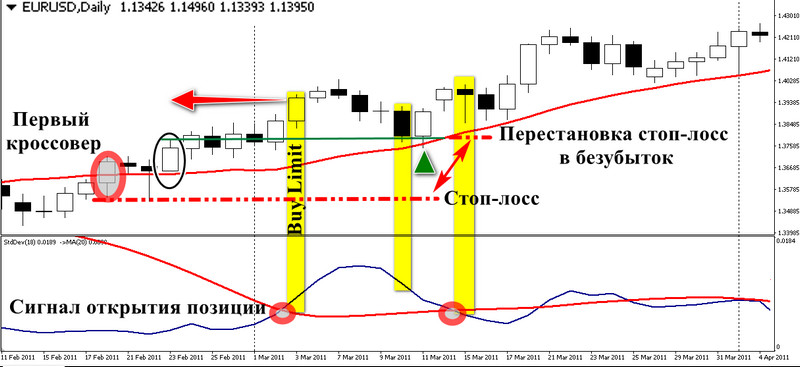
In the figure below, the trader received an entry signal from StDev with a delay, when the uptrend had already been observed in the market for 18 days. According to the rules, the level for the Buy Limit order was given by the first bullish candle with a body above SMA (20). Its search should begin immediately after the first crossing of quotes and the moving average line.
The order was triggered at the moment of correction, when volatility was above the "subwindow" SMA, which does not contradict the rules. The trader protected the trade with a stop loss equal to the low of the crossover candle, which was moved to breakeven after three candles because volatility had fallen below the average value.
This order was closed with a loss, but the next one, opened by the same rules, coincided with a market reversal and the end of a long-term uptrend, which brought the trader +550 pips.
Before the start of the downtrend, the trader entered a flat zone, but managed to close the trade at breakeven by moving the stop loss when volatility dropped below average values.
Examples of transactions

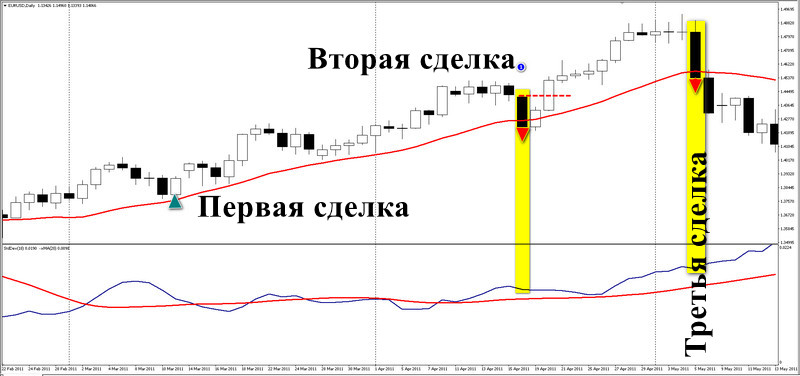
In this case, we place an order to close at the entry price without removing the stop. It can trigger earlier than the stop loss, closing the position at zero, which is what happened in the example. A month after the flat, EURUSD quotes determined the trend, allowing the trader to enter the market with a Sell Limit order.
The order was triggered at the time of correction, when volatility was above the “basement” SMA, which does not contradict the rules. The trader defended the dealstop loss, equal to the low of the crossover candle, which was moved to breakeven three candles later as volatility fell below the average.
In 21st-century trading, econometrics and neural networks, which analyze markets using nonlinear methods and various complex decompositions of time series, are beginning to prevail, where calculations include identifying cycles and applying smoothing of results with moving average lines.
This statistical method is still "in service," but a moving average can be used directly if you correctly filter out moments when it is not worth trading in the currency market at all. A trader should understand that liquidity and trading volumes are the fuel for trends, without which every movement will be random both in range strength and in direction.
Indicator lag will allow entry into the market when the tendency strengthens and the first correction wave passes, which in 90% of cases will make the trader's position profitable within one or two candles after entry. This will provide a profit cushion that allows pullbacks to be endured in the process of long-term trend following.
Respectfully, Ivan Petrov
Tlap.io
In this case, we place a closing order at the entry price without removing stops. It can be triggered earlier than the stop loss, closing the position to zero, which is what happened in the example. A month after the flat, EURUSD quotes determined the trend, allowing the trader to enter the market using a Sell Limit order.
Conclusion

In 21st century trading, econometrics andneural networks, which analyze markets using nonlinear methods and various complex time series decompositions, where the calculations include the identification of cycles and the use of smoothing results using moving average lines.
This statistical method is still in use, but the moving average can be used directly if you correctly filter out the moments when you should not trade in the foreign exchange market at all. A trader must understand that liquidity and trading volume are the fuel for trends, without which every movement will be random in both range strength and direction.
The lag of the indicators will allow you to enter the market when the trend strengthens and the first wave of correction passes, which in 90% of cases will make the trader’s position profitable within one or two candles after entry. This will provide a margin of profit that will allow you to withstand pullbacks in the process of long-term trend following.
Best regards, Ivan Petrov
Tlap.io
