
What is wrong with data from the CME exchange and other "crowd sentiment" indicators?

Hello, fellow forex traders!
The main task of trading comes down to finding and creating a trading system with a high win rate, that is, the average number of trades closed in profit. And this task turns out to be unsolvable for most traders, despite the many technical analysis tools and the huge number of indicators.
Analyses of COT reports and sentiment indicators (crowd mood) provide great help to currency speculators in this difficult task. However, these methods are not ideal and have some drawbacks. In today's article, we will look at the problems CME exchange data can have and ways to solve them.
What is the problem?
One of the reasons for the fruitless search for the Holy Grail is strategies that do not work, or theoretical principles of analysis and market forecasting that do not work. Traders are often told about the fundamental timelessness of theory, but this applies far from all areas, and the reason is new types of instruments that change the principles of trading.
This happened with forecasts based on market sentiment (sentiment): some brokers pass them off as a unique insider tool, introduce paid subscriptions to these signals, or sell software. Despite this, the readings of various sentiment indicators are built on real position data; their accuracy is low, but they are still studied in theory and exist in practice in many services and terminals.
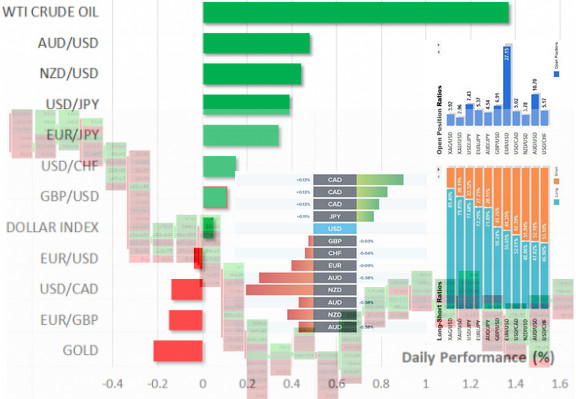
The reason for the popularity of Sentiment indicators

The pioneers of the market sentiment analysis strategy were insiders. By buying information from brokers about the positions of large players, it was possible to make money without any indicators or analysis by repeating their movements. It was the easiest money, for which a fine or prison term is now imposed.
With the development of legislative regulation, such information came under prohibition. Institutional investors also took measures, working through intermediary market makers who place orders through a network of brokers and spreading entry over time.
However, no matter how large players hid their actions, the specifics of the law on transparent trading in the derivatives market gave away their positions. Larry Williams was one of the first traders to reveal to the world the principles of analyzing COT reports.
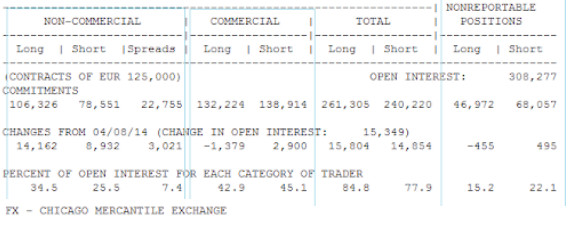
On our website, this indicator is briefly described; it works using data from the CFTC Commission, which in the USA supervises the derivatives market. Large investment companies and brokerage houses disclose weekly the volume of open positions for each instrument, including currency futures and options.
This is Sentiment: long positions of large players logically point to their desire to buy the euro, while shorts point to the desire to sell the European currency.
The idea of analyzing output data from exchanges created high demand among traders who wanted indicators showing trading direction by selectively calculating the majority of large traders already in the market, that is, those who had already "voted with real money" for the chosen direction.
Various ways of displaying trade tape data, analytics of pending orders from exchange order books, positions of clients of large brokers, volumes of capital flows into ETF funds by countries, currencies, derivatives, and many other indicators of real investment were added to COT reports.
A separate business grew up around sentiment: indicators were sold by paid subscription, standalone programs were created, or data was embedded into terminals owned by certain brokers and developers.
The sale of Sentiment-type indicators continues even now, but on our website all this data is provided free of charge. It is important to understand that this is a simple stream of position statistics, and it does not work for the reasons analyzed in detail in this article.
What is wrong with CME data?

A quick look at COT reports proves the correctness of the postulates of Larry Williams: the line of large Large Speculators follows the trend, Commercials positions are opposite to it, and small players can be ignored.
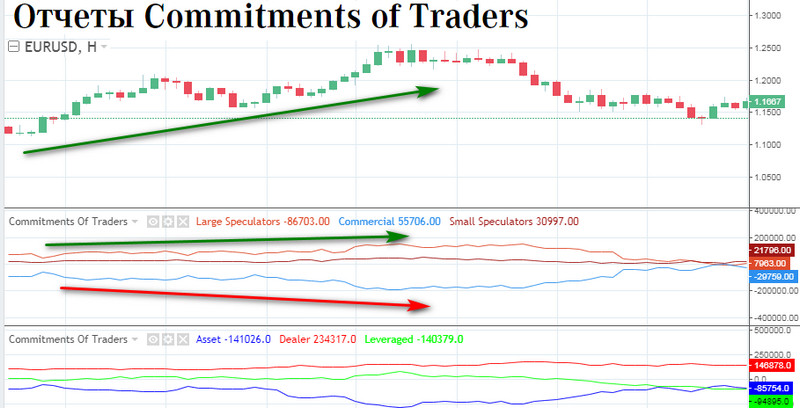
Let us pay attention to the figures of institutional investors and speculators in EURUSD, first recalling the fundamental picture that had formed by the end of February 2020.
The coronavirus discovered on the last day of December had by that time gone beyond the borders of China, beginning to strike country after country. On our website there was an article that predicted in advance the development of the pandemic and the fall of stock markets. The collapse of stocks could have affected the Forex market and specifically the euro only if the Fed rate was lowered.
Banks JP Morgan and Goldman Sachs knew this in advance; there was even a Reuters article saying that the Fed would hold an emergency meeting and lower the rate (which is what happened in the end). And what were the Large Speculators doing? They were selling at a loss throughout the two weeks of uninterrupted growth in the EURUSD pair, which had been heavily overbought before that. The speculators were doing the same, actively hedging positions in the wrong direction.
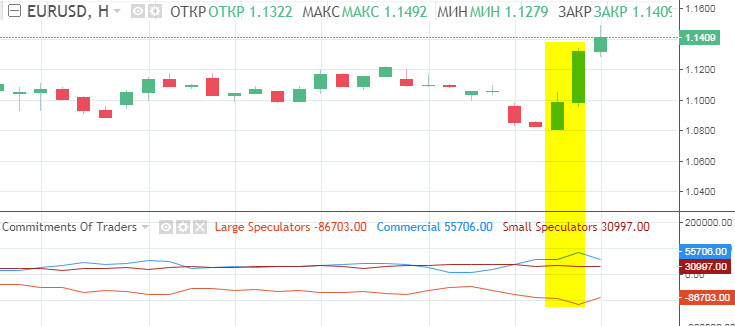
It is hard to assume they did not read Reuters or did not know about the rate. Traders following COT reports could have missed 530 points of profit.
Why are the signals so delayed, and where was Larry Williams wrong? The report analysis methodology arose in 1977, when options had just appeared. It worked until 1990, but then failed when complex hedging strategies emerged, using combinations of simultaneously sold and bought different types of options and futures.
The problem is that COT reports do not take into account the direction of the option and the futures contract. In the example above, large players could have held short futures positions while at the same time actively buying Call options to hedge the risk of a market reversal. However, such trades will be reflected as an overall increase in the position.
What can replace analysis of COT reports in the Forex market?

Taking into account the specifics of the weekly report, traders who hold long-term positions work with it. COT data certainly indicates the direction of the trend, but reversal points or opposite entries can be provided by analysis of the Open Interest of CME currency options.
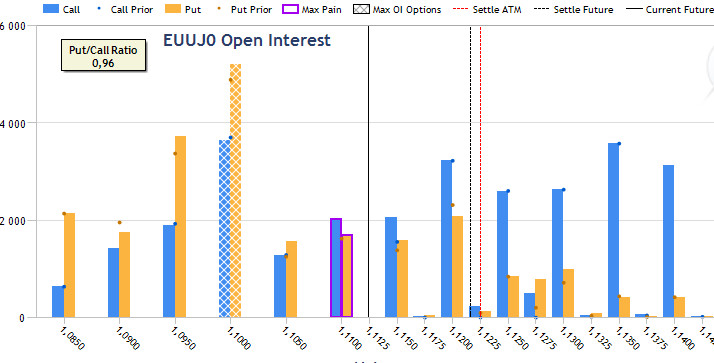
The picture shows how the price of the euro futures exceeded the zone of maximum OI, accurately predicting the correction that is developing on Forex at the current moment. In a similar way, it was possible to predict the "February bottom" and the rebound of EURUSD. The methodology for working with Open Interest levels is described in a separate article on our website.
The volume of real trades as sentiment in the Forex market

Analysts proposed calculating the mood of large speculators in the Forex market by "breaking down" trading volumes at each price level of the currency pair. This makes it possible to see the tape of all trades broadcast by the Chicago CME exchange.
CME Group has shown leading trading volumes for various types of derivatives for more than half a century, including currency futures. Data on their trading, after preliminary processing, is broadcast by a number of trading terminals (TraidingView, IB, ATAS, Ninja, etc.).
The trader sets a period for which the profile indicator sums the history of the trade tape at each price level where the threshold trade volume passes. The resulting levels are overlaid on the chart in the form of a horizontal histogram. The length of its bars clearly shows the "strength of the level" of support or resistance.
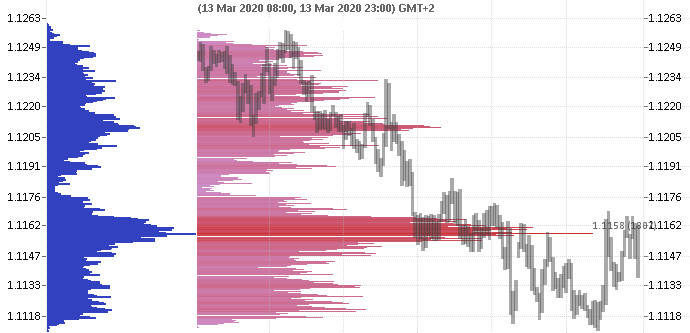
It is believed that large traders conduct high-volume trades only at an asset price that seems suitable to them for building a position. A trader who places an order in the same zone will be able to take part in the future trend from the very beginning or catch a speculative corrective rebound.
The strategy is described in more detail in an article on our website; links and the profile indicator for Metatrader are also posted there.
In reality, a falling trend breaks through these levels, giving no obvious advantage over ordinary chart analysis. Moreover, global trend reversals occur in zones with minimal horizontal trading volume. This fact destroys the theory that it is precisely a series of large trades that reverses the rate of a currency pair.
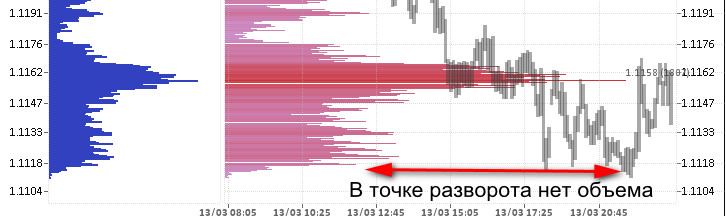
The length of the horizontal histogram is determined by the duration of the flat. Where a sharp drop occurred with a trend reversal, there will never be a histogram signal. Sometimes traders combine two different periods for calculating the market profile, believing that the "deep past" will predict reversal zones, but this does not work either.
The reason is that trading zones interested large buyers and sellers only at the moment of the trade. A return of quotes back means a change in the situation, which does not at all indicate that large traders will enter the market again at the same price; rather the opposite.
If they previously bought or sold at these levels, it was only to make a profit in the trend. A return of quotes to the entry point indicates that something went wrong, or that the volumes accumulated earlier and marked by histograms were unloaded somewhere above or below.
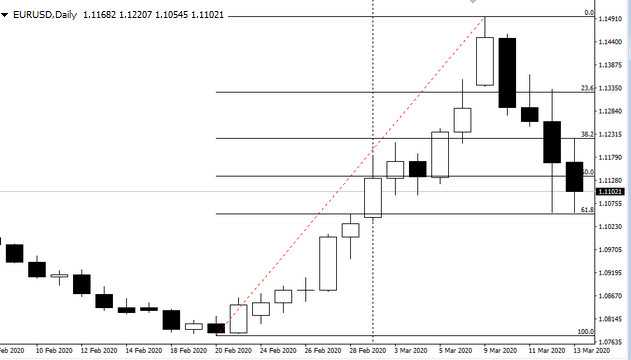
If we compare the recent situation of the sharp rise and pullback of EURUSD, then the second week of the 2020 crisis proves the more effective performance of Fibonacci levels. The market profile histogram was unable to determine the reversal point, which matched the 61.8% level exactly.
Positions of investment banks in the Forex market

The most direct way to understand the sentiment of large players in the Forex market is to know exactly the positions of investment banks. Such information can be found on the Internet and for several years was published on our website in daily forecasts.
Two years of statistics collected from the 15 largest world banks made it possible to sum up the results of the strategy of following insiders. They are rather disappointing: a trader would have to believe that 35% of global financial players constantly lose money in the Forex market!
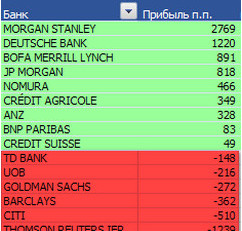
The conclusion suggests itself that the best strategy is to follow the leaders of the list presented above, but in 2020 Morgan Stanley lost 680 points just at the start of the year. Apparently, there is constant rotation in the list of banks: "money-losers" find themselves for several years in the list of profitably trading banks and vice versa. This happens because of a more complex strategy carried out by financial institutions in the interests of clients, their own positions, and combined simultaneous trading in securities markets (stocks, bonds), futures, and commodities.
Perhaps a trader will be lucky and will be able to follow the profitable orders of Morgan Stanley or Nomura for several years, but what will happen when the situation changes? How will the trader understand that the bank is losing money if each one on this list has both positive and negative trades?
Conclusion

Various ideas for analyzing statements do not give the trader an advantage in trading because of the broad specialization and complex hedging schemes used by hedge funds and banks. Real volumes of direct purchases or sales in currency pairs by large clients also appear on the market in small lots, executed through market makers.
Analysis of market sentiment from the point of view of overall positions is also ineffective: the "crowd" buys at highs and sells at lows or joins the trend too late. There is no need to chase insider information: it is already priced in and can be read transparently if the trader possesses knowledge of Price Action.
Best regards, Ivan Petrov
Tlap.io