
What You Need to Know About Bollinger Bands

Good day, ladies and gentlemen, forex traders! We continue our in-depth study of indicators that have become classics. The kind of indicators that brought millions to market players and are still used by thousands of traders around the world today. Today we will talk about such an indicator as Bollinger Bands (hereinafter BB), or Bollinger's standard deviation range (also known as Bollinger Bands or Bollinger Ribbons). We will figure out what it shows, strategies for using it in trading and... a few more interesting things)
Introduction

This indicator was first described by Perry Kaufman in 1987 in his book “The New Commodity Trading Systems and Methods.” Later, the indicator became widespread thanks to the American technical analyst from California and the author of this remarkable indicator, John Bollinger.
John Bollinger was born in the city of Montpellier, France. Later his family decided to move to New York. Since childhood John had been interested in cinematography and photography, so he enrolled in the School of Visual Arts in New York, where he trained as a lighting cameraman. By the way, the cameraman profession came very easily to him, so he predictably moved to West Hollywood in 1976. But the meaning of his life and his interests turned in another direction from the moment his mother asked him to look over her investment portfolio. He forgot about the cameraman profession for good, although it still helped him get a job at the Financial News TV channel in the same role, where he was able to observe the work of financial analysts firsthand and absorb important information. After taking courses in analytics and gaining the necessary knowledge, he got a job at the TV channel as a trading analyst. His career at the channel did not last long, and in 1991 the rights to the channel were bought by CNBC, although John Bollinger's analytical news is still aired there once a week. It was precisely during the period from 1984 to 1991 that he developed his own system of rational and effective analysis, later called “Bollinger Bands.”
This analytical tool has not lost its relevance even now. His book “Bollinger on Bollinger Bands” is a detailed guide to using this tool both individually and in combination with other indicators. And in 1996 he was recognized as the best developer of software for financial analysis.
Indicator Description
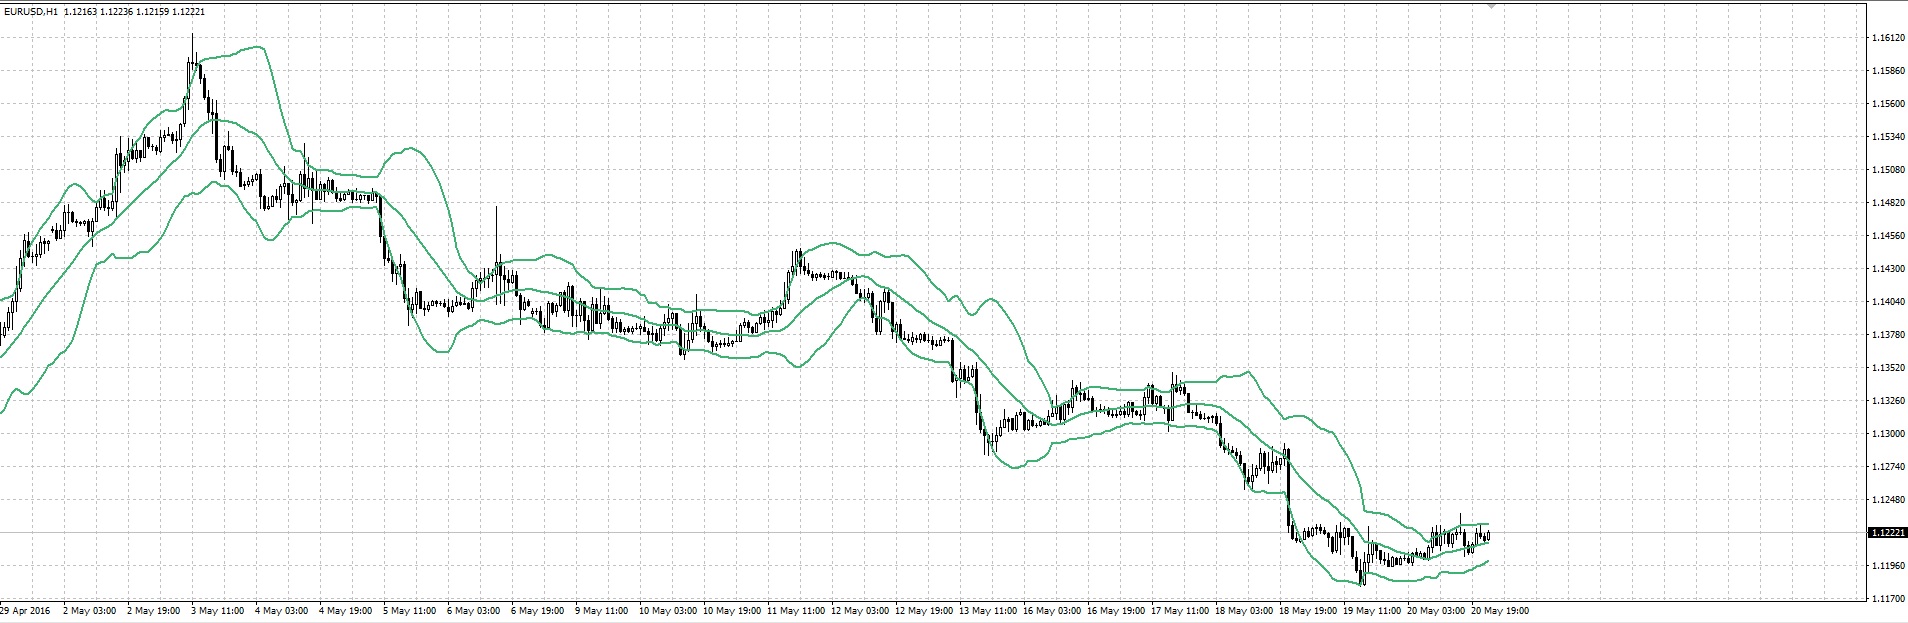
Graphically, Bollinger Bands are two lines that limit price movement from above and below respectively. These are a kind of support and resistance lines, which most of the time are located at levels distant from price.
Bollinger Bands are similar to moving average envelopes. The difference between them is that the boundaries of envelopes are located above and below the moving average curve at a fixed distance expressed as a percentage, whereas the boundaries of Bollinger Bands are plotted at distances equal to a certain number of standard deviations. Since the value of the standard deviation depends on volatility, the bands regulate their own width: it increases when the market is unstable and decreases during more stable periods.
The basic rule when plotting Bollinger Bands is the following statement: about 5% of prices should be outside these lines, and 95% inside.
Bollinger Bands are formed from three lines. The middle line is an ordinary moving average. The upper line is the same middle line shifted upward by a certain number of standard deviations (for example, by two). The lower line is the middle line shifted downward by the same number of standard deviations.
The uniqueness of Bollinger Bands lies in the fact that their width changes in response to changes in market instability. A Bollinger Band is built as a band around the average, but the width of the band is proportional to the mean-square deviation from the moving average over the analyzed period. When there is high volatility in the market, for example during the release of news, the band expands; when the market is quiet, it narrows.
As with all other indicators, I recommend analyzing BB together with other indicators. The purpose of the BB indicator is to determine sharp deviations from the average rate of the current trend of a currency pair. If BB is chosen correctly, then its moving average (the central line) is a good support/resistance level, and the boundaries of the BB channel can serve as targets when opening positions. Usually BB bands are applied to the price chart, but they can also be applied to any indicator drawn in a separate window, for example to an oscillator.
Bollingers identify natural extremes in a developing trend. If the Bollinger moves upward, price rebounds until some sufficiently strong force stops the price movement. A stagnation zone forms below the upper or above the lower Bollinger. The stagnation state may continue until the Bollinger turns and, opening up, begins to move away from the price bar, which will indicate that resistance has been overcome. Price can shoot in the direction of the current trend and cling to the Bollinger edge. However, one should not lose sight of the fact that the final price movement depends on all support/resistance levels, and not only on those associated with BB.
Do not try to find ideal conditions for opening/closing positions. Learn to work in imperfect conditions when you receive false signals.
BB Indicator Calculation

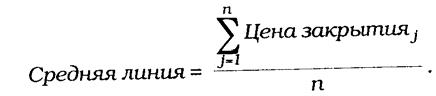
Bollinger Bands are formed from three lines. The middle line is an ordinary moving average. In the expression below, “n” denotes the number of unit time intervals that make up the calculation period of the moving average (for example, 20 days).
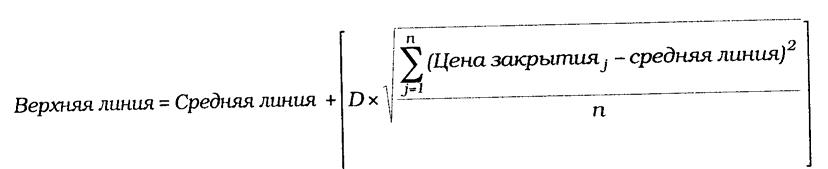
The upper line is the same middle line shifted upward by a certain number of standard deviations (for example, by two). In the following formula, “D” denotes the number of standard deviations.
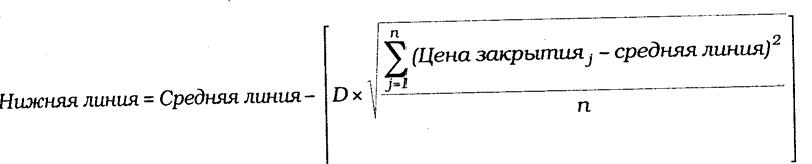
The lower line is the same middle line shifted downward by the same number of standard deviations (that is, by “D”).
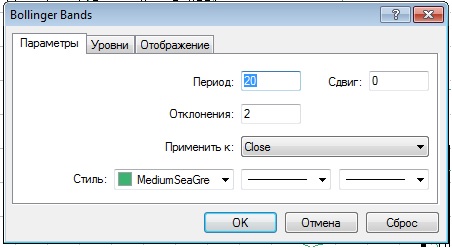
J. Bollinger recommends using a 20-period simple moving average as the middle line and 2 standard deviations to calculate the band boundaries. He also found that moving averages shorter than 10 periods are ineffective. Let us dwell on the indicator settings in more detail.
Indicator Settings
Period
For Bollinger Bands, it is recommended to set a period from 13 to 24, the most common being 20, and a deviation level from 2 to 5, with the recommended value being 2 or 3. You can also use Fibonacci numbers, round numbers 50, 100, 150, 200, and the number of days in the trading and calendar year, 240 and 365. At the same time, it should be understood that setting larger periods reduces the indicator's sensitivity, which is unacceptable in markets with low volatility. Most of the time the price stays within the channel, but during a sharp move crossing the Bollinger Bands is normal. However, if the price crosses the upper or lower band too often, then the period should be increased, and if the price rarely reaches the outer bands, then the period should be reduced.
Price
Most often, closing prices are used to calculate Bollinger Bands. Other varieties may also be used, such as typical and weighted prices.
Timeframe
Bollinger Bands work equally well on any timeframe, but as a rule they are used for intraday trading.
It is worth remembering that for different currency pairs and different timeframes, the indicator settings should be selected separately.
Ways to Use It

The developer himself notes the following features of Bollinger Bands:
- Sharp price changes usually occur after the band narrows, corresponding to a decrease in volatility.
- If prices move outside the band, the current trend should be expected to continue.
- If peaks and troughs outside the band are followed by peaks and troughs inside the band, a trend reversal is possible.
- A price movement that begins from one of the band boundaries usually reaches the opposite boundary. This last observation is useful for forecasting price targets.
So, what options for using the BB indicator can I recommend?
Price moving beyond the indicator boundaries
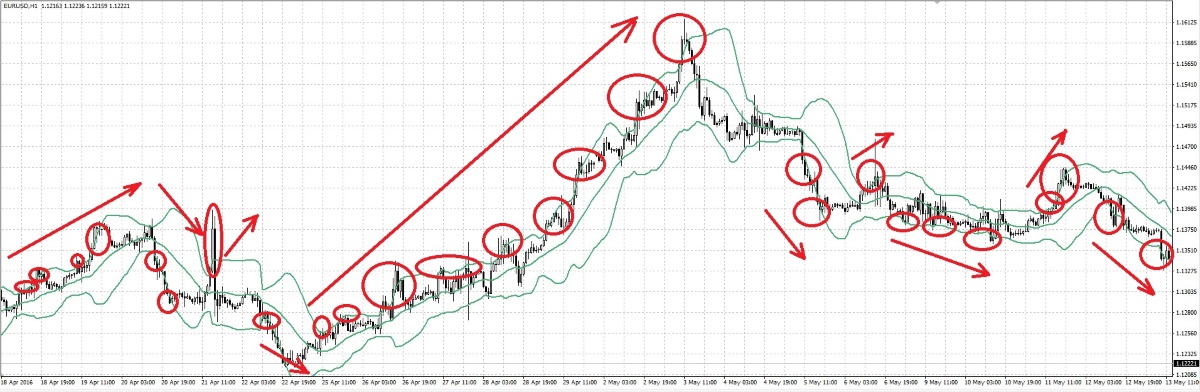
As a rule, moving beyond the BB boundary means the beginning or continuation of a trend. This way you can judge the market direction: as long as prices touch and break through the upper boundary, the trend is upward. As long as prices break through the lower boundary, it is downward.
Sometimes moving beyond the Bollinger line means a "false breakout," that is, when prices only tried a new level and immediately returned back. In this case, you also get an opportunity to work against the trend, but carefully evaluate whether the "breakout" really is "false." However, it must be taken into account that trading against the trend is a game for professionals. And if you do not yet feel like one, it is better to refrain.
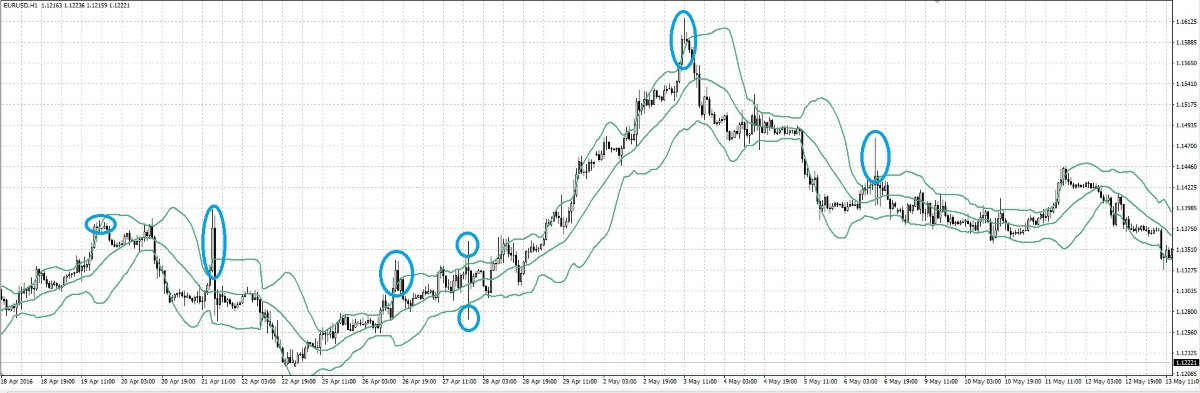
The figure above marks exactly such opportunities. Note that such countertrend opportunities appear infrequently, and they are usually characterized by a strong move beyond the indicator boundaries. Such situations are usually very clearly visible.
A price bounce from the middle BB line and its crossing
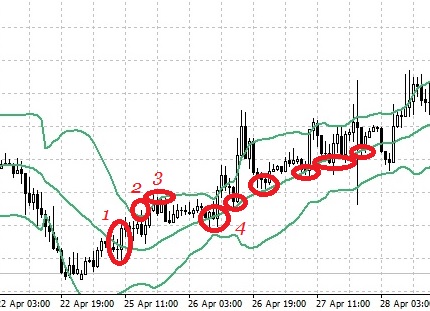
As I already said, the correct selection of the indicator period turns the middle BB line into a dynamic support/resistance level that works excellently in a confirmed trend. Crossing the middle line of the indicator often means a trend change. In the figure above, at point 1 a trend crossing occurred, at point 2 the trend change was confirmed (prices touched the upper boundary of the indicator). At point 3 prices again touched the upper boundary until at point 4 a touch of the middle line occurred. When the point is confirmed by candlestick formations, other indicators, or graphical analysis (levels, trend lines), this gives us a reliable entry point in the direction of the new trend.
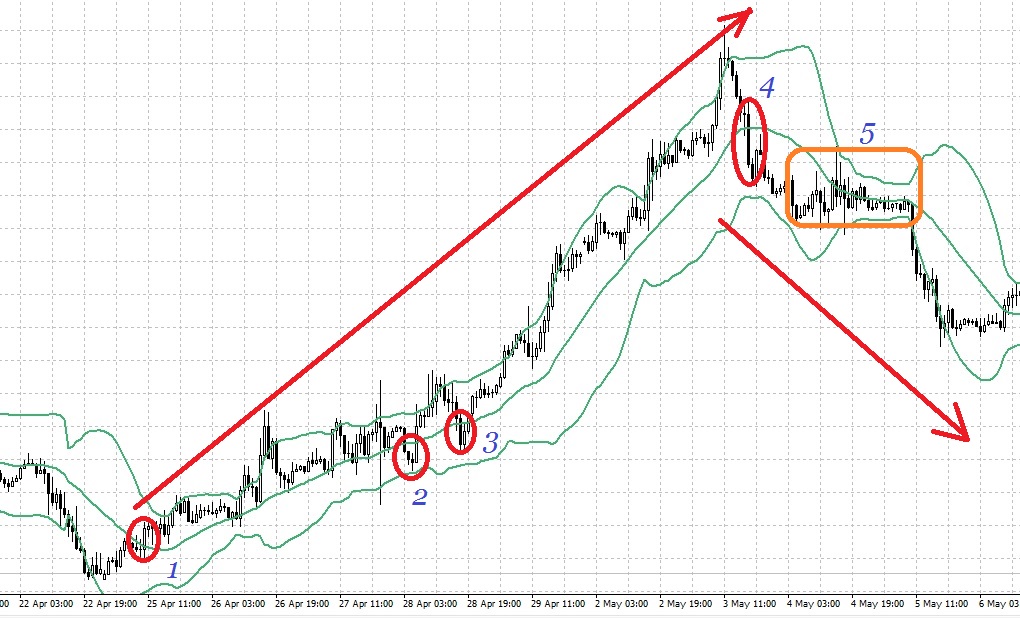
Note that after the trend changed at point 1 in the figure above, the price returned to the middle BB line many more times and bounced off it. Nevertheless, at points 2 and 3 there were also approaches to the middle line. At the same time, it was broken, but no trend change occurred; these were false breakouts. That is exactly why, when making trading decisions, it is recommended never to rely on a single indicator under any circumstances, but to filter all incoming signals using oscillators, candles, and graphical analysis. At point 4, the middle line was broken again, which led to another interesting phenomenon (point 5), which we will talk about just below.
The slope of the Bollinger lines and the position of the price relative to the BB lines
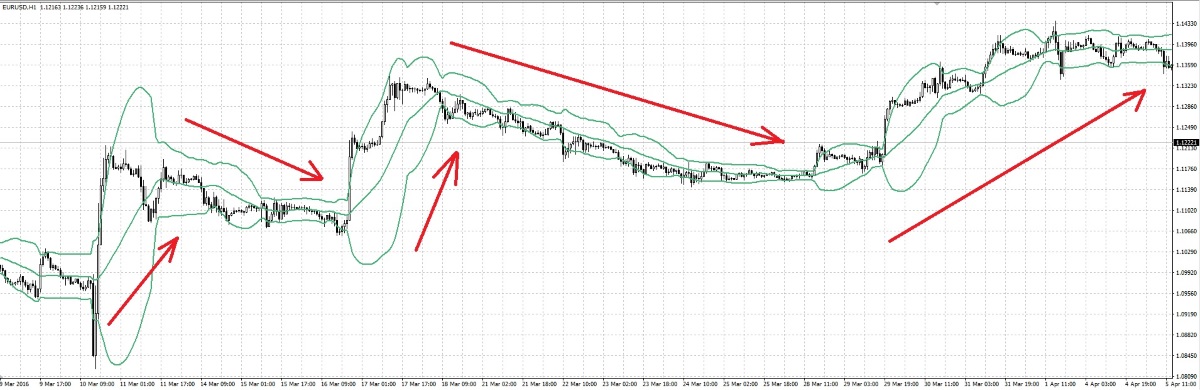
Everything is simple here. By the slope of Bollinger, as well as by the location of the price relative to the middle line, one can judge the current direction of the trend: the trend is up when the BB slope is upward, and the trend is down when the BB slope is downward. The price being below the middle line indicates a downtrend; when prices are above the middle line, one can speak of an uptrend.
Narrowing and widening of the Bollinger line range
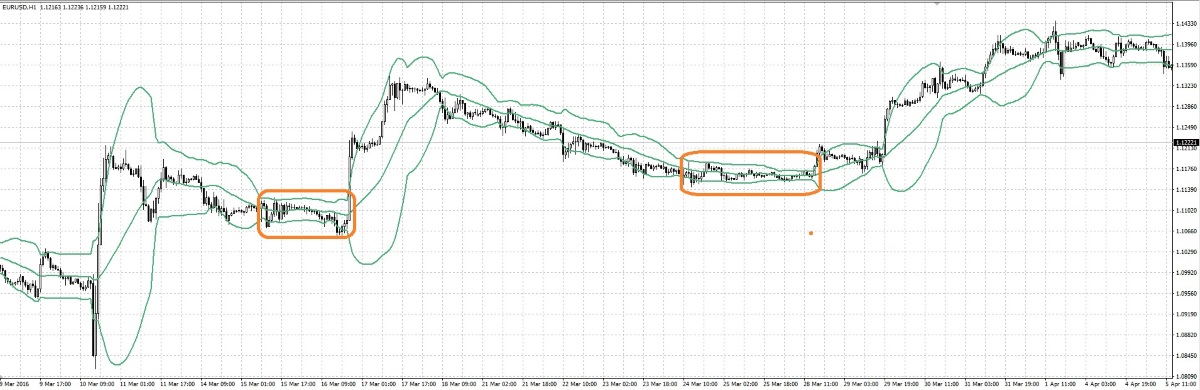
As is well known, the market constantly tends to move from a trend phase into a phase of stagnation. And when we see that the market has been calm for quite a long time already — it is worth expecting a storm. The Bollinger range becomes wider when market instability grows, and narrower when it falls. A narrow Bollinger range points to a sleepy, calm market.
The strongest market movements usually begin from a flat base (the so-called "shelf"). The Bollinger range helps determine the moment of transition from a calm market to an active one. When prices rise out of a very narrow Bollinger range, this gives a buy signal. When prices fall out of a very narrow Bollinger range, this gives a sell signal. If prices return back into the range, - the position should be closed. BB divergence is observed when the current trend strengthens or a new one begins. The longer the rate trades within narrow boundaries of the price channel (flat), the stronger and more rapid the breakout from it will be. In response to the awakening of price, the BB bands open up. If, as price approaches the BB boundary, it begins to rise, most likely the movement will continue.
By watching the bands with a trained eye in real time, you can catch the beginning of a new trend. Bollinger Bands work especially well when price tests important high or low levels for the second time. When the market finally makes a breakout, the expanding price bars reach the Bollinger Band boundaries, then the bands narrow around the contracting price bars in a sideways range, and after that a breakout or a bounce from the level occurs.
Trend continuation and reversal
Powerful buying and selling can push the price beyond the Bollinger Bands. Experience shows that in most cases no more than four candles in a row go beyond the Bollinger line, after which a correction or reversal occurs. However, trading against these movements is very risky, since the market may make short series of very volatile fluctuations before the reversal occurs and knock out your stops. But in general, such price behavior is observed quite rarely, usually during the London session, on the news.
As was said earlier, the indicator directly depends on market volatility. If the channel boundaries diverge, this indicates a continuation of the current trend, and if the outer Bollinger Bands narrow, this may indicate that the trend is fading and a reversal is possible. A breakout of the central BB band strengthens the directional impulse. If, as price approaches the BB boundary, the angle of the boundary decreases, then most likely price will break through the boundary and then make a reversal. Very often this means the end of the current trend. Watch carefully whether price will slowly bounce back, and whether Bollinger will open up at the same time. If yes, then this will be the signal of an upcoming breakout of the BB boundary and continuation of the movement.
Recognizing patterns with Bollinger Bands
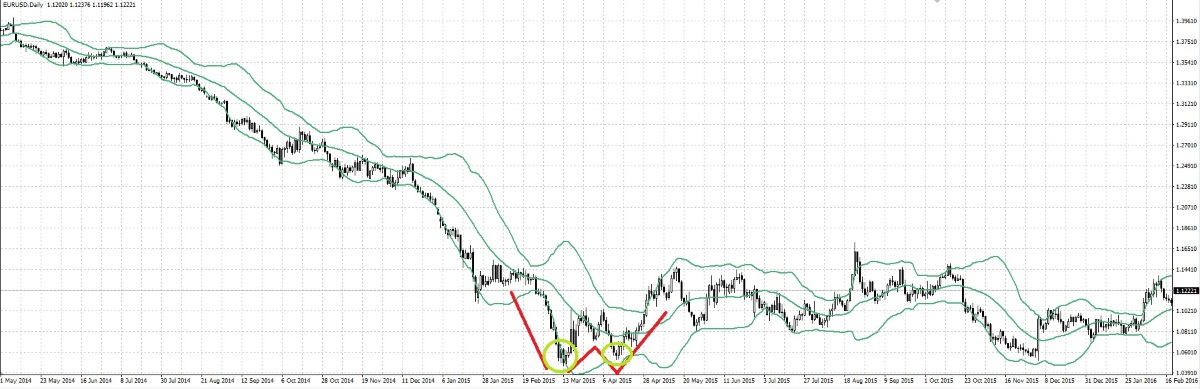 For example, let us take the "double bottom" pattern, which consists of a decline to a low, accompanied by a recovery and a subsequent decline into the area of the previous low, after which a reversal occurs that is accompanied by growth or at least by the end of the previous trend. The relationship between these two lows was at one time the subject of wide discussion among technical analysts. Should the first low be above the second, or should the lows be equal, or should the second be higher? and so on... I believe that the process of identifying these patterns becomes much simpler and the patterns themselves become more obvious if you consider the lows relative to the Bollinger Bands and ignore questions of absolute price values.
If the first low is below the lower band, and the second low is at or above the lower band, then we have a potentially interesting setup - divergence, where the second low is relatively higher than the first, regardless of their absolute price levels. Add confirmation and appropriate discipline to this, - and you will get a valuable trading tool.
Using Bollinger Bands with other indicators
As a rule, BB is used in trend systems, where entry is made in the direction of the trend after some pullback. In addition to relying on the middle BB line, it is also logical to use an oscillator to confirm the end of the pullback.
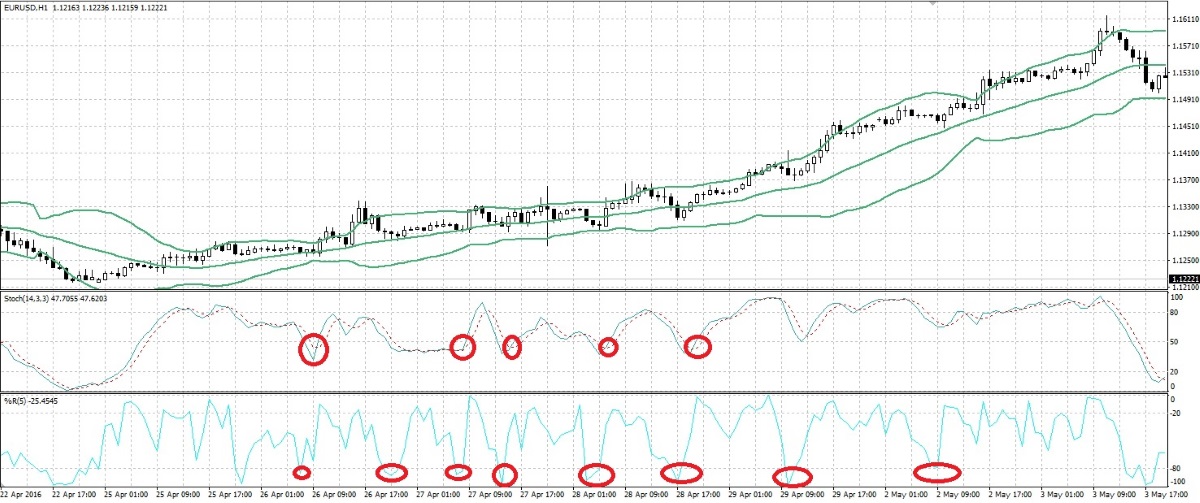
Stochastic oscillator or WPR are well suited for this task
A very interesting field for experiments is the application of the Bollinger Bands indicator to oscillators.
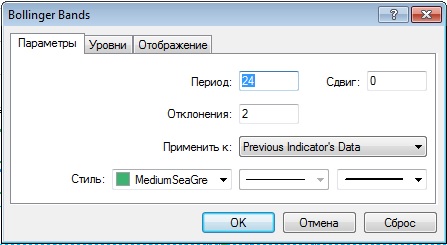
At the same time, such a combination as a rule greatly expands the capabilities of standard oscillators - in particular, it adds dynamic overbought/oversold levels that easily adapt to changing market conditions. In particular, you can build your analysis on BB applied to the price chart and to the chart of the RSI oscillator.
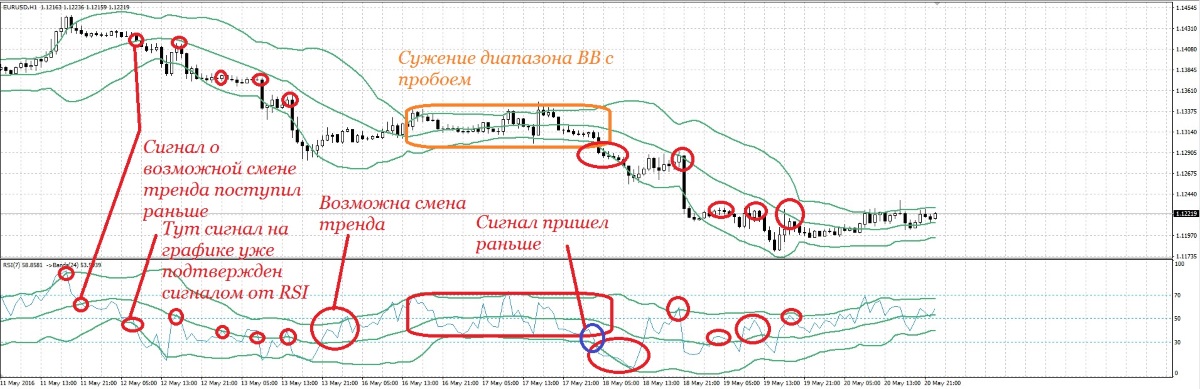
Many signals first come from the RSI-BB combination, and only later are confirmed by the BB-price combination. The proposed way of using BB bands is a huge field for experiments.
Advantages and disadvantages of BB bands

The attractiveness of Bollinger Bands for traders lies in two very important characteristics. First, Bollinger Bands (BB) demonstrate the main axes of trends/sideways ranges, similar to the way price or moving averages do. Second, in their movement they either narrow or widen. And the interaction of the mentioned properties of Bollinger Bands determines unique patterns as price bars, developing their movement, pass through one boundary or another. Japanese candlesticks work especially well with Bollinger Bands. For example, "doji" colliding with narrowing bands gives an effective signal for a short-term price reversal.
Bollinger Bands (BB) respond to price movement with their bends and turns. These wave-like movements predict how far a trend can spread before distribution forces return it to the central axis. Between the direction of price/band and the narrowing of price/band, a complex set of interactions develops. Very extensive practical experience is required to identify the final effect of these bands on price. But after spending many dozens or even hundreds of hours watching this indicator, you will not regret the effort. Bollinger Bands indicate the hidden nature of price fluctuations much better than many other tools do, and immediately let you know whether that cherished door behind which profits hide is ajar or locked.
The indicator has the same drawback as the standard moving average - lag. And the higher the BB period, the more significant it is. Nevertheless, many traders use BB in their trading, having learned to offset its weak sides and use its strong ones as effectively as possible.
By the way, if you decided to use BB in your forex trading, an oscillator such as CCI can safely be thrown off the chart. It is based on the same principles as the bands, and measures deviations from the MA. The bands are better because they keep you visually closer to prices.
Conclusion

If you use moving averages in your trading, then you simply need to consider a version of your trading system using such a multifunctional indicator as Bollinger. If, however, you have not previously encountered either moving averages or BB, I recommend that you test for yourself the options for its use set out in this article; they are at least worth considering.
Respectfully, Dmitry aka Silentspec
TradeLikeaPro.ru