
Basic Principles of Working with the VuManChu Indicator

When you are just starting to trade, you are surrounded by dozens of indicators: moving averages, RSI, MACD. They are useful, but they often show the same thing. But what if there is a tool that looks at the market from a slightly different angle?
It is time to get acquainted with VuManChu.
VuManChu indicators are among the most discussed in recent years. They help identify strong impulse moves in various markets. The indicator has become so popular that it is almost time to speak of a new trading “holy grail,” belief in which has captured the minds of young traders.
Be that as it may, this indicator is suitable for trading cryptocurrencies, stocks, and currencies, helping identify potential entry and exit points with clear and visually understandable signals. This article is a simple and structured guide to the Vumanchu indicator, the principles of how it works, and how it is used.
How It All Began
The VuManChu indicator is an almost complete copy of the Market Cipher indicator, which was developed by a successful crypto trader / team of traders under the nickname Crypto Face. Note that Crypto Face does not share success for free, but for money. A three-month license for the basic version of Market Cipher costs $400, and LifeTime costs $1500.

The paid Market Cipher is available on TradingView and contains 4 groups of indicators.
- The trend-based Cipher A shows impulses on the timeframe under consideration and highlights intermediate / non-standard moments in the market.
- The Cipher B oscillator combines 5 algorithms with the minimal signal delay typical of classic oscillators and sufficiently high signal reliability.
- Marker Cipher SR: builds support and resistance lines.
- Market Cipher DBSI: combines 36 Momentum indicators, making it possible to assess the strength of momentum in each time interval.
Vumanchu is a free almost complete copy of the first two Market Cipher indicators. The author did not complicate things and named them similarly: VuManChu Cipher A and VuManChu Cipher B. They differ somewhat from the original, but the developers state that the differences in the indicators do not affect the quality of the signals.
The free VuManChu is available on TradingView. The best-known versions are Cipher A, Cipher B + Divergences (the main and most popular one), as well as Swing Free (range filter / volatility).
There are versions for MT5: judging by the reviews, they are no worse than those available on TradingView.
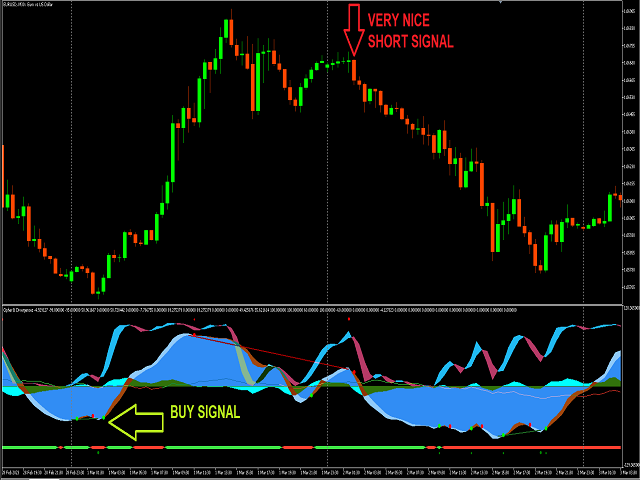
VuManChu's Popularity Is Breaking Records
The VuManChu Cipher indicator immediately attracted the attention of both beginners and experienced speculators. VuManChu Cipher B became the most popular and most discussed.
The main goal of the indicator is to show the market’s “strength and direction” and help the trader catch a reversal or impulse, turning all of this into understandable signals.
Vumanchu visually shows key market moments:
- When the market is “gaining strength”
- When a small correction may begin
- When a reversal is likely
- When it is already too late to enter.
Trader communities on social media played a major role in popularizing the VuManChu indicator. Various trading forums and chats are full of “before” and “after” charts, and YouTube is filled with videos demonstrating profits after starting to use the indicator in a trading strategy.

It is no secret that if traders share screenshots with profit, this creates a domino effect and encourages even more people to use this indicator. Of course, the avalanche-like growth in popularity would not have been possible without the simplicity of the visual interface.
Beginners are attracted by the bright color-coded waves that indicate a change in momentum. These waves give a quick idea of bullish or bearish trends, eliminating the need to figure out for themselves what is happening in the market.
It does not require deep knowledge of technical analysis — signals are highlighted with color, dots, waves, and markers.
Another reason for the indicator’s growing popularity is its adaptability. Traditional oscillators are often difficult to interpret without proper training and an experienced trader’s eye. In contrast, the VuManChu indicator presents momentum data in a form that is more understandable for beginners.
And most importantly. The VuManChu indicator fits well into various trading styles. It is suitable for both short-term trading and swing trading.
A Little About What Is “Under the Hood”
VuManChu Cipher A
VuManChu Cipher A shows the trend and its strength. This popular indicator is based on a combination of eight exponential moving averages known as EMA ribbons. Moving averages with smaller values are built on short time periods. The trend direction is determined by the position of EMA2 and EMA8 relative to each other. The fastest moving average, EMA1, is used to identify certain signals.
VuManChu Cipher B
VuManChu Cipher B is more universal, which is why it is more popular. It analyzes the readings of several time-tested oscillators, including:
- WaveTrend (an indicator created by one of the TradingView community members);
- Money Flow Index (MFI);
- Relative Strength Index (RSI);
- the combined Stochastic RSI indicator;
- the Shaff Trend Cycle indicator;
- MACD.

Default Settings in the Package
The trader can configure all the main indicator parameters. It is better to use it on a Heiken Ashi chart. Regular Japanese candlesticks are also suitable, but it is believed that on Heiken Ashi the result is better.
It is important to remember that the default values are set for BTCUSDT. The reason is simple: the authors of the original Market Cipher package traded on the crypto market.
The standard settings are quite suitable for trading other crypto that has a high correlation with bitcoin. But for other markets and assets, you need to select your own settings.
Adjusting the indicator to a specific instrument is quite difficult. Moreover, manually brute-forcing the variables in the indicator is generally useless, and it is almost impossible to get an adequate picture of the market for a specific instrument. A strategy tester is needed to evaluate the parameters.
Main Elements of the Vumanchu Indicator
VuManChu Cipher A
The standard appearance of the indicator is shown in the picture below.
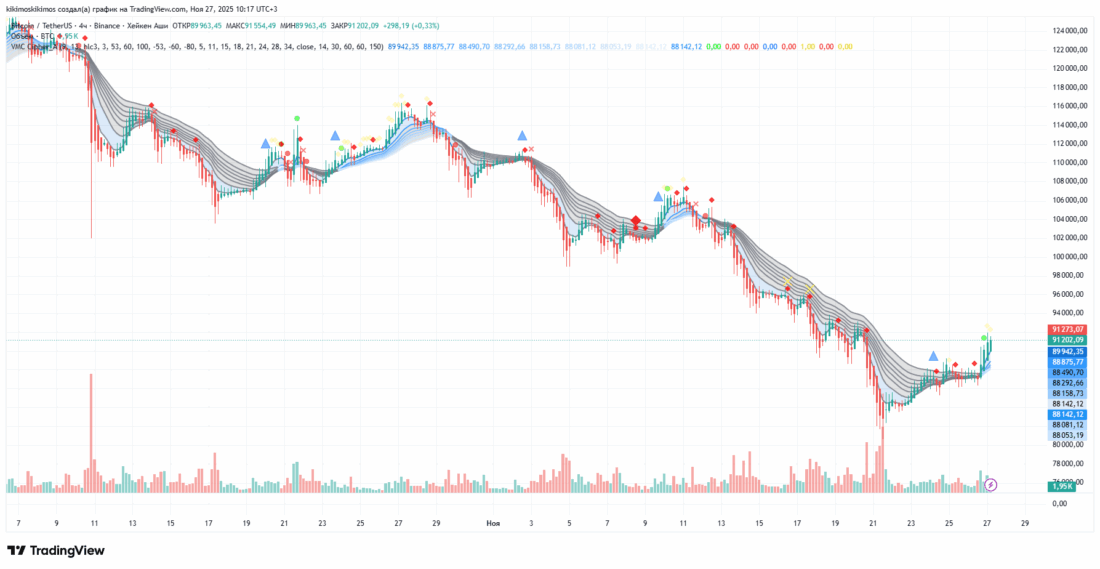
The symbols that the indicator draws on the chart mean the following:
❌ Red cross – sell. A decent setup with a delay.
🔴 Red circle – EMA sell. A rare lagging signal with good follow-through.
🔶 Red diamond – sell with a 90% probability.
🔶 Diamond (large rhombus) – 100% sell.
✖️ Yellow cross – manipulation. Cancellation of a reversal entry, high probability of continuation of the initial movement.
🔼 Blue triangle – the trend is approaching completion, but often another 1-2 trend candles will form before actual completion. A quick reversal is possible.
🟢 Green circle – EMA buy. A rare lagging signal with decent follow-through.
◊ Green diamond – buy.
Vumanchu Cipher B
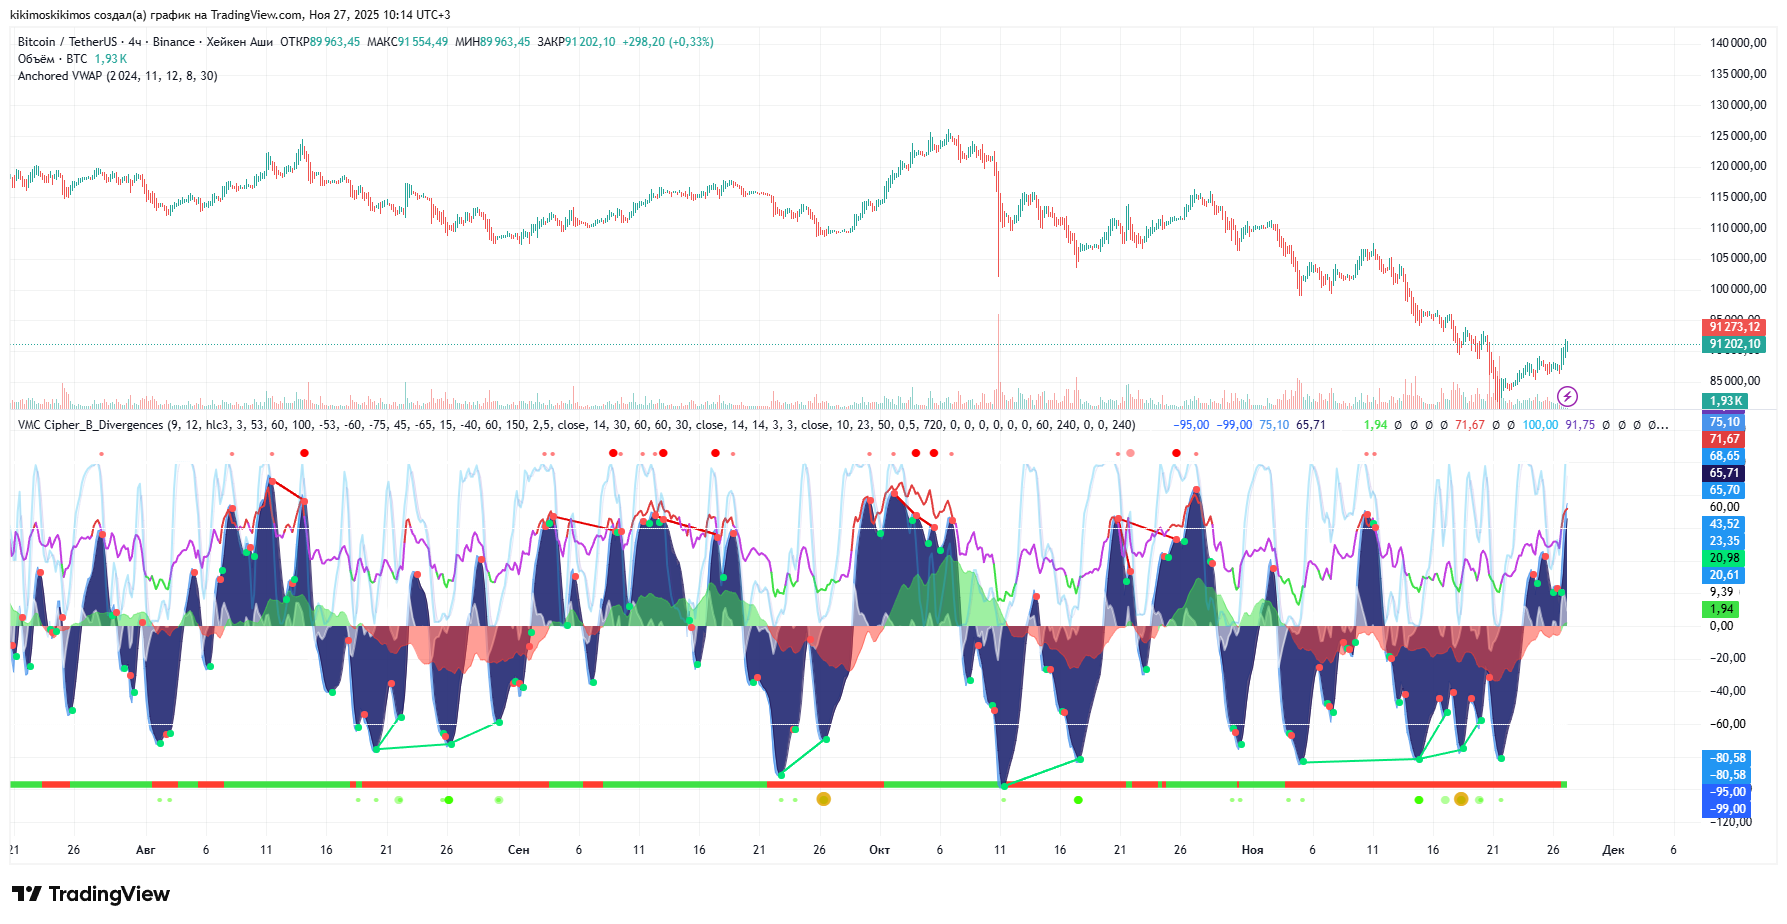
1. Trend waves (WaveTrend)
These are white or blue waves that show the strength of the price movement upward or downward.
A simple rule:
- The wave is rising — the market is gaining strength.
- The wave is falling — strength is weakening.
- The wave goes far up/down — the market may be preparing for a reversal.
2. “Green dot / red dot” points
This is one of the most popular Vumanchu signals:
- Green dot — a possible upward reversal.
- Red dot — a possible downward reversal.
Important: these are not buy/sell commands, but merely hints.
3. Divergences
Vumanchu automatically shows:
- Bullish divergences (price falls, while the indicator rises).
- Bearish divergences (price rises, while the indicator falls).
These are important signals of a possible trend reversal.
4. Money in the market (Money Flow Index / MFI)
This is the green or red area at the bottom:
- Green zone — money is entering the market.
- Red zone — money is leaving.
Beginners often focus on this particular zone so as not to enter “against the money.”
5. Volatility spikes (Trigger Waves)
Small mini-waves that show short impulses. If a mini-wave coincides with a green/red dot, the signal is strengthened.
Step-by-Step Guide: Applying the VuManChu Cipher B Strategy
Installing the indicator is only half the battle. Successfully making trades with the VuManChu Cipher B strategy requires a methodical approach. Below is a step-by-step algorithm that will help open positions, manage risk, and exit trades effectively.
1. Signal identification
- Looking for a strong impulse: the moment the impulse wave crosses the zero line from bottom to top (a bullish signal) is a potential entry point for a buy. And vice versa, if the wave crosses the zero line from top to bottom, this may be a short entry.
- Identifying divergence: the formation of a bullish divergence on the oscillator (a higher low on the wave, a lower low on the price) strengthens the signal for buys.
2. Confirmation by volume
- Tracking volume spikes. Volume often serves as confirmation. If trading volume increases when a bullish or bearish signal is received, this indicates greater confidence in the move.
- Volume indicators. Some traders prefer to use on-balance volume (OBV) or standard volume bars for greater clarity. If volume matches the direction of the momentum wave, this increases the reliability of the signal.
3. Setting stop-loss and take-profit
- Determining an acceptable risk level: risk per trade is no more than 1-2%.
- Placing a stop-loss: use support and resistance as a guide.
- Determining take-profit: targets at recent highs, etc.
4. Opening a trade
- Entry procedure: everything as usual — market or limit.
- Managing position size: once again, remember the 1–2% risk.
5. Position management and exit
- Monitoring changes in momentum: pay special attention to any signs of a reversal in the Vumanchu waves, especially when the wave crosses the zero line.
- Moving the trade to breakeven: as the price moves, it is necessary to tighten the stop and move it to breakeven.
Sincerely,
Ivan Rusin