
VSA: Test of Supply and Demand

Hello, friends! We continue studying the Forex trading methodology using volume analysis, also known as VSA.
This time we will talk about a formation called Testing or simply a Test. The essence is that market makers, before starting/continuing a campaign of buying / selling, often "test the waters." Namely: they create false moves in order to identify the presence of strong sellers / buyers capable of interfering with them. And if there are none, the big players of the currency market begin their "dirty work." How to recognize such moments, and how to profit from them, is what we will find out in today's lesson.
Introduction

Before we begin, I would like to recall one story from Edwin Lefevre's book called "Reminiscences of a Stock Operator." It tells the story of an old and experienced trader. He had his own office and assistants. One day one of his people runs into the office and says that the shares of a certain company are being bought in large quantities. Some good news and indicators have come out on it and basically he is shouting that they need to buy before it is too late. The trade is a sure thing.
The old trader says that this is good and turns to his secretary: "Sell so many shares of this company." The assistant who told him the positive news shouts: "How can that be? We should be buying!" And he replies: "No, we're selling." The secretary carried out the instruction and sold a few shares. And the trader sits and watches how the market will react. The market does not go down. "Let's sell some more" said the old trader. The secretary sells the shares again, and the market still does not go down. The rise continues.
Then the trader says: "Well then, excellent! And now let's start buying!"
What is happening in this story? The trader tested the market to see how quickly it would absorb his selling. Whether there was demand for these shares and whether they were really being bought up quickly and in large volumes. And this trader also tested the market for the presence of any large sellers in it, who, seeing his sales, could also start selling and create obstacles to the rise. He tested the market and, seeing that the shares really were being bought up, began buying them.
The same thing happens now in the stock market and in the Forex market. The only difference is that in the Forex market we trade in both directions, while in the stock market buying predominantly prevails. But stocks are an entirely different story, so we are discussing Forex.
What is a Test?

Let's move on to the definition:
A Test within VSA is a movement caused by market makers in order to identify the presence in the market of demand/supply that may interfere with their campaign of selling or buying.
Suppose market makers want to buy up. They push the price down and watch: are there a large number of sellers whom they are trying to lure with this false movement. And if there are no sellers, they can begin some large-scale buying campaign. Below we will analyze this on charts, so you will understand everything.
A successful test, that is, a test after which movement begins in the direction of the market maker's buying or selling campaign, is characterized by low volume and a subsequent rebound of price in the opposite direction. We are looking for a false movement on low volume, and then in the opposite direction. After we receive confirmation that this is a test, we will be able to enter the market and make a profit.
Let's look at it on a chart to make it clearer.
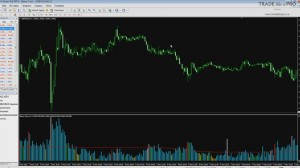
This is not the prettiest chart, but it is needed so that the examples are more practical. The chart shows a downward trend.
We see that after it has clearly formed, starting from this point, the question arises whether it will continue further?
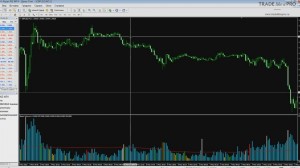
No one knows this. Market makers do not know this either, and they want to find out whether it makes sense to continue selling. Maybe the market will want to reverse upward and this will bring them a loss.
And approximately right here, they begin a small buying campaign:
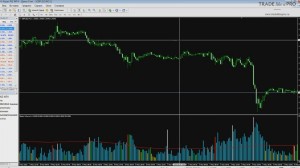
Simply put, they want to push the market upward in order to see whether there is some large number of sellers who will gladly accept this impulse and continue the upward movement.
If that happens, then accordingly market makers should not open any large number of sell positions in such a case, and it is best for them to start buying together with the crowd. They check whether there are those willing to buy and give a small impulse:
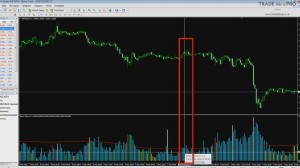
The level that had been formed earlier was deliberately broken in order to activate the orders of those who had placed limit orders and to show that here it is, an upward impulse, come on guys, buy if you really have such a desire. This is testing for the presence of demand in the market.
There were no people willing to buy, and we saw the subsequent candles go downward:
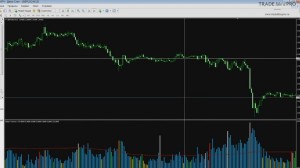
Since the buying volume was small, we conclude that this was testing, and not some emerging upward movement. Next, we see confirmation of our theory in the form of candles directed downward. We know for sure that this is testing and it was entirely possible to start selling. The most important thing is to understand the essence of this setup. Market makers check for the presence in the market of a force capable of opposing them. If there is no such force, then they start moving in the direction they intended.
How to Enter the Market?

But in order for us to consider this setup as an opportunity for entry, there must be strength in the market. If we are ultimately going to buy. Or weakness if we are ultimately going to sell.
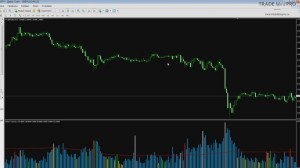
There was a clear downward trend on the chart. Weakness was observed here in the background, so it was quite possible to enter sell positions based on this setup.
Let us look at one more example on M15:
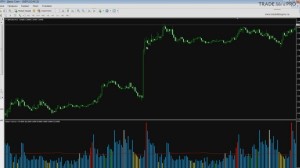
We observe a strong surge, so we can assume that the trend is heading upward. But will it continue further?
After the horizontal movement on the chart, this was unclear:
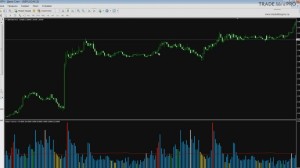
The market could quite possibly have collapsed, because it was creating a double top. Therefore the question arises: Is there any point for market makers to continue buying, or is it not worth it?
And they conduct a test, a false movement downward:
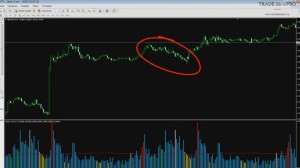
It looks like a correction in an upward trend, but note that we have small volume present:
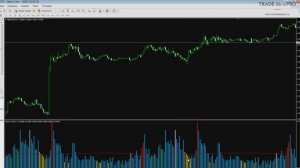
The end of the correction is realized with low volume, and it continues to fall. And after that, an upward candle appears. I note that the candle should be of normal size in order to enter the market. If the candle is small, then it is better to wait and see how the chart behaves in order to enter the market later.
As in all VSA setups, we look at effort and result. If there is no result, then it means something is wrong here. And this is not what we originally assumed. After we receive confirmation, we can enter the market. We place the stop loss below this valley peak and enter buys. Let us once again examine what happened here. There was strength in the background. The trend was directed upward. And then there was calm. Next, market makers drew this testing for us in order to find out whether there were those in the market willing to sell.
For this they drove the price a little downward:
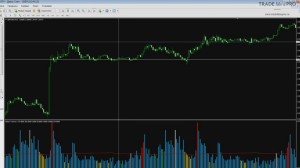
They drove it beyond the level that had previously been formed by local minimum points:
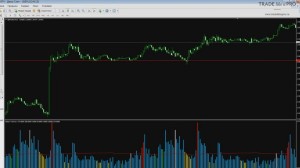
The market makers' task is to show those willing to sell that the price has broken the level and thereby stimulate them to sell. If those willing to sell begin to participate actively in trading, then the market makers understand that selling now will be unprofitable.
Testing in an uptrend is characterized by a break of previous local lows. And only after we have broken some significant line can we begin to consider entering the market, realizing that this definitely was a test and not just some candle going the wrong way.
After we break the level and a candle forms in the opposite direction, small volume prevails:
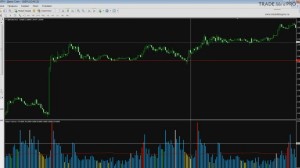
On this small break of the level, we can consider an entry.
What is worth noting?
If you are in doubt whether this is a test or something else, then it is best not to enter at all. Because identifying a test requires a certain skill and experience. If at the moment you do not see or are guessing what is happening on the chart, then it is better to ignore it and see what happens next. You will always have time to enter the market. It is not going anywhere from you.
In addition, when considering buys, there must necessarily be strength in the background. This may be an uptrend or prerequisites for it. Or a downtrend, or prerequisites for a move downward. Moreover, the end of a correction, if it is some large correction, may be precisely on large volume. But then we will already have a buying/selling climax.
We, however, look at small spikes that nevertheless try to attract the attention of buyers or sellers, usually by breaking levels. And in this way market makers check whether there is resistance in the market to their accumulation or selling campaigns.
Here is another good example:
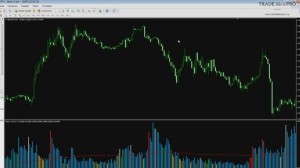
Here we had a triple top. We see a move downward, but it is unclear whether it will continue downward or whether the market will reverse and go upward:
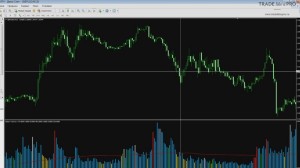
Again we see that the market makers push the price up a little and this kind of pin bar takes shape:
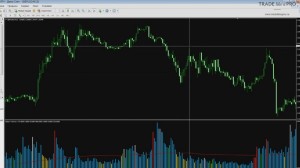
It breaks the previous level formed by a local minimum:
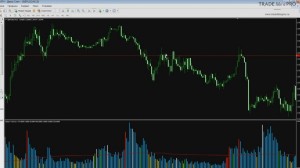
The level is broken. According to price action, we have an entry ready on the pin bar for trend continuation. And at the same time, this was testing by the market makers. We can determine this from the below-average volume:
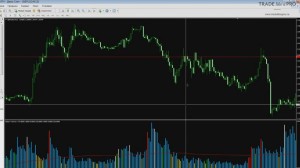
And then a reversal occurs:
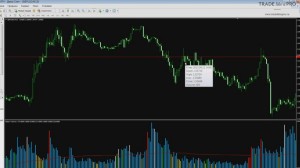
Here the candle might have seemed too small, so it was possible to wait for a later candle to enter. For example, one could have waited for 2 more candles downward:
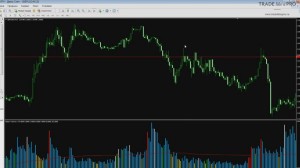
The stop loss would be slightly above the tail of this candle:
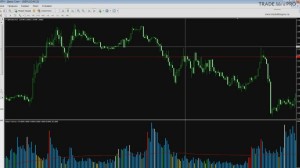
We have separate lessons on how to exit such setups. There are many exit options each time. Choose whichever is convenient for you. You can exit at the nearest support or resistance level, or simply multiply the stop loss by two.
If, for example, we do this on this candle, then we place the stop loss above the high point:
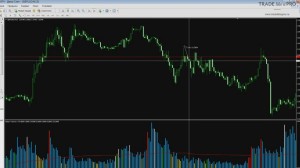
After it, we really could confirm for ourselves that this was a test. The candle broke the level and gave a signal that it was time for everyone willing to buy in. There were no willing buyers, and the market makers continued their selling program.
You can measure the stop loss, multiply it by two, and exit the market somewhere around here:
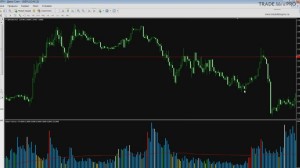
We could have waited and made a little more profit. In fact, there are many exit options. We covered them in a separate lesson from the price action series called: "Exit Strategies."
Summary

What do market makers do? They try to check whether there are buyers in the market who want to buy in large volumes. If they want to sell, then buyers with big money will later get in their way. Buyers may start buying a little lower as soon as market makers enter the market, and they will have to fight them, which means a loss of money and time. Market makers do not need that.
Therefore, before starting a selling or buying campaign, they check whether there is an opposing side in the market. And so, through false spikes, usually accompanied by a break of some visible level, they try to create in buyers the desire to buy. And if there are no such buyers, then market makers begin to sell.
This test movement is characterized by low volume. And in order to enter in the opposite direction, alongside the market makers against the false move, we should wait for confirmation. That is, for one large candle or several medium candles in the direction of the real move, where, as we assume, the market will go. We place the stop loss slightly below or slightly above the nearest local maximum or minimum. As a rule, this is the shadow of the candle that finished the test.
As for targets, define them as you wish. You can multiply by two, or you can enter with a target at the nearest level. Also, you can close the position in parts or set certain take profits in points if you know that the price usually moves 15 points on impulse. It all depends on the pair and the timeframe. You determine the targets yourself.
I hope that I was able to convey to you the essence of the "Test" setup and explain how market makers test the market before continuing any of their selling or buying campaigns.
Test (within the VSA framework) is a movement caused by market makers in order to identify the presence in the market of demand / supply that may interfere with their selling / buying campaign.
A successful test is characterized by low volume and a subsequent price rebound in the opposite direction.
P.S. For those who have just joined us, I advise you to start by reviewing the previous VSA lessons:
- What Is VSA
- Volumes in Forex
- Buying / Selling Climax
- Accumulation and Distribution
- Up-thrust and Reverse Up-thrust
Best regards, Pavel
TradeLikeaPro.ru