
VSA: Buying / Selling Climax and How to Profit from It

Hello, dear readers of the forex blog tradelikeapro.ru. There is a common opinion that if the market reaches new highs, it means that the trend will continue. When quotes are at their peak, technical analysts will insist on a strong trend, the news will be positive, and everything will point to continued growth. But market makers use such moments, when everyone wants to buy, in order to get rid of their positions.
Fortunately, VSA methods allow us to determine when a similar situation occurs and take action: close trend positions and consider opening opposite orders. This is what we will talk about in today's video.
What is a buying/selling climax?

A buying / selling climax is an imbalance of supply and demand that leads to a market reversal.
If the market reaches new highs / lows (depending on the trend), volume is very high, a wide-spread candle in the direction of the trend closes in the middle or near the maximum values, and on the next candle we see a small spread and relatively high volume, then we are dealing with the end of the current trend wave.
It is worth closing existing positions in the direction of the trend and considering the possibility of opening opposite ones.
In words it may sound complicated, so let us consider this situation with an example:
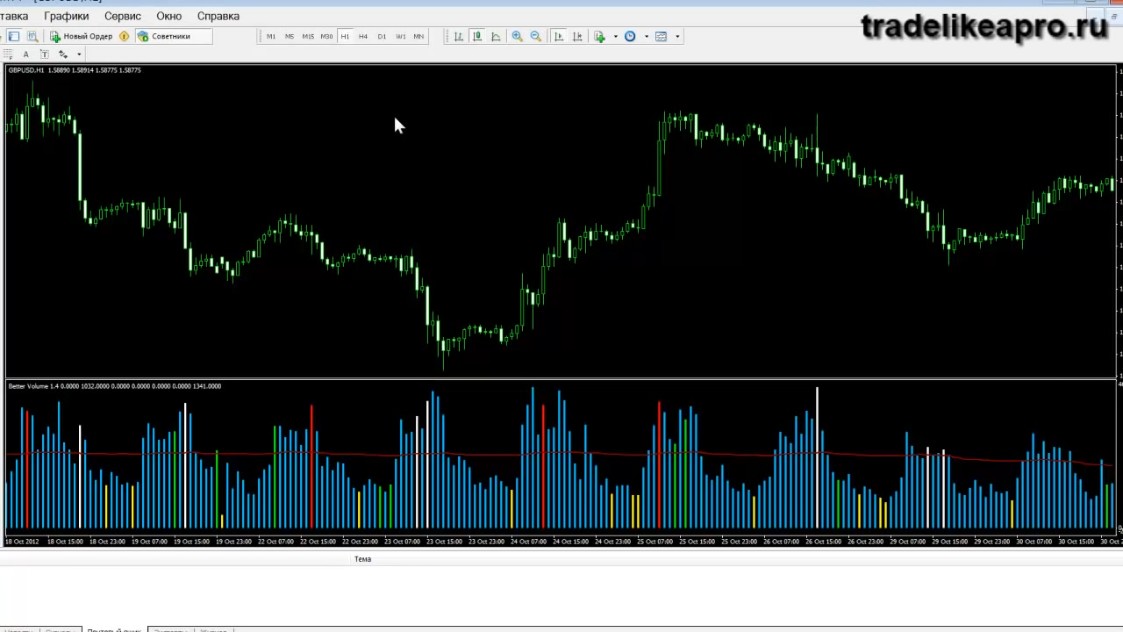
The hourly chart shows the GBPUSD currency pair.
Market makers, like other traders, seek to make money. When an uptrend is visible on the chart, these fellows buy in. And after they hold their positions, they need to exit the market to take their profit.
Since they open very large positions, they need to exit the market unnoticed. Because if they simply take and close their huge orders, the market will fall, and they will lose their profit.
What are they to do? To profit from rising prices, we need a bigger fool than us. This is called the "Greater Fool Theory." We need those who will buy at even higher prices than we once bought.
Therefore, market makers, having handed off their positions with the help of bigger fools, leave the market unnoticed, keeping the profit for themselves.
The funny thing is that the fools do not yet know that this will be the top of the trend. Therefore, when the market approaches new highs and technical analysts at the same time keep insisting on the continuation of the uptrend, market makers see this situation and sell their positions to them.
And they do it slowly and unnoticed.
Usually this looks like large candles that are accompanied by high volume on the chart:
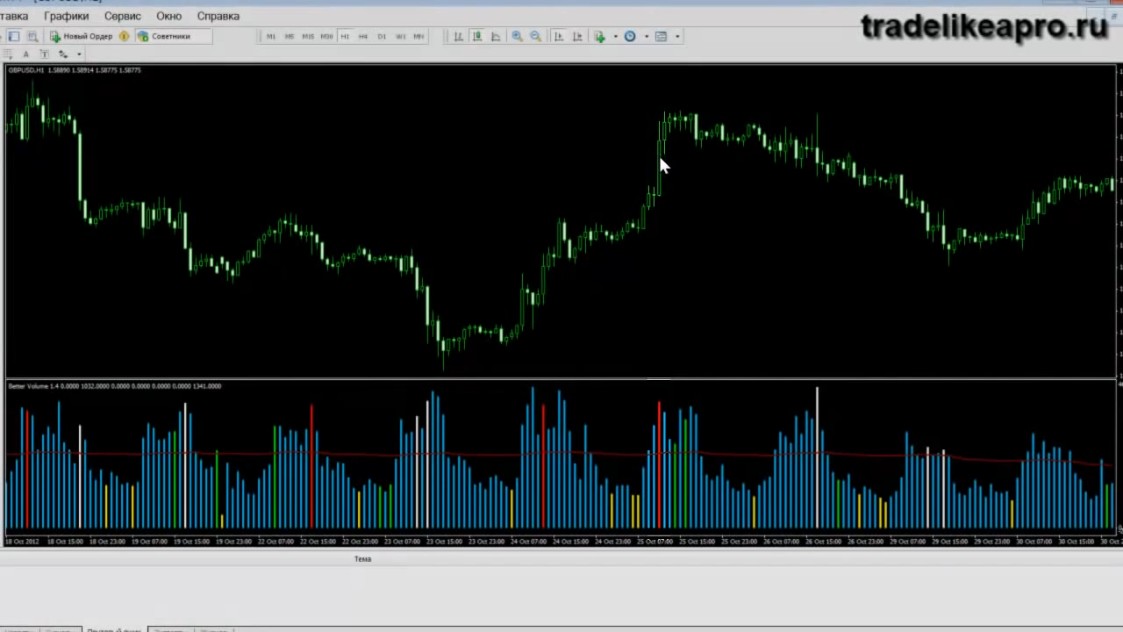 The Better Volume indicator highlights them in different colors. Red if it is an uptrend, and white if it is a downtrend.
After such large bars, we see confirmation in the form of small candles with high volume and a small spread.
This means the end of the current trend wave. We cannot know whether after a correction there will be a continuation of the trend. But we can say with confidence that the current trend wave has been exhausted. Therefore, if we had some open buy orders, it would be worth closing them. Exit the position and wait for new signals.
How can such price behavior be explained?

Let us imagine that everyone is buying, the news is positive, analysts say that everything will rise even higher. Technical indicators also show positive results. Inexperienced traders try to buy in and a large candle with a wide spread appears.
But for them to buy, someone is needed who will sell to them. And market makers will gladly sell to them. It is worth noting that during strong trends it also happens that market makers buy even more. And all because they are counting on a further continuation of the trend. As a result, there is a sharp ascent of the price upward.
Examples
Therefore, in order to determine a buying climax, we need confirmation. And we get confirmation in the form of candles with a small spread and high volume:
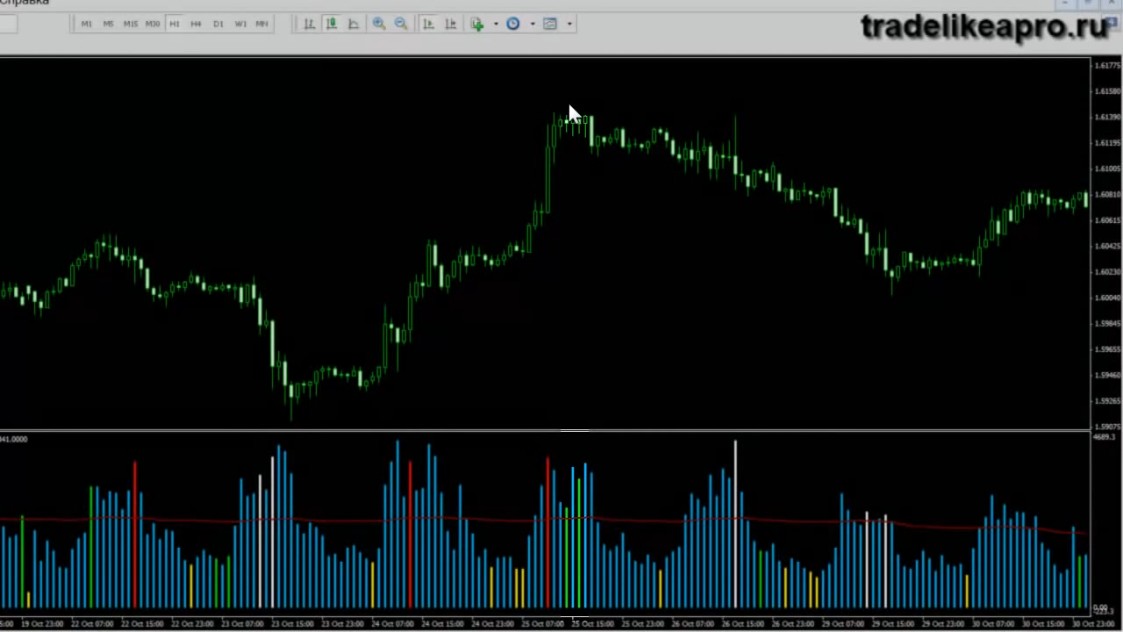
Let us consider the situation on the chart.
Since the spread is very low, there were no strong moves up and down. Supply and demand were mostly balanced. It turns out that everyone was buying, and there was an equivalent side that was selling. And vice versa. For the one who was selling, there was a side that was buying.
There was a transfer of assets from market makers to inexperienced traders. If it was an uptrend, then the market makers sold their positions to newcomers who decided to buy in.
If we observed a large candle on the chart with a high spread and a standout large volume, and after it a candle with a small spread and also high volume, then we can conclude that this is a buying or selling climax.
If this happens, then we close the position and leave the market.
Please note that a large candle with a wide spread and high volume must come after there has been some prolonged trend. If it appeared at the beginning of the trend, that does not mean that the market is now going to reverse sharply.
Most likely, this is the end of a correction or the beginning of a new trend. What interests us are candles that were preceded by a clearly pronounced trend.
In our case, we observed that the price was rising, and then a candle with a high spread and volume appeared, and a little later confirmation appeared in the form of a candle with a narrow spread and high volume:
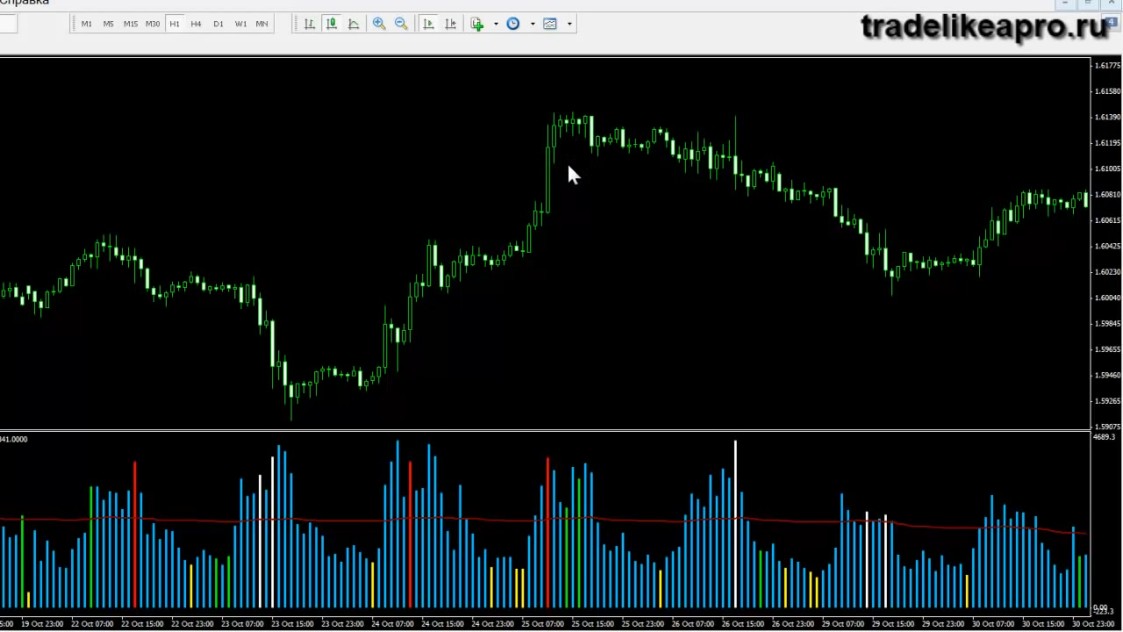
Here we clearly saw that there was a transfer of assets from market makers to inexperienced traders.
And since the big players exited the position and stopped buying, the market begins to move downward.
Therefore, it is worth leaving the market after receiving a signal in the form of candles with a large spread and volume.
Let us analyze a similar situation for selling:
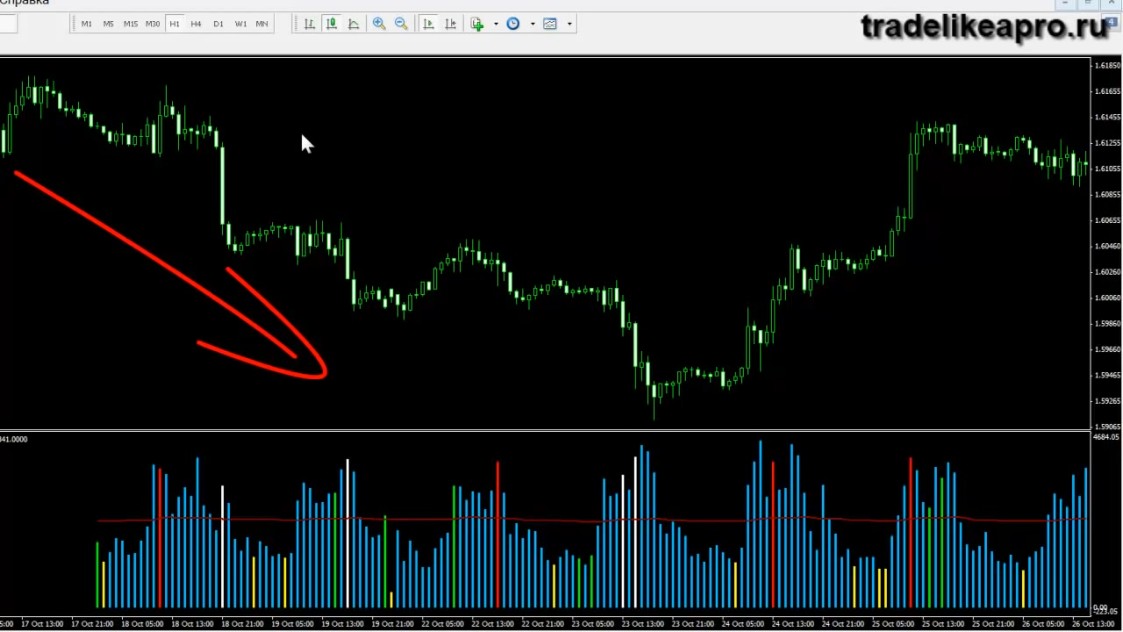
On the chart we see a prolonged downward movement, and then a candle with a wide spread and high volume appears.
After it, a candle with a narrow spread and large volume appears:
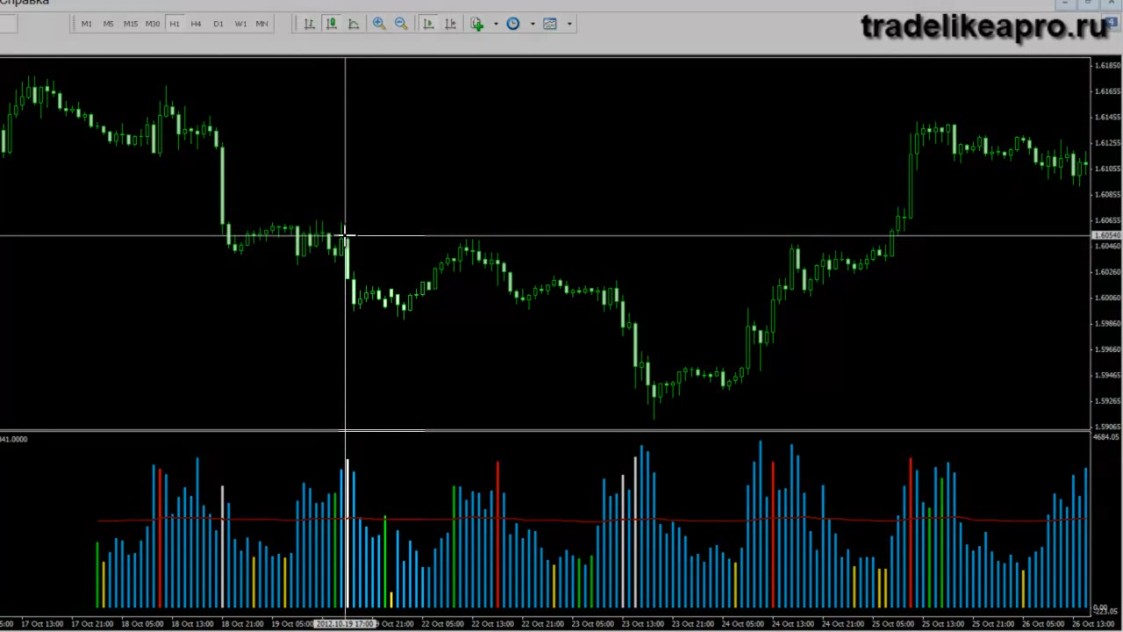 These candles show that the efforts toward selling did not produce a result.
Before we continue, let us take a closer look at what effort and result are.
This premise is used very actively in trading according to the VSA methodology. We watch what happened and what the result turned out to be. In the case of buying and selling climaxes, we watch for the appearance of a bar with a large spread and volume. If no result followed from it afterward, then we are dealing with the end of the current wave.
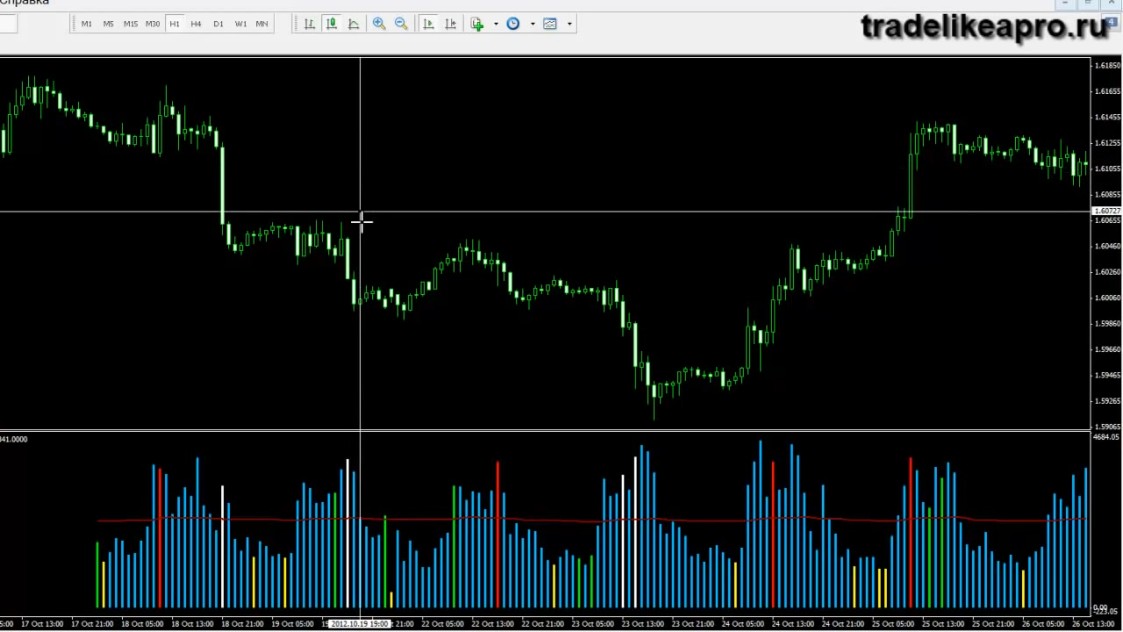
In our example, we can observe that we had a wide spread, high volume, but no further decline in price followed.
If the market makers had been selling, then it would have been visible on the chart that the price was moving downward. But in our case that did not happen, while bars with medium volume appeared instead.
A buying or selling climax is indicated by the presence of a trend. There must be some standout movement upward or downward.
When this movement reaches new highs or lows, and at the same time a candle with a wide spread and high volume appears, and after some time confirmation appears in the form of a candle with a narrow spread and high volume, then we know that this is a selling or buying climax.
Consequently, we should close trend positions and consider opening positions in the opposite direction.
I think everything is clear with closing positions.
What should we do about opening positions in the opposite direction? In order to extract as much profit from the market as possible.
The thing is that the market does not always reverse instantly. Very often after a buying or selling climax, by inertia it can keep moving in the direction of the trend for some time:
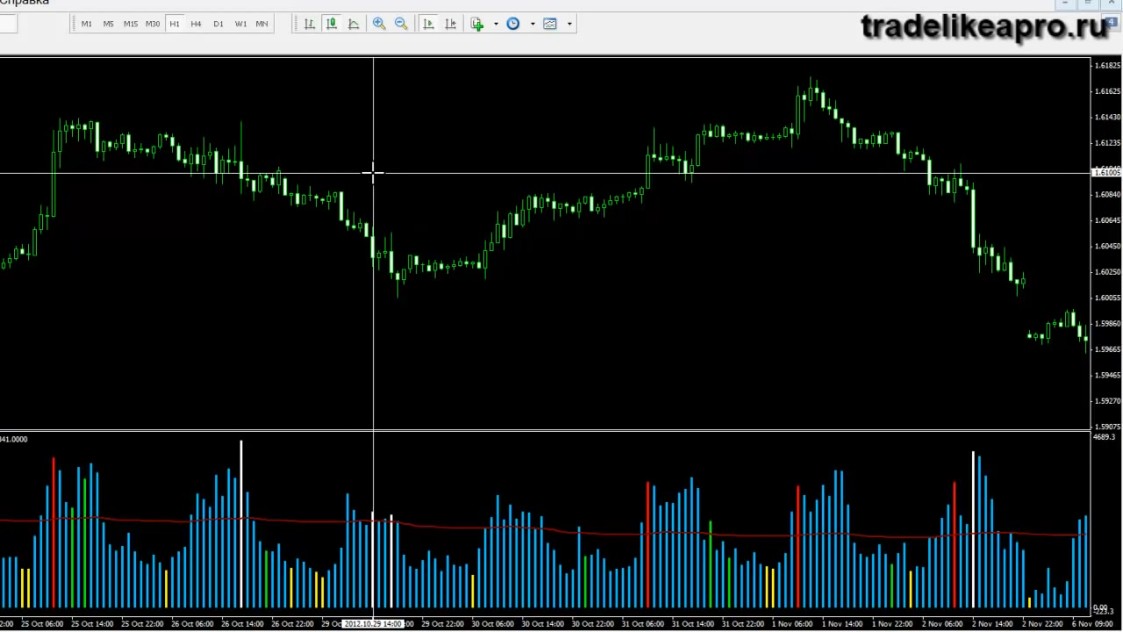
In the example above, we can observe that a candle with high volume appeared, then several candles with a narrow spread and high volume. It would seem that you should close your position and be done with it. But the price still moved downward for several more candles.
If we had opened a buy position with short stops, then our position would simply have been stopped out.
What should we focus on when considering the possibility of opening opposite positions?
You should focus on price behavior in the past and present. Namely, on support / resistance levels.
In our example, there is a level that the price broke through:
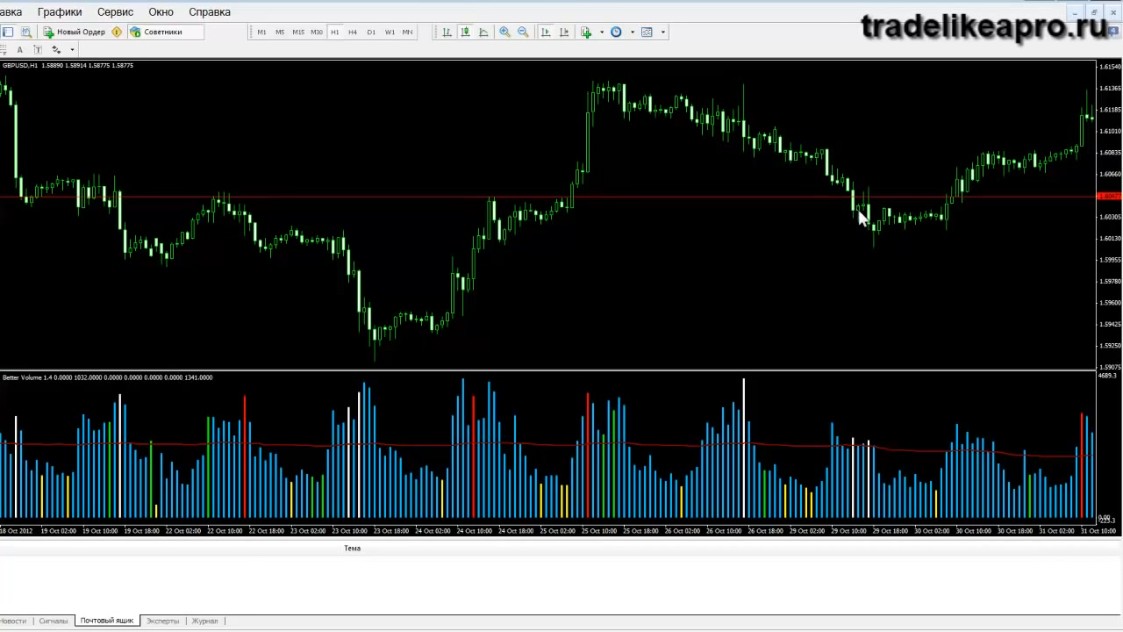
We can see that this level was broken downward, and accordingly it would be foolish to buy right now.
After the price returned and broke the level upward, it would have been possible to place a buy order.
Thus, when considering the possibility of opening opposite positions, we should also pay attention to support and resistance levels.
That is, where the price is after the buying or selling climax relative to the nearest levels.
This can also be noted for our first example:
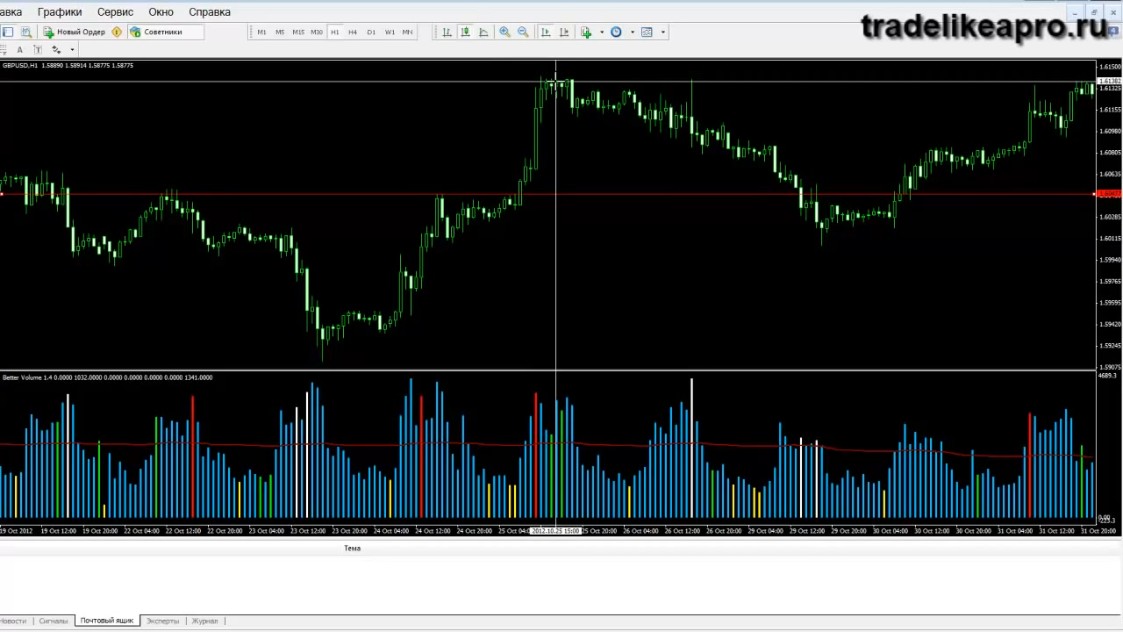
We found a buying climax. We exited the position and now want to sell.
To do this, we need to look at where the nearest support / resistance level is. And where the price is relative to this level.
If you use a volume indicator from the futures market to determine volumes, then everything is exactly the same there. You will simply need to determine the relative size of the volumes by eye.
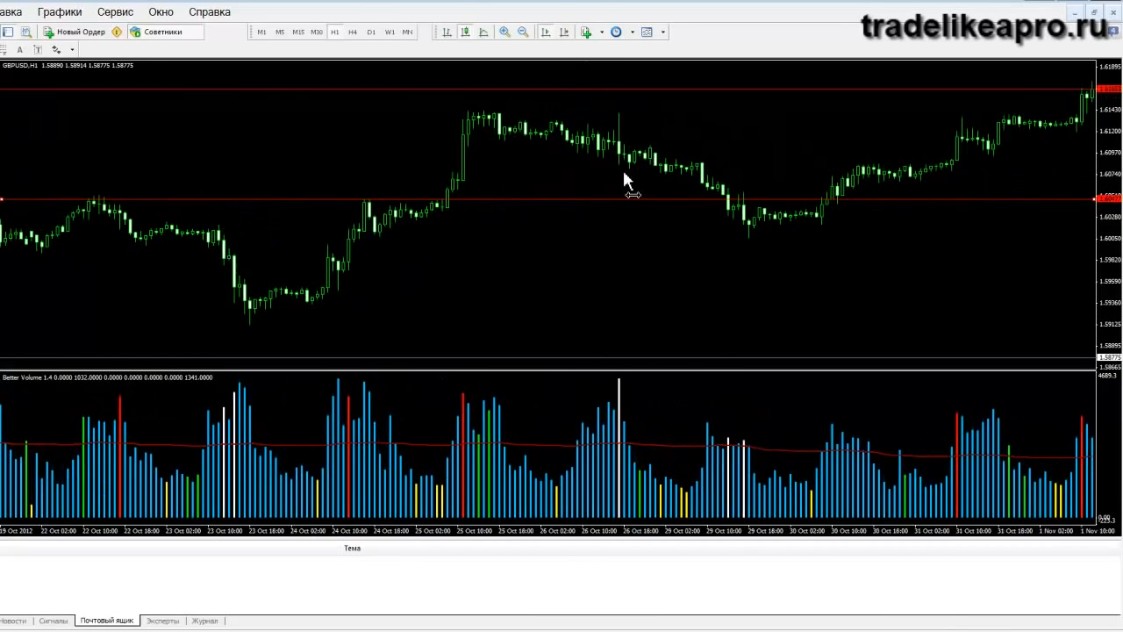
We mark the support level and see that the price fell just a little short of it:
If we open a sell position, then we will need to place a stop loss slightly above this level:
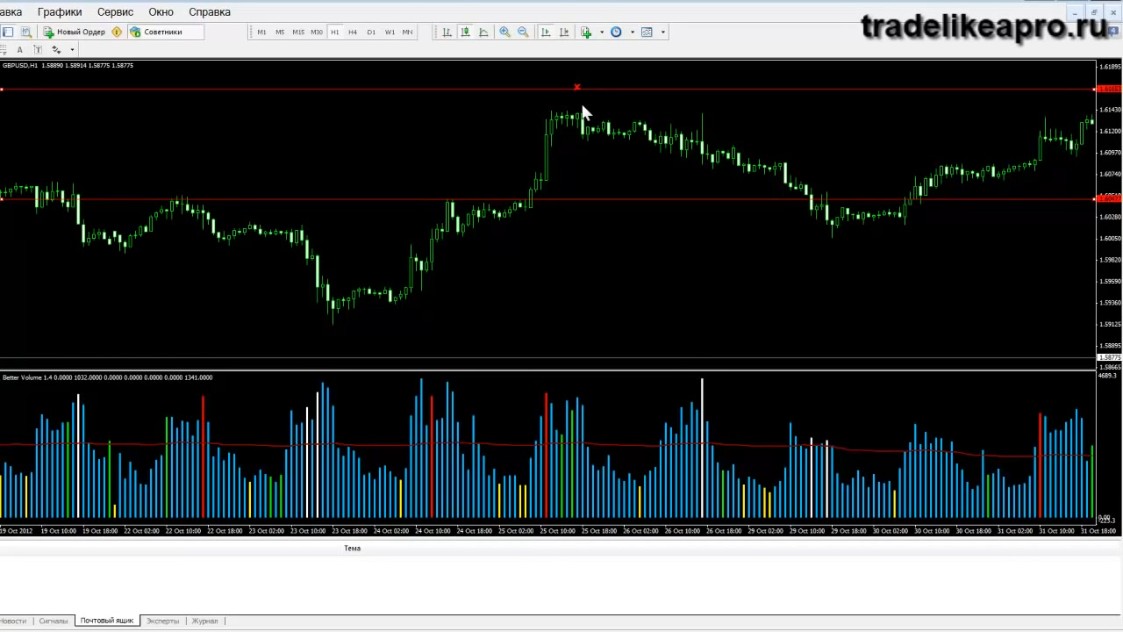
As can be observed on the chart, later the price fluctuated, but began its movement downward.
It would have been necessary to exit this trade at the next support / resistance level:
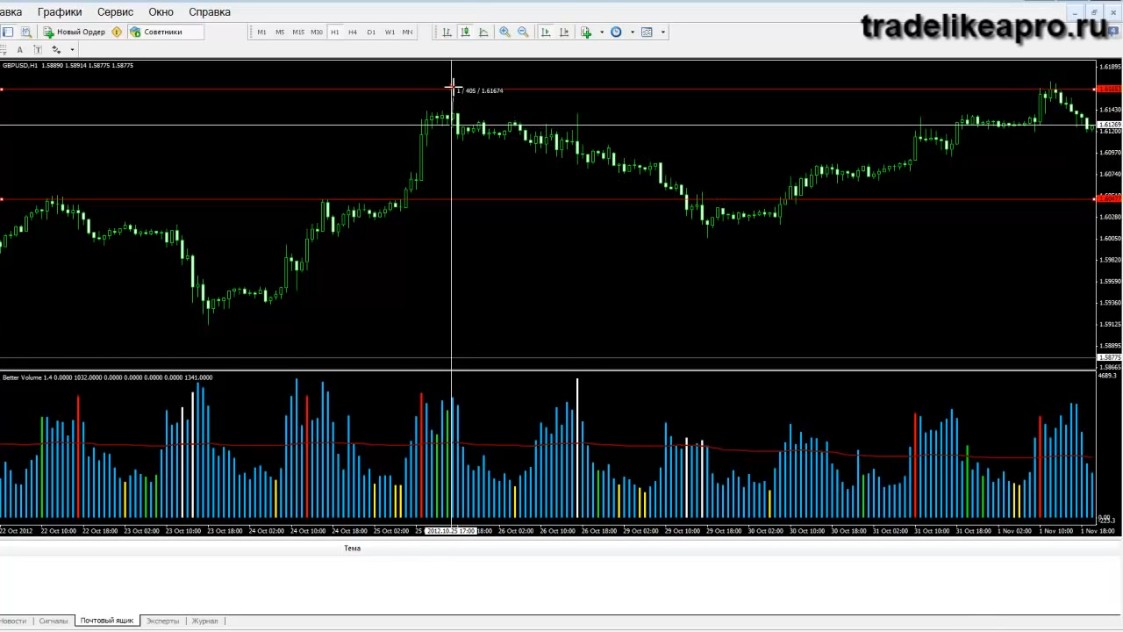
As a result, we could have earned about 80 points. And the stop loss would have been 40 points.
After you have identified a buying or selling climax and want to open the opposite position, you need to look at where the nearest support and resistance levels are located.
As you remember, price tends to bounce off levels, and if price has broken through a level, it will not be so easy for it to return. And therefore, until it has returned, taking any action is risky.
Let's look at one more example:
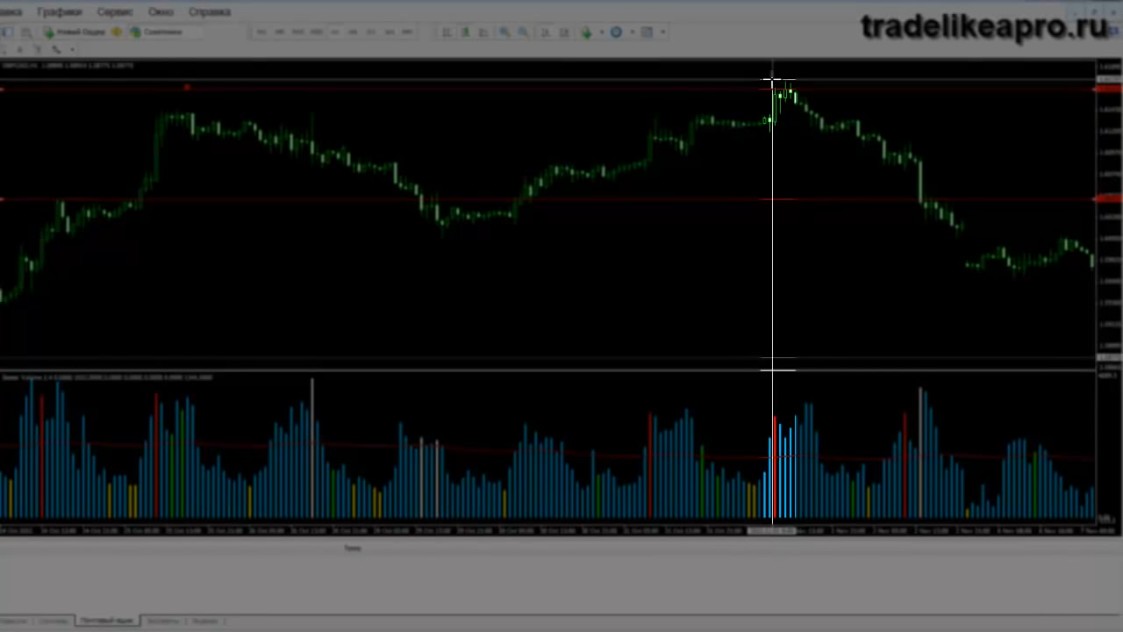
On it we see that a buying climax is taking place. If we had any buy positions, then we close them.
Now we are looking for an opportunity to enter the market profitably in the opposite direction and sell.
We look at the nearest support/resistance level. Price hit it and bounced off, heading in the opposite direction. If it had broken through it at the moment when the buying climax was formed, then we would not have opened sells. Because that would have been risky.
And since price bounced off this level, then we can consider sells.
We would place the stop loss slightly above the level, and the target at the nearest support/resistance level:
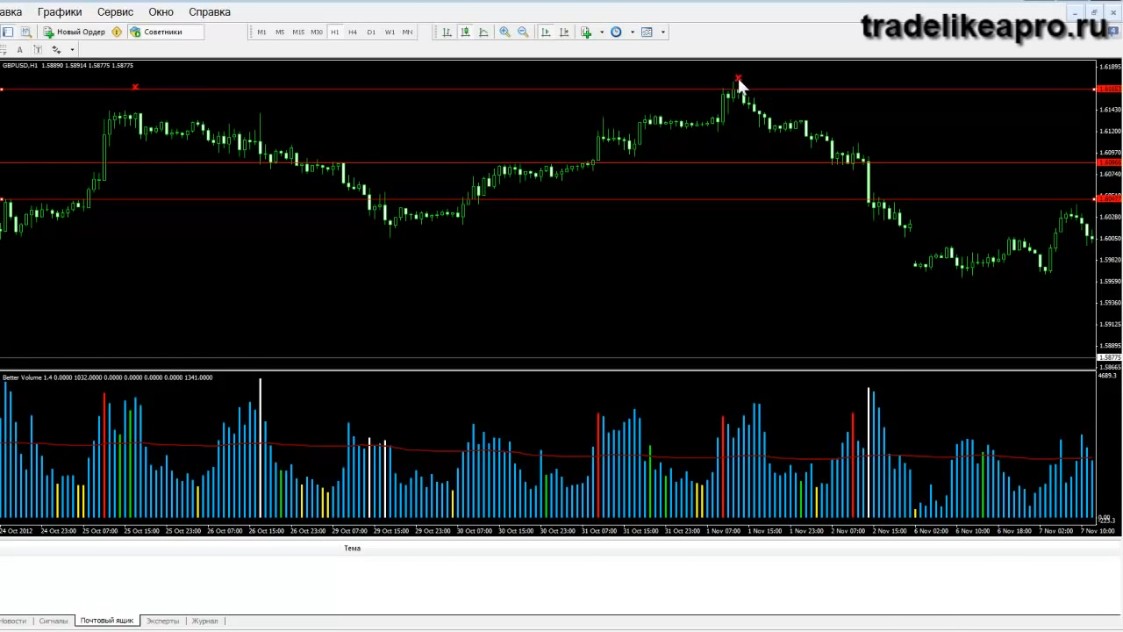
The stop loss would have been approximately 25 points, and the possible profit would have been either 66 points or 100 points:
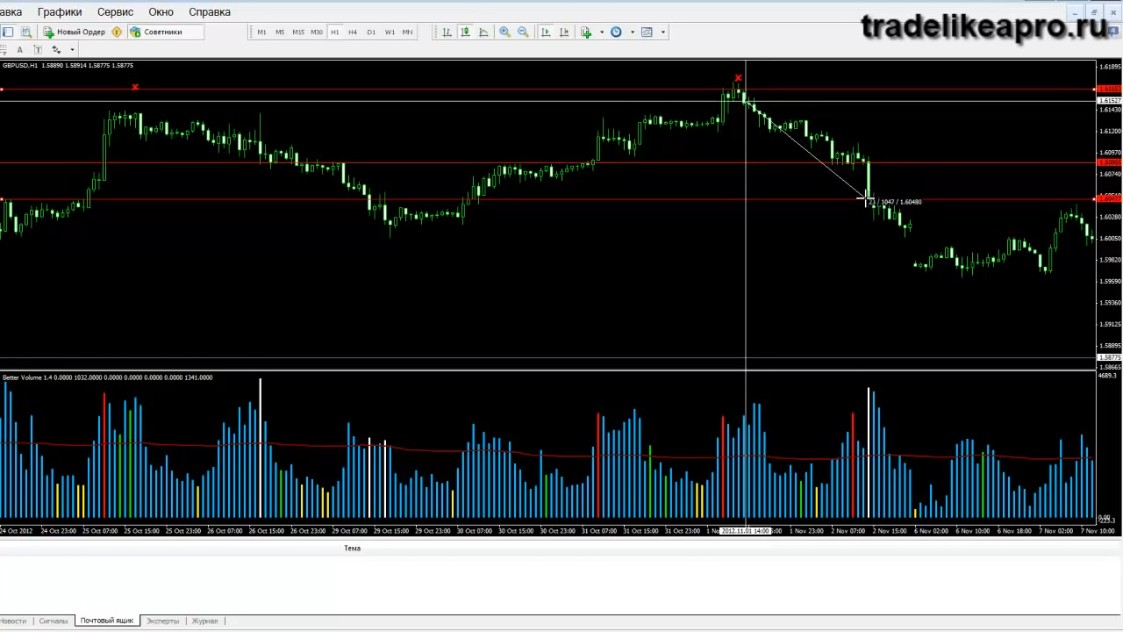
Of course, it would have been possible to try to take a more distant level, but that would have been risky. It is unknown what would have happened after the current wave, a correction or a market reversal.
Pay attention to this. Let's imagine that we found a selling climax and now want to open the opposite position. But at the same time we do not see any levels.
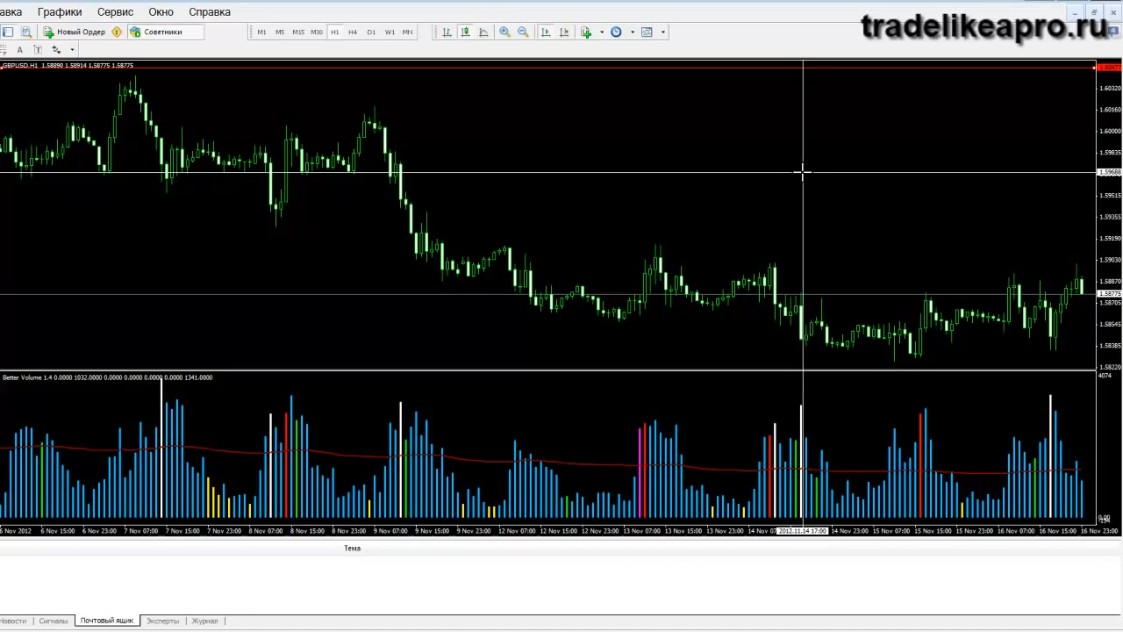
Remember: if you have no grounds to assume that price will go in the opposite direction, then in that case it is best not to open a position. If you had an open position, then it is best to close it and wait to see what will happen in the market next.
One more example for sells:
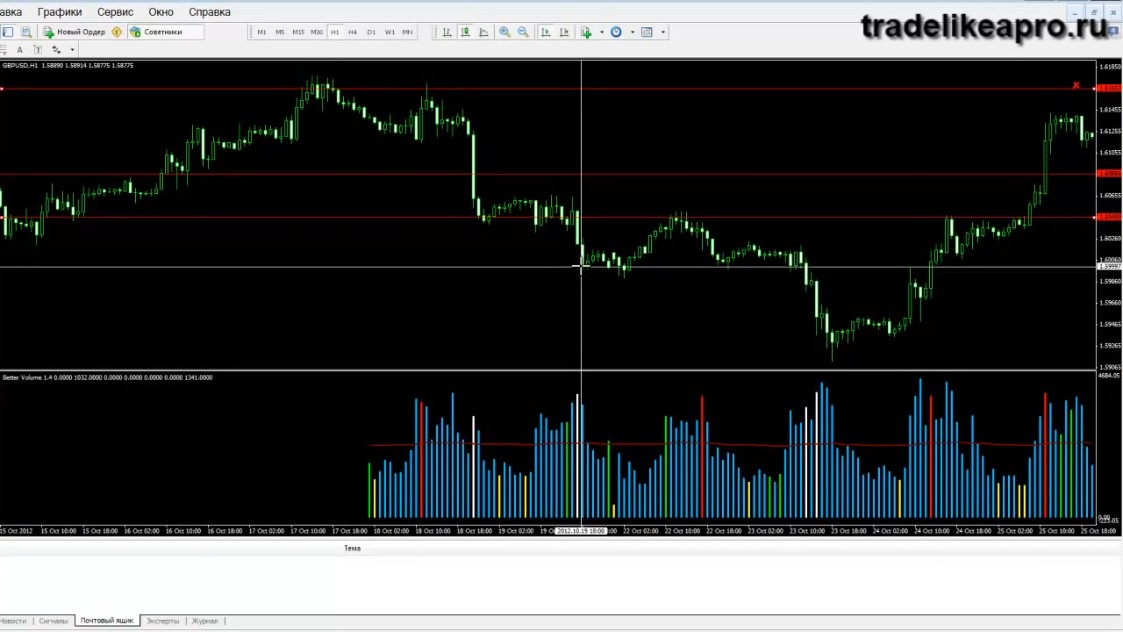
We found a climax, price appears with a wide spread and high volume after a prolonged downward movement. And then confirmation appears in the form of a candle with a narrow spread and high volume.
At this point we close the sell position, if we had one, and begin to consider opportunities for buys:
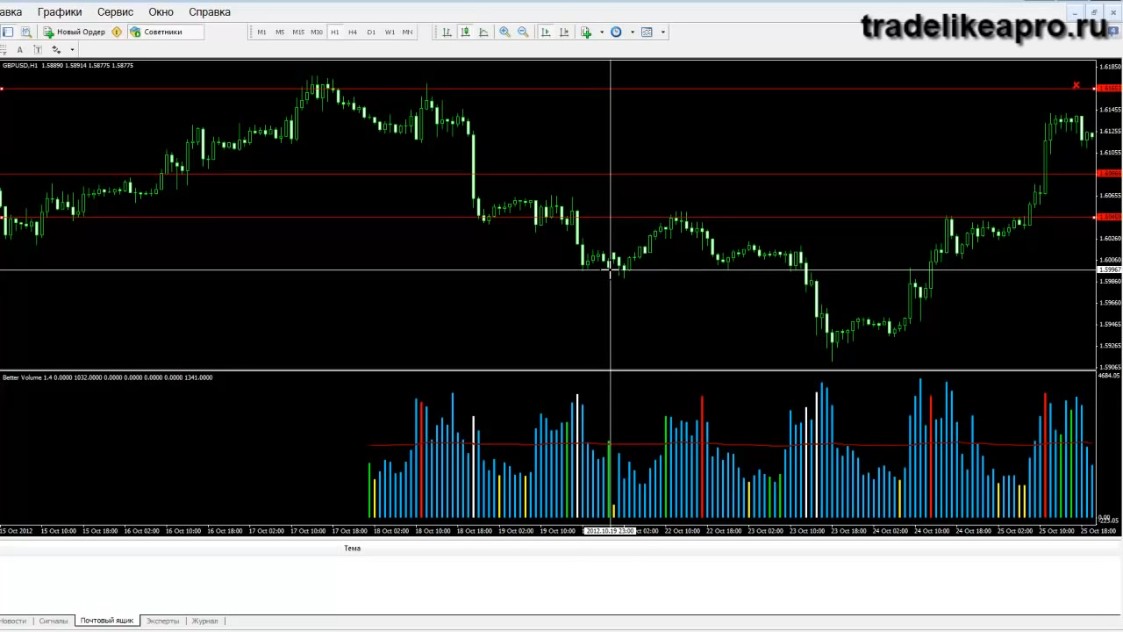
We look for the presence of a support level. In this place there is a level, and this means that there is an opportunity to consider a buy.
The stop loss would be slightly below the support level, and the target at the next resistance level:
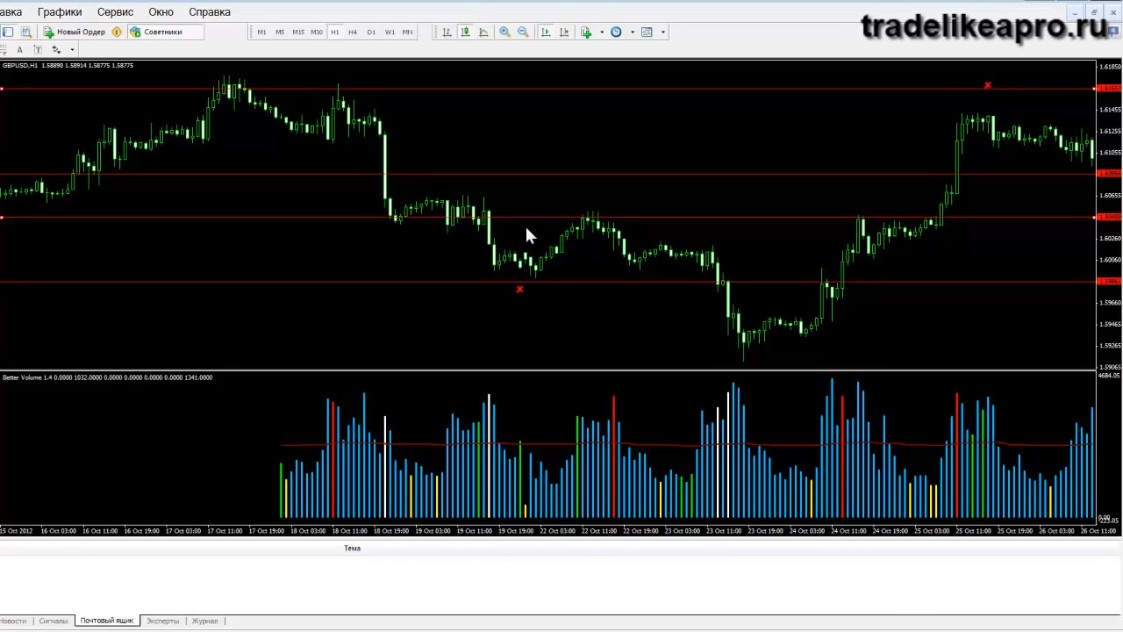
The stop loss would have been 22 points, and the target 40 points.
In conclusion, I want to repeat to you once again.
If you want to open a position after a selling or buying climax, then there must be support in the form of a support or resistance level. If there is no such support for a price bounce, then we do not open the position either.
If you have discovered a buying or selling climax and at the same time you have a position open with the trend, then it is best to close it. Exit the market together with the market makers.
Reference Material

1. If you do not know what VSA is, then be sure to watch the introductory video.
2. Download volume indicators for MT4 here.
3. The video mentions support/resistance levels. What they are and how to find them is covered in the video lesson Horizontal Levels.
Conclusion

The "Buying/Selling Climax" pattern is discussed in more detail in the video above. Also, by watching the video, you will learn about possible trading tactics when opening positions opposite to the finished trend.
This setup can be useful even to those who are not interested in VSA in principle. Because it makes it easy and highly accurate to determine reversal points in the market.