
VSA: Accumulation and Distribution or How the "Big Players" Enter the Market
 Greetings to all forex traders on the tradelikeapro.ru portal. We continue the topic of currency market analysis using volume, popularly called Volume Spread Analysis or simply VSA. This time we will talk about such concepts as Accumulation and Distribution. I hope this video will help you better understand how market makers enter and exit the market, as well as the fact that when trading on the forex market we should take the overall picture into account, not just the last few candles.
First of all, if you do not know what Volume Spread Analysis is, then before watching the video below, I advise you to familiarize yourself with the previous lessons on the topic of volume interpretation, otherwise much will be unclear to you:
- Introduction to VSA
- Volumes in Forex, where and how to view them
- VSA: Buying / Selling Climax
So, what are Accumulation and Distribution in the context of VSA?
Accumulation is the process of opening a large position by a market maker without a significant price change against the direction of this position. It occurs in several stages.
Distribution is the process of closing a large position by a market maker at a certain price level. Depending on the available liquidity, it occurs, like accumulation, in several stages.
Some terms are much more convenient to explain in video form with visual examples, so for a more detailed breakdown of the concepts of Accumulation and Distribution, I suggest watching the video lesson that follows immediately after this text.
What does it look like on the chart?

To begin with, let us look at the distribution process, which occurs as a classic picture of an uptrend. This will be the most obvious and understandable. It is worth considering that the accumulation process may not always occur in as neat a form as in the picture below:
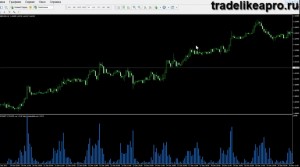
On it there is an uptrend, a pullback, accumulation. Again an uptrend, a pullback, accumulation, and once more an uptrend.
But such chart behavior may not always occur. There is a possibility that the chart will be uneven, will have horizontal movements, and will be in a flat.
For an example, let us consider another situation:
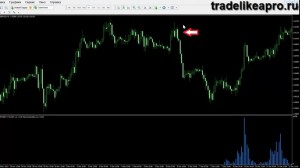
At the beginning we see a flat, then a horizontal movement. Next the market maker enters sales, a repeated horizontal movement occurs, and a flat appears again.
Then the market maker enters sales again, and we see that a downtrend has formed:
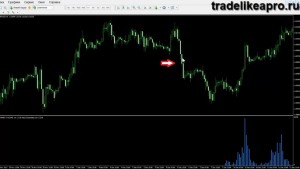
In fact, this is the process of accumulating buys, which began earlier.
In general, market maker patterns differ from one time frame to another. They are diverse, and because of this it is impossible to create a clear algorithm of actions and understand in advance how the market maker will behave.
We cannot climb into the heads of the people who work in large funds. We are only given the ability to look at the chart, analyze it, and draw our own conclusions.
It is worth remembering that a large position cannot be opened at once with a single order. This happens gradually. And if an uptrend is observed on the chart, then the accumulation process will take place during a price correction.
As you remember, market strength appears on bearish candles, and market weakness on bullish ones.
Accumulation for an uptrend does not always occur on bearish candles. It happens that the buying is too strong and occurs on bullish candles. This process does not always occur on candles opposite to the main movement. This is worth taking into account.
The most advantageous place for a market maker to enter an uptrend is a market correction.
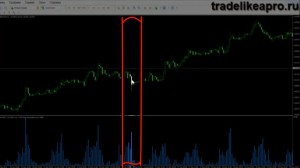
On the chart, we can clearly see that a downward movement occurred.
The candle in the middle, with its tail and increased volume, clearly shows that the market maker took advantage of the crowd's desire to sell after the previous local low was slightly broken:
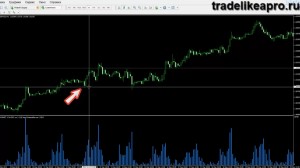
Many placed sell stop orders to sell below this level, and the market maker used this liquidity in order to buy in.
After this process, the chart went upward again.
We can also observe clear buying that absorbs selling:
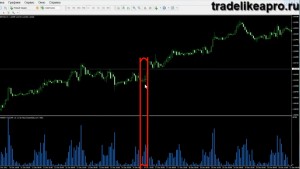
In the picture, you can see large volume on candles with a very narrow body. This means that sell orders are being absorbed by market makers.
After all the supply was removed from the market, an upward rise occurred. There were practically no sellers left, and the obstacle for the price disappeared. It was able to move upward freely.
Therefore, simply put, Accumulation is the process of opening a large position.
In the screenshots, we examined an example for purchases. For sales, everything would be the opposite.
In turn, distribution is the process of closing a position.
When a strong trend is present on the chart, many traders try to join it and take their profit.
Very often, one can observe a climax of buying and selling, when large candles appear and after them the trend ends:
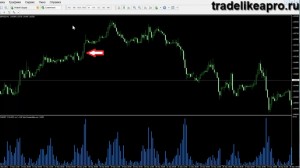
On the one hand, the candle is full-bodied and there is large volume. It seems that everyone is buying in. But in reality, the long position is being transferred to late traders who want to join the trend. At the same time, the trend itself is almost exhausted.
The climax of buying and selling can occur not only in one stage, when the market maker exits the market and has no positions left. It also happens that this process takes place gradually.
We can observe this in the form of bursts of activity in the direction of the completed trend. This is manipulation by market makers seeking to lure in new buyers or sellers who think that the trend will continue.
In turn, this allows them to exit their position.
For example, on the chart in the highlighted place, the long position was transferred to people who were late to the beginning of the trend:
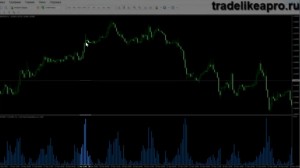
Next, we observe a flat with low activity, and then new purchases.
I note that these purchases may be caused by the market makers themselves, who slightly push the price upward. In this way, they provide a kind of bait. People see that the price is rising, begin to buy, and the positions of the market makers who are exiting the market and locking in their profit are transferred to them.
Let me remind you that exiting purchases means sales. When the market maker exits purchases, he sells.
Exiting sales means purchases. And therefore, if he closes the position with one large purchase at once without liquidity and without those willing to buy from him, he will open a large sale.
By closing his buy, he will perform an action equivalent to large sales. Thus the price will fall.
It is worth taking into account that if this happens, the market maker will lose profit. He is not interested in this, so he always waits for traders who are ready to buy this position from him. Or he creates the preconditions himself in order to attract them.
When the meaning of the concepts of Accumulation and Distribution settles in your memory, conducting VSA analysis will become much easier.
After studying the information given in the article, you will begin to understand that it is worth assessing not only the last few candles, but the entire situation as a whole. What is happening now, what market makers are doing, and what should be expected next. That is all for today. Good luck in trading and until we meet again.
Sincerely, Pavel Vlasov
TradeLikeaPro.ru