Volatility: Friend, Enemy, and the Main Indicator of Market Sentiment
One of the first concepts a beginning trader encounters is volatility. It shows how quickly and strongly the price of a financial instrument changes.
Many beginners think high volatility is an easy way to make money quickly. In practice, it is the opposite: sharp price fluctuations most often become the cause of losses.
If you understand how volatility works, you can not only find good entry points but also control risks better, preserving your capital.
What Volatility Is in Simple Terms
In academic finance (from the works of Eugene Fama to the research of Benoit Mandelbrot), volatility is defined as a statistical indicator that characterizes the tendency of price variability. In simple terms, it is the amplitude and frequency of price fluctuations per unit of time.
It is important to distinguish volatility from a simple trend. If a trend is the vector of movement (where the price is going), then volatility is the amplitude of fluctuations (how strongly the price "jumps" along the way).
In other words, volatility does not show the direction of movement, but it indicates the strength of fluctuations: the price can rise just as sharply as it can fall.
In his book The (Mis)Behavior of Markets, Mandelbrot proved that markets are characterized by volatility clustering: quiet periods are always replaced by surges. The market is never constantly stable; it switches between "low" and "high" turbulence regimes.
Volatility is influenced by many factors:
- publication of economic statistics;
- central bank decisions on interest rates;
- corporate reporting;
- political events;
- military conflicts;
- natural disasters;
- changes in supply and demand;
- actions of large institutional investors.
Types of Volatility
Traders often make the mistake of looking only at history. Professionals divide volatility into three key types, each of which requires its own approach to accounting for it.
Historical (Realized) Volatility
Historical volatility answers the question: "How much does the asset usually move?".
Historical volatility shows what the range of price movement was in the past (for example, over 10, 30, or 252 trading days). It is measured by the standard deviation from the average past move, i.e. it does not always correspond to the current state of affairs.
Historical volatility helps to:
- analyze an asset's behavior;
- assess risk;
- build trading systems.
Volatility can also be considered by time horizon: intraday; weekly; monthly; annual.
In fact, this is pure parametric statistics that helps reveal the dynamics of volatility changes, although the longer the period, the more smoothed the fluctuations become.
Expected (Implied) Volatility
This is a market forecast. It is extracted from option premiums using the Black-Scholes model. It is the most reliable indicator of fear or greed because it reflects the real bets of major players on the future price range.

It reflects the market's expectations about future price fluctuations.
- High implied volatility means that market participants expect strong moves.
- Low implied volatility indicates that the market expects calmer dynamics.
A classic example is the CBOE Volatility Index (VIX), known as the "fear barometer." When the VIX rises, put options become more expensive.
Event Volatility
A local spike caused by information noise. This is not statistics (although it does form extreme values in the distribution), but a reaction to triggers: the release of reports (Non-Farm Payrolls), a Fed rate decision, or a sudden tweet by Elon Musk.
How Volatility Is Measured
There are several popular ways to assess volatility.
Standard Deviation
This is one of the most common statistical indicators.
It shows how strongly the price deviates from the average value and is often used when calculating historical or current volatility for parametric trading.
ATR (Average True Range)
One of the most popular indicators among traders.
ATR shows the average range of price movement over a selected period. It is used to calculate stop losses, determine position size, and assess current market activity.
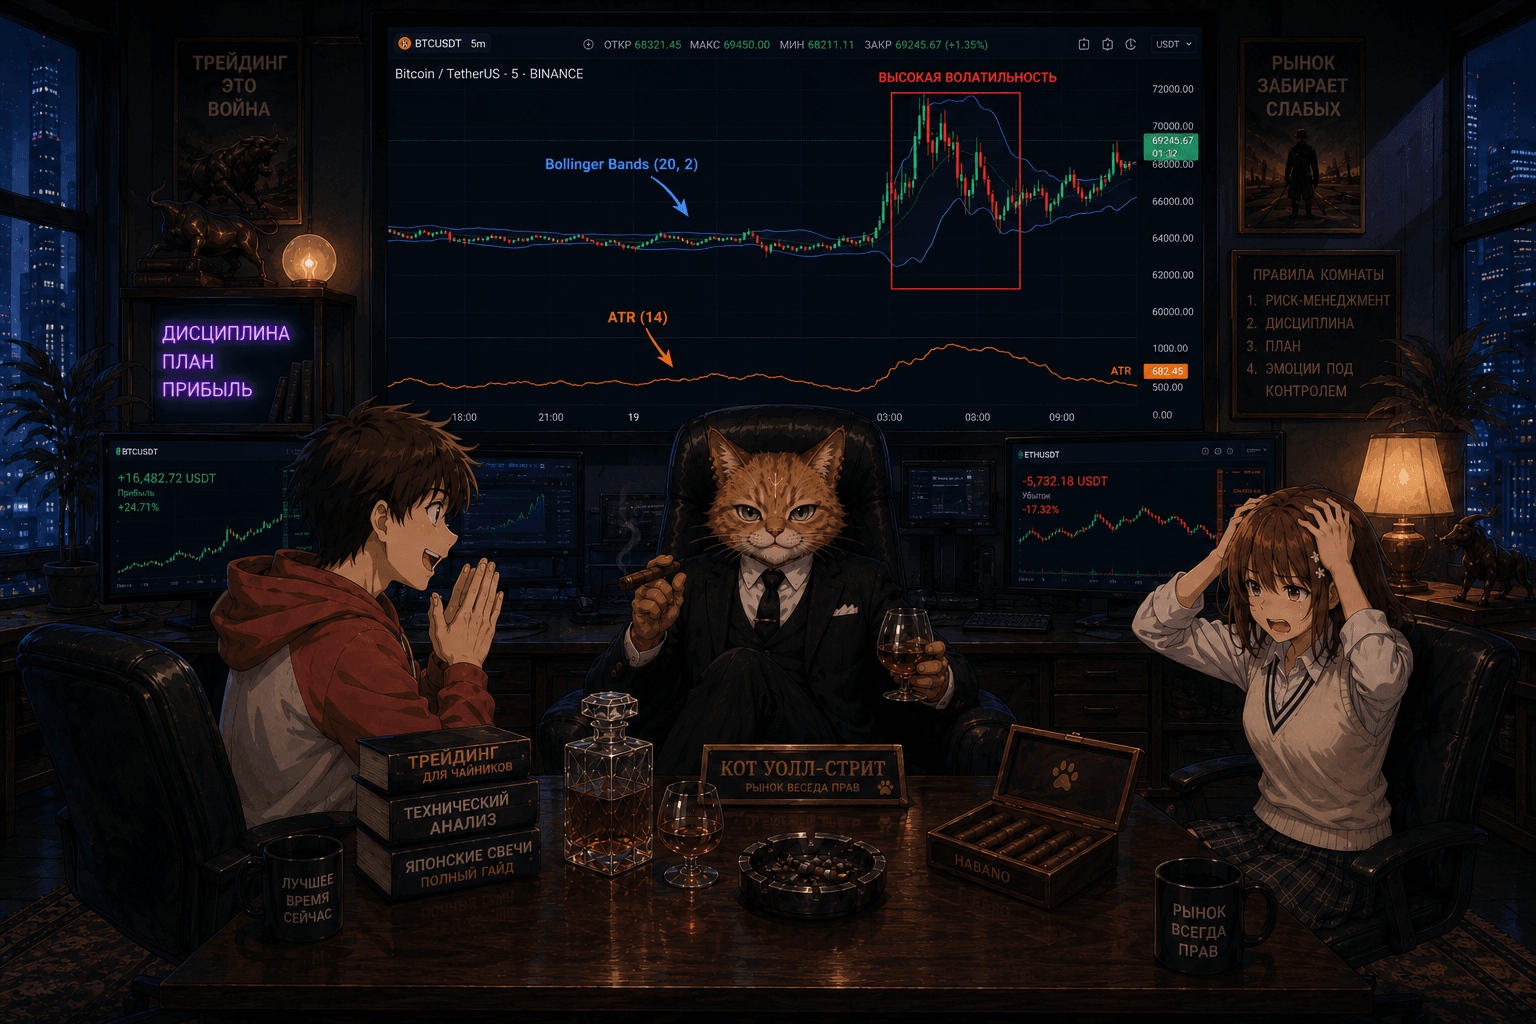
Bollinger Bands
This indicator automatically expands when volatility rises and narrows when the market becomes calmer.
It helps visually understand how actively the price is moving.
VIX Index
In the stock market, the index of expected volatility of the U.S. equity market is widely used.
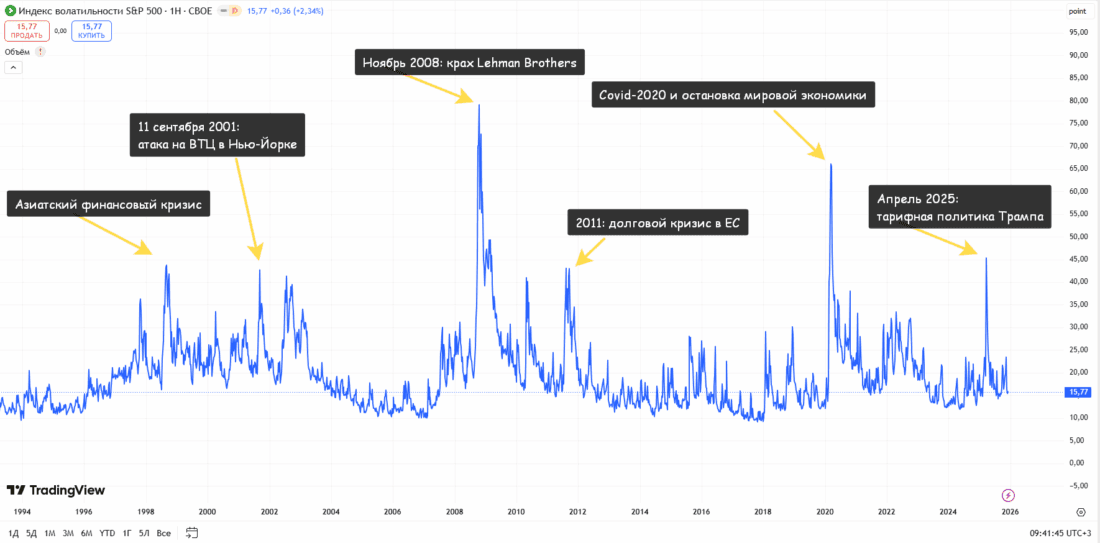
It is often called the "fear index" because a rising VIX usually accompanies periods of uncertainty and increased tension in the market.
For the crypto market, a similar in essence greed and fear index has been developed.
Modern Models for Accounting for Volatility
In addition to technical indicators, professional market participants also use mathematical models.
EWMA
This model gives greater weight to the latest observations.
It is often used in risk assessment systems because it responds better to fresh market changes.
ARCH and GARCH
These models take into account an important market feature: volatility clustering.
This means that periods of high variability are often followed by other periods of high variability, while calm market segments are followed by calm ones.
ARCH and GARCH are widely used in financial econometrics to forecast conditional volatility.
Realized Volatility
This model is based on high-frequency data and allows actual market variability to be measured more accurately.
It is especially useful where high assessment accuracy is important.
Implied Volatility Models
These models use information embedded in option prices to estimate the future volatility expected by the market.
Studies show that the effectiveness of such models depends on the forecasting horizon, asset type, and current market conditions.
Where to View Volatility in Forex and Cryptocurrencies
The basic and most significant measure for a retail trader is historical volatility.
TLAP has developed a simple and clear forex volatility indicator and cryptocurrency indicator. The main advantage of the TLAP volatility indicator is the ability to assess short-term (hourly) and long-term (daily and monthly) volatility in points over a specific time period in weeks.
Additionally, the TLAP cryptocurrency and forex volatility indicator shows monthly volatility for the previous year and for 10 years.
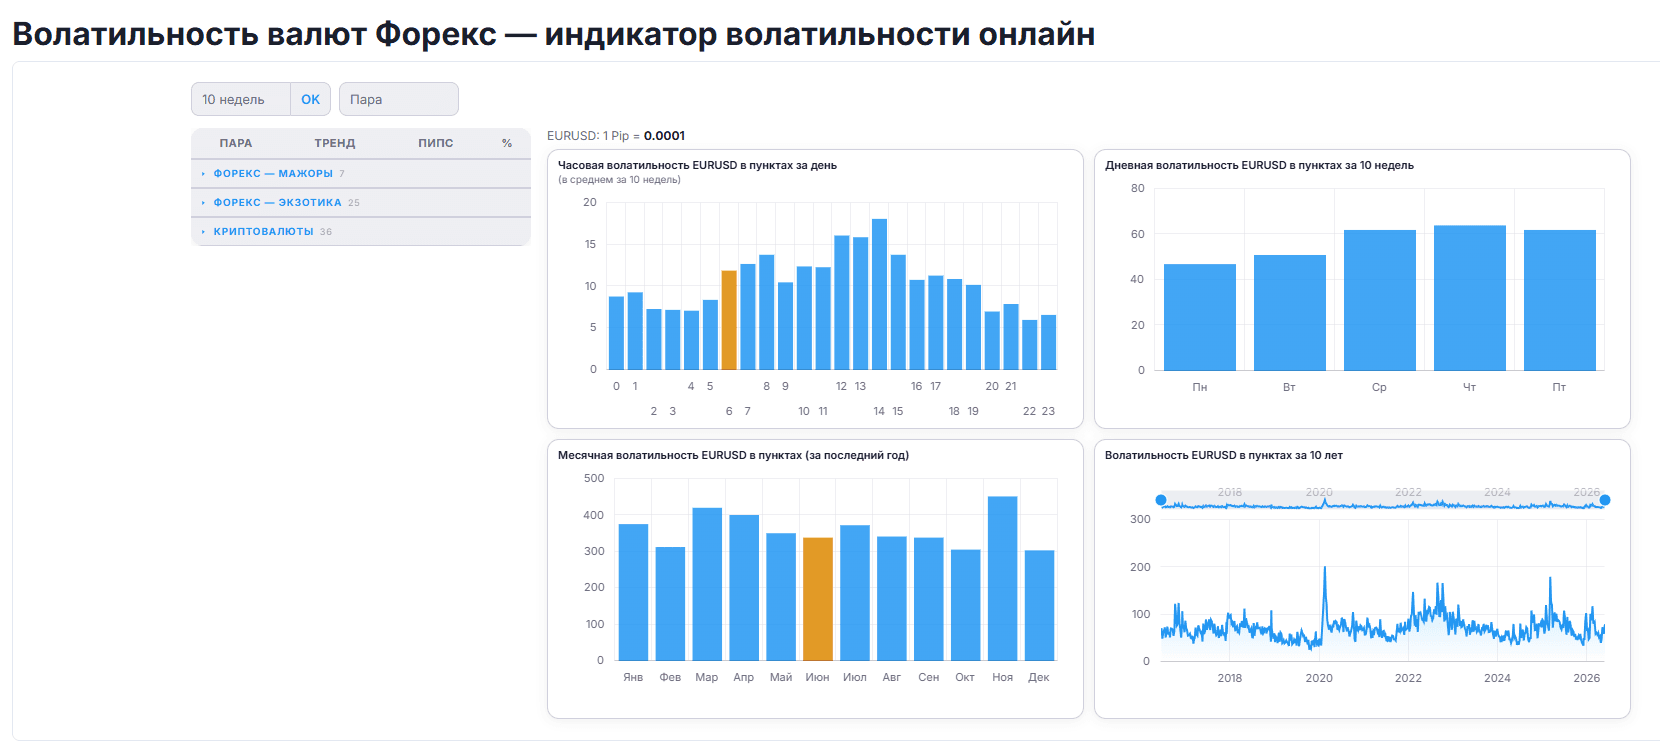
Everything is simple and clear. This is the minimum with which you can already test various strategies that take into account currency and cryptocurrency volatility.
The Impact of Volatility on Trading
Volatility directly affects trading style and risk level.
High volatility means more trading opportunities and faster achievement of profit targets, while at the same time carrying a higher risk of loss and the need to set wider stop losses.
Low volatility means fewer trading signals and weaker price movements, but also more predictable market behavior.
How to Profit from High Volatility
High volatility gives a trader more opportunities, but requires discipline and experience.
1. Short-Term Trading
Strong intraday moves make it possible to earn even over short time intervals, from a few minutes to several hours.
This approach is used by scalpers, day traders, and algorithmic strategies.
2. News Trading
After important economic data is released, the price can cover a large distance in a very short time.
Experienced traders prepare entry and exit scenarios in advance.
3. Trend Following
After a quiet period, the market often enters a phase of strong directional movement.
For position traders, this can be a good opportunity to enter a trend and hold the position longer than usual.
4. Options Trading
In the options market, you can build strategies that earn not only from the direction of price, but also from changes in expected volatility.
This is a more complex instrument, covered in more detail in other TLAP materials.
Risks of High Volatility
The trader's main task is not only to make money, but also to preserve capital. Without this, any strategy sooner or later stops working.
Nassim Taleb introduced the concept of the "Black Swan", a rare but catastrophic event. High volatility is the cradle of such events.
It is precisely during periods of strong moves that beginner traders most often lose money.

Among the main psychological reasons for losing part or all of a deposit, we highlight the following:
- emotional decisions;
- too large a trade size;
- absence of stop losses;
- attempts to quickly "win back" after a loss;
- excessive use of leverage.
High volatility amplifies the consequences of any mistake. If in a calm market a wrong decision may lead to a small loss, then in a sharp move it can quickly destroy part of the deposit.
The main market risks of high volatility are the following.
Gap Risk. The most frightening thing for an intraday trader. The price may open beyond your stop loss on Monday morning, and you will receive a loss not according to the plan, but at the actual closing price (slippage). There is no protection against a gap, except not leaving positions open over the weekend during a period of uncertainty.
Liquidity Void. In moments of panic or when certain news is released, buyers or sellers simply disappear from the order book. You see an FVG on the chart, which means you physically cannot exit the asset.
Psychological Trap (Tilt). Huge candles are hypnotizing. A beginner enters on "adrenaline" with a huge volume, breaking every rule. Profit obtained by chance during turbulence is always returned to the market many times over.
Practical Tips for Beginner Traders

- Do not see volatility as an enemy — it is both an opportunity and a risk.
- Before a trade, always assess the market's current activity.
- When volatility rises, reduce the position size.
- Always use stop-losses and define the acceptable risk in advance.
- Do not make emotional decisions, especially during sharp price movements.
- Start working in a highly volatile market only after testing the strategy on history and on a demo account.
Conclusion
Volatility is a natural property of any financial market. It determines the speed and scale of price changes, affects risk, strategy choice, and potential returns.
For a beginner trader, understanding volatility is often more important than searching for the “perfect” indicator or trading system.
High volatility can bring good profits, but only with strict adherence to money management rules. It is discipline, risk management, and the ability to assess the market situation that help a trader stay in the market for a long time and with confidence — whether it is calm or very sharp.