
U.S. Stock Market Futures: Review and Forecast for 04/13-17/2026
{"blocks": [{"id": "az49qhwo", "data": {"html": "
"}, "type": "paragraph"}, {"id": "ip006j5p", "data": {"html": "
Last week, the Fed minutes, quarterly U.S. GDP, and the personal consumption expenditures index were published. In the latter, the rise in fuel prices, unseen since the 1960s, was somehow magically not taken into account.
"}, "type": "paragraph"}, {"id": "kb9d6a58", "data": {"html": "
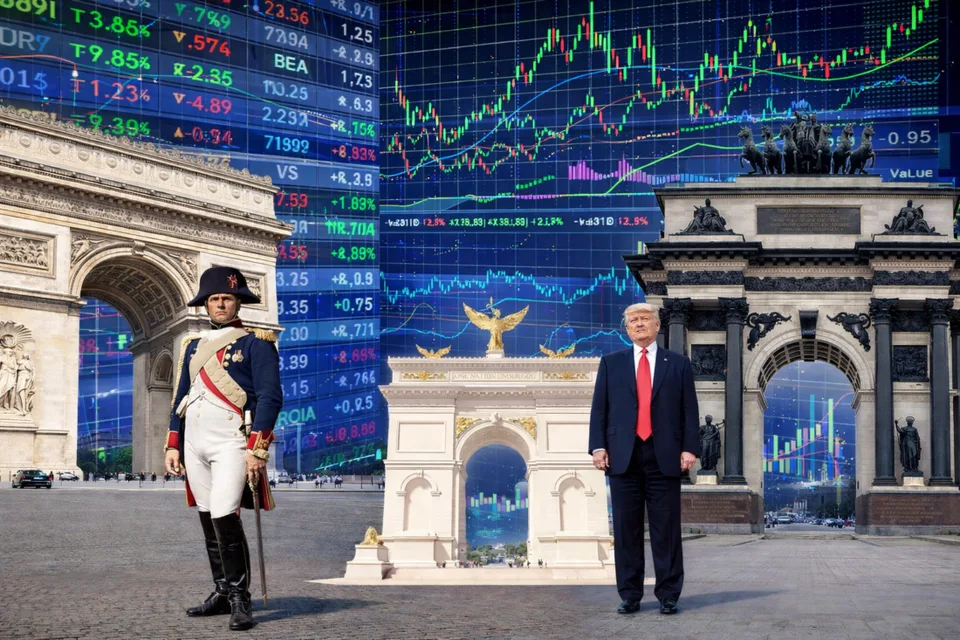
But that is not the most interesting thing. The plans to build Trump's Triumphal Arch in Washington are interesting. Indeed, Paris has one, Moscow has one, but Washington does not. Donald will be the winner here too.
"}, "type": "paragraph"}, {"id": "ps0itzs3", "data": {"html": "
In any case, futures are not reacting to anything now except reports from the Middle East and Trump's social media posts. The main thing is that all the news comes out either on weekends or in a thin market.
"}, "type": "paragraph"}, {"id": "4head28a", "data": {"html": "
The first news about preparations for peace came out last Sunday, April 5. And on the night of April 11 to 12 (from Saturday to Sunday), it became known that peace was still far away. Stock index futures opened below last week's value areas, but the weekly open in futures is not always the market's real sentiment.
"}, "type": "paragraph"}, {"id": "4u3gsfqx", "data": {"html": "
Let's see how volumes were placed in YM / ES / NQ futures and what to expect in the coming week.
"}, "type": "paragraph"}, {"id": "k81v5ipk", "data": {}, "type": "readmore"}, {"id": "0ri1qbwm", "data": {"text": "YM Futures (DJ-30)", "align": "center", "level": 2}, "type": "heading"}, {"id": "57zhx6kz", "data": {"html": "
In YM futures, the main liquidity last week was placed in the 47950-48110 range. From 47000 to 47900 is an imbalance zone, essentially a volume gap. Even if one assumes the market should keep rising (no, I do not assume that), such a gap is always traded through: sometimes immediately, sometimes later.
"}, "type": "paragraph"}, {"id": "01gvz0bg", "data": {"alt": "futures", "url": "/uploads/2026/04/image-31-1100x571.png", "size": "100%", "align": "center", "caption": "", "linkUrl": ""}, "type": "image"}, {"id": "4fomuzyz", "data": {"html": "
As it is, the guys bounced from 45100 (the POC area of the YM 09-25 contract) and immediately touched the lower boundary of the YM 03-26 contract's value area.
"}, "type": "paragraph"}, {"id": "07bxxvjc", "data": {"html": "
This model on the higher TF implies work within the timeframe (the rest of the contract) in a wide range from 46000-46500 to 48500-49300.
"}, "type": "paragraph"}, {"id": "0coackhl", "data": {"html": "
Of course, positive news such as the end of the conflict in the Middle East may add momentum, but for now this scenario looks too optimistic.
"}, "type": "paragraph"}, {"id": "x5gb32yl", "data": {"html": "
On the daily timeframe, it is clearly visible that in the 48370-48470 range buyers cooled off a bit after consolidating above the 47710-47900 range (the selling zone) and building volumes at 47980-48160.
"}, "type": "paragraph"}, {"id": "znb2nv8r", "data": {"html": "
There is no point discussing where the futures opened, since the dynamics are such that by the U.S. open, quotes may return closer to the close. But in any case, we understand that without consolidating above 48500, or at least 48200, playing long is dangerous (this is not about scalping, but about a swing from current prices).
"}, "type": "paragraph"}, {"id": "t4q1bh4v", "data": {"alt": "futures", "url": "/uploads/2026/04/image-32-1100x550.png", "size": "100%", "align": "center", "caption": "", "linkUrl": ""}, "type": "image"}, {"id": "he7sez4y", "data": {"html": "
The key idea for the week is trading through the imbalance range from 47000 to 48000. But how they will do it, we will see a little later. The alternative is a test of 48950.
"}, "type": "paragraph"}, {"id": "4pu4ddmd", "data": {"text": "ES Futures (S&P 500)", "align": "center", "level": 2}, "type": "heading"}, {"id": "ezlvebfg", "data": {"html": "
The ES futures behaved a little differently.
"}, "type": "paragraph"}, {"id": "uh3ylbjs", "data": {"alt": "futures", "url": "/uploads/2026/04/image-33-1100x562.png", "size": "100%", "align": "center", "caption": "", "linkUrl": ""}, "type": "image"}, {"id": "t26jqbgj", "data": {"html": "
After piercing the point of control (POC) of the September ES 09-25 contract, it immediately flew to the 6875-6890 zone, where the point of control (POC) of the entire buy impulse since April 2025 is located. This is a strong signal that there is no real panic: the price returned to the most comfortable zone of recent months.
"}, "type": "paragraph"}, {"id": "zs42nig5", "data": {"html": "
But in the volatile structures that we are observing now, a new start of downward dynamics toward the same 6400, for example, is possible. And toward 6500-6550, certainly. But this is specifically about the weekly TF.
"}, "type": "paragraph"}, {"id": "6p4mae4m", "data": {"html": "
Of course, there is an alternative with a renewal of all-time highs, but I do not particularly see reliable signals that it is precisely the sharp-growth scenario that is developing, although I may be very wrong.
"}, "type": "paragraph"}, {"id": "gqdefo1x", "data": {"html": "
If we look at the entire current buy impulse since March 30, it is worth noting the zone of aggressive accumulation of purchases in the overall 6610-6660 range. After that, an imbalance occurred on April 7.
"}, "type": "paragraph"}, {"id": "fwodxhnr", "data": {"alt": "futures", "url": "/uploads/2026/04/image-34-1100x568.png", "size": "100%", "align": "center", "caption": "", "linkUrl": ""}, "type": "image"}, {"id": "h9wncug5", "data": {"html": "
The new value area can be divided into two subranges: 6805-6825 and 6855-6870. Wherever it goes next, both buyers and sellers will have to work hard here.
"}, "type": "paragraph"}, {"id": "y8rfcumf", "data": {"html": "
But in any case, wherever it goes, liquidity needs to be accumulated. And the coming week is perfectly suited for that. It should be accumulated around 6800-6850, and then distributed. Another accumulation option is a smooth descent to 6660.
"}, "type": "paragraph"}, {"id": "mqmt1v74", "data": {"text": "NQ Futures (Nasdaq-100)", "align": "center", "level": 2}, "type": "heading"}, {"id": "nfceqcop", "data": {"html": "
This futures contract looks somewhat more vigorous than the previous instruments. This is explained by the fact that it jumped above the 24770-25070 range, where sales had been formed in the second half of the previous contract (NQ 03-26).
"}, "type": "paragraph"}, {"id": "c8ojbmno", "data": {"html": "
Last week's growth stopped at 25350-25400. This is the zone of February tactical sales by specialists.
"}, "type": "paragraph"}, {"id": "b99r3h5k", "data": {"alt": "futures", "url": "/uploads/2026/04/image-35-1100x564.png", "size": "100%", "align": "center", "caption": "", "linkUrl": ""}, "type": "image"}, {"id": "ssl1kb90", "data": {"html": "
Here, as with other instruments, one can see a model for the start of an upward move. But I would not want to see it: not because I am against growth, but because there are no objective reasons for growth to be realized: the Fed is not printing money, the AI bubble can no longer inflate further, etc.
"}, "type": "paragraph"}, {"id": "clfbxttc", "data": {"html": "
In general, we are watching the positioning of the 24770-25070 range. If we return briskly below the range, then the story is, if not about downside, then about a slow slide. But above it, there may be different options. However, it is hard to guess now.
"}, "type": "paragraph"}], "version": 1}