
U.S. Stock Market Futures: Review and Forecast for 04/27 - 05/01/2026
{"blocks": [{"id": "gjkzznsg", "data": {"html": "
"}, "type": "paragraph"}, {"id": "o8cpdk3h", "data": {"html": "
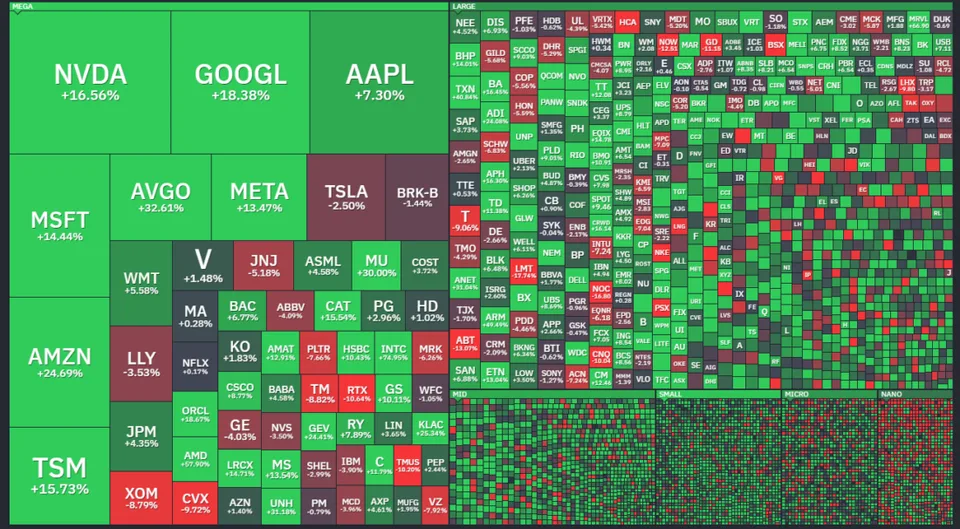
April 2026 became almost the craziest month for the U.S. stock market.
"}, "type": "paragraph"}, {"id": "ppggnjpu", "data": {"html": "
Technology sector stocks gained tremendously in value, and from a high base, without an inflow of fresh money and against the backdrop of the Iranian crisis. Of course, the media again began talking about AI prospects, chips for AI, etc.
"}, "type": "paragraph"}, {"id": "h1mug0p5", "data": {"html": "
But what lies behind this? It is not entirely clear to me. We will need to look a little later at the data on capital inflows into the U.S. from Dubai and other Middle Eastern monarchies.
"}, "type": "paragraph"}, {"id": "iy2lnthf", "data": {"alt": "futures", "url": "/uploads/2026/04/image-61.png", "size": "100%", "align": "center", "caption": "", "linkUrl": ""}, "type": "image"}, {"id": "5r45441z", "data": {"html": "
There is a well-founded suspicion that one of the hidden goals of the conflict is to stimulate capital flows into the U.S. The chart above (latest data is February 2026) clearly shows that the inflow of money into U.S. bonds is drying up, and this is against a background of rising budget spending.
"}, "type": "paragraph"}, {"id": "2bylh6ib", "data": {"html": "
We will talk about this in more detail some other time. For now, let us look at VIX futures.
"}, "type": "paragraph"}, {"id": "ekd5r6er", "data": {"html": "
On April 16, the instrument saw the third-largest volumes: 1.659 million contracts. The second values came on April 8: 1.679 million contracts. And the first (2.383 million contracts) came on April 14.
"}, "type": "paragraph"}, {"id": "n88nbj2t", "data": {"alt": "futures", "url": "/uploads/2026/04/image-62.png", "size": "100%", "align": "center", "caption": "", "linkUrl": ""}, "type": "image"}, {"id": "aj0rj6cd", "data": {"html": "
Despite optimism going off the scale, VIX stopped around 20-21 points. This is the zone below which the market is calm, and above which it is tense.
"}, "type": "paragraph"}, {"id": "8001y4m0", "data": {"alt": "futures", "url": "/uploads/2026/04/image-63-1100x628.png", "size": "100%", "align": "center", "caption": "", "linkUrl": ""}, "type": "image"}, {"id": "qz7u0max", "data": {"html": "
And for almost two weeks now VIX has been in this 20-21 zone, where volumes passed on both April 14 and April 16. It is not twitching. Trump is twitching, Iranian talking heads are twitching, but VIX is not. We will stay alert.
"}, "type": "paragraph"}, {"id": "52hu33tb", "data": {"html": "
Now let us move on to stock index futures YM / ES / NQ.
"}, "type": "paragraph"}, {"id": "88lvop24", "data": {}, "type": "readmore"}, {"id": "bzk3vp3x", "data": {"text": "YM Futures (DJ-30)", "align": "center", "level": 2}, "type": "heading"}, {"id": "2y79xnqu", "data": {"html": "
On the YM futures today we will consider only RTH (the U.S. session, regular trading hours).
"}, "type": "paragraph"}, {"id": "z5pfnyyg", "data": {"html": "
The chart below shows the impulse from April 13.
"}, "type": "paragraph"}, {"id": "w79y5kum", "data": {"alt": "futures", "url": "/uploads/2026/04/image-64-1100x545.png", "size": "100%", "align": "center", "caption": "", "linkUrl": ""}, "type": "image"}, {"id": "o02eddmu", "data": {"html": "
Everything is clear there: April 13 (Monday), imbalance, then 3 days of liquidity accumulation in a flat range and Friday's opening 0.85% above Thursday's close. That is, a typical gap between RTH sessions, while everything that happened in the Asian and European sessions is a different story. The money is still American, and the market is American.
"}, "type": "paragraph"}, {"id": "wyh9fsvn", "data": {"html": "
Over the past week, we tried to trade the gap very carefully. Only on Thursday, April 23, were speculators able to push the quote to 49040 and sharply bounce back.
"}, "type": "paragraph"}, {"id": "9h7w67t7", "data": {"html": "
Thus, at the moment, the untraded gap is in the 48915-49040 range.
"}, "type": "paragraph"}, {"id": "b2ve824d", "data": {"html": "
It is perfectly clear where the main balance is forming. Buyers are accumulating liquidity in the 49300-49355 range. This is a very dense platform right here.
"}, "type": "paragraph"}, {"id": "wdvsseli", "data": {"html": "
The core is in the 49580–49650 range.
"}, "type": "paragraph"}, {"id": "z584h9z0", "data": {"html": "
There is no resistance as such yet, unless we count the core of this zone. Therefore, I will simply mark out the clean reversal liquidity located in the 49985-50005 range. I will repeat once again: there is no money here, but why not use this zone to look for a double top.
"}, "type": "paragraph"}, {"id": "mlx4a25u", "data": {"html": "
Looking at this chart, you can immediately prepare for two scenarios for the start of the week. The scenarios are specifically for RTH, since other sessions, especially at the week's open, are often not very informative for stock indices.
"}, "type": "paragraph"}, {"id": "pch4dk79", "data": {"html": "
In the first half of the week, the following development is most likely:
"}, "type": "paragraph"}, {"id": "v3xje5ys", "data": {"items": ["The U.S. market opening somewhere around 49400 with an attempt to hit 49800 and maybe 50000. After that, reverse dynamics should be expected.", "The U.S. market opening around 49300 and a hit to 49000 and even 48900, followed by a sharp return toward 49600."], "style": "unordered"}, "type": "list"}, {"id": "1a65yqk7", "data": {"text": "ES Futures (S&P 500)", "align": "center", "level": 2}, "type": "heading"}, {"id": "1ar3wv6n", "data": {"html": "
And for the ES futures today, we will consider only RTH (the American session, regular trading hours).
"}, "type": "paragraph"}, {"id": "sm6rtb3d", "data": {"html": "
Here too we will build a chart of the impulse from April 13, although, unlike the YM futures, the consolidation here had an upward shape, which indicates a very strong impulse.
"}, "type": "paragraph"}, {"id": "k5wjc1gt", "data": {"html": "
It is worth noting that the gap between the weeks was successfully closed, but at the same time another all-time high was updated. The week closed in the 7187–7196 range.
"}, "type": "paragraph"}, {"id": "nl5ht3n0", "data": {"alt": "futures", "url": "/uploads/2026/04/image-65-1100x555.png", "size": "100%", "align": "center", "caption": "", "linkUrl": ""}, "type": "image"}, {"id": "t5e8b84e", "data": {"html": "
Within the framework of the setup, one can expect an attempt at another expansion to the north, but there is no need to look for an entry before the American session, since Americans may not want to buy above 7200. And if they do not want to buy, then there will be nothing shameful in them moving toward 7122–7142 and perhaps to 7100.
"}, "type": "paragraph"}, {"id": "hycl07fm", "data": {"html": "
There is no hint in this story as to whether there will be some sharp reversal to the south, but within the formation of balance at current levels, a certain return toward 7100 is likely. However, 7250 should not be crossed off the list of possible scenarios either.
"}, "type": "paragraph"}, {"id": "2gl2m3po", "data": {"text": "NQ Futures (Nasdaq-100)", "align": "center", "level": 2}, "type": "heading"}, {"id": "0gce6d2o", "data": {"html": "
On the NQ futures there is no point looking at anything except RTH (the American session, regular trading hours). Also a quote since April 13.
"}, "type": "paragraph"}, {"id": "yadrwp9t", "data": {"alt": "futures", "url": "/uploads/2026/04/image-66-1100x548.png", "size": "100%", "align": "center", "caption": "", "linkUrl": ""}, "type": "image"}, {"id": "u6xdtlzd", "data": {"html": "
Here buyers went completely mad from impunity and pushed the quote almost to 27500. The week closed in the 27390–27435 range. And this is such strong overboughtness that it would be quite good to pull back a little at the start of the week.
"}, "type": "paragraph"}, {"id": "jdgyg4p8", "data": {"html": "
Where to? For a start, into the 26860-27000 range, although they may try to hold 27100 as well. I am sure that in the coming week (at least in the first half) one should not expect the quote below 27000.
"}, "type": "paragraph"}, {"id": "gxngkq4t", "data": {"html": "
Even if on Monday they try to expand further north, it is quite reasonable to expect trading lower.
"}, "type": "paragraph"}, {"id": "23ak9ahn", "data": {"text": "Conclusion", "align": "center", "level": 2}, "type": "heading"}, {"id": "yycegvtv", "data": {"html": "
On stock indices in the coming week, one should expect some growth (on YM for sure, although in balance) and consolidation on ES and NQ. However, further growth is possible there too.
"}, "type": "paragraph"}, {"id": "1ysg9tmh", "data": {"html": "
Can geopolitics make adjustments? Probably only if Iran destroys the underwater communications connecting the Gulf monarchies with the United States, thereby cutting them off from the global financial system.
"}, "type": "paragraph"}, {"id": "2k5vp56s", "data": {"html": "
As it is, we see that growth everywhere looks healthy, which means there is room to move while the move has not been canceled.
"}, "type": "paragraph"}], "version": 1}