
U.S. Stock Market Futures: Forecast for 02/09-13/2026
{"blocks": [{"id": "786rzumj", "data": {"html": "
"}, "type": "paragraph"}, {"id": "ru1vy7ck", "data": {"html": "
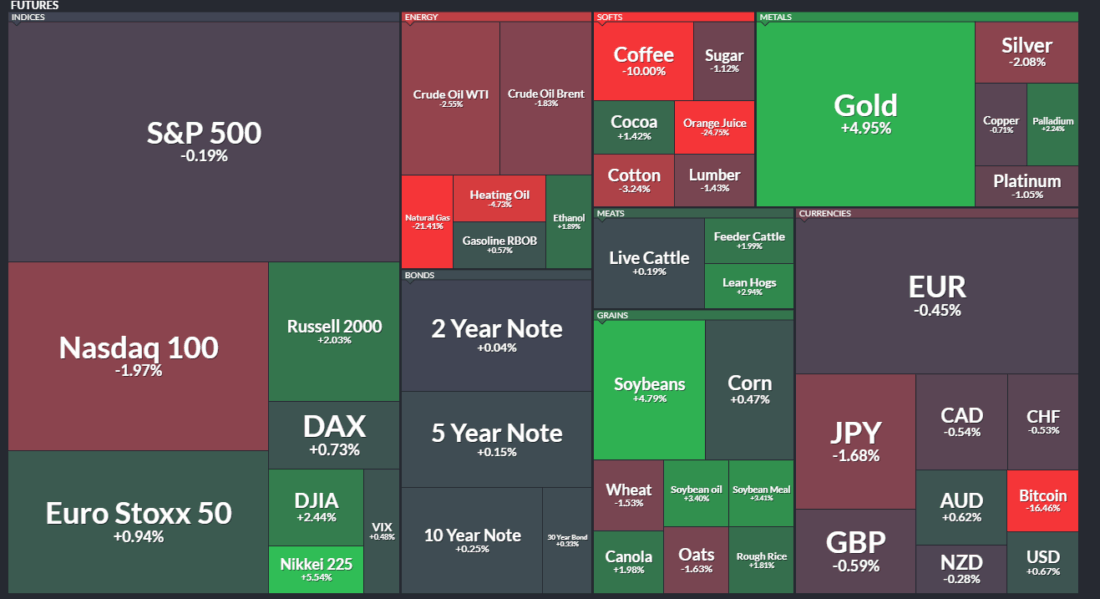
If at the start of the week it seemed that the "song was sung," it turned out it only seemed so: Friday's short squeeze put everything in its place, and stock futures showed surprisingly one-directional dynamics.
"}, "type": "paragraph"}, {"id": "3eu3jf7m", "data": {"html": "
What caused the rapid growth? This is already starting to look surreal: if at the start of the week "the market was skeptical about AI investments," then by the end of the week everything changed again: the announced $660 billion of investments in 2026 alone could not help but trigger a bout of unrestrained optimism.
"}, "type": "paragraph"}, {"id": "ev343b0n", "data": {"html": "
Let us leave offscreen the emerging energy shortage for these projects, although the U.S. is commissioning new generating capacity for AI at a rapid pace. This, of course, leads to long-term growth in the average cost of gas in Europe, since there will not be enough gas for everyone. And there is a suspicion that between domestic and external demand in the U.S., the first will take priority. If the market does not "decide," the administration will suggest it.
"}, "type": "paragraph"}, {"id": "p0cn0oh6", "data": {"html": "
And now let us look at what was happening behind the scenes, i.e. where and how futures on the main stock indices were being loaded.
"}, "type": "paragraph"}, {"id": "kexax1v2", "data": {}, "type": "readmore"}, {"id": "bln8rv45", "data": {"text": "ES Futures (S&P 500)", "align": "center", "level": 2}, "type": "heading"}, {"id": "irmb86pa", "data": {"html": "
On the ES futures, the balance level markup has not changed, although small shifts can be found. But before that, let us see what we expected last week and what actually happened.
"}, "type": "paragraph"}, {"id": "7gkxdavc", "data": {"text": "Through the test of 6945 (POC of the week before last), they may again try to storm 7000 and, perhaps, a little above 7050. After all, quite a lot of liquidity passed at the lows of last week and the week before last, after which a return to balance at 6990 and even 6950 is possible. Is there an alternative? In balance, there are always several alternatives. From current levels or after a test of 7000 from below, and maybe even a little above 6990, to hit 6879-6894 and even try 6850. And there will again be growth in volumes there. A move with consolidation below 6825 may be, and most likely will be, a strong signal of a transition to selling, BUT for now this is not a very appropriate alternative. Let me remind you that in balance there are usually three touches of the high-low, and the exit comes on the 4th or even 5th. That is if we are talking about a strong story.", "author": ""}, "type": "quote"}, {"id": "voqz4nbb", "data": {"html": "
This is the kind of development I assumed last week. As often happens in balances, it played out a little differently.
"}, "type": "paragraph"}, {"id": "0rmrcr2f", "data": {"alt": "futures", "url": "/uploads/2026/02/2026-02-07_10-56-47-1100x567.png", "size": "100%", "align": "center", "caption": "", "linkUrl": ""}, "type": "image"}, {"id": "4gbvr75j", "data": {"html": "
As for resistances, the 7002-7015 range again did not let it go higher. That was expected too.
"}, "type": "paragraph"}, {"id": "yxwtavfg", "data": {"html": "
In the 6805-6825 range on Thursday, support was formed, piercing the bottom of the week before last: i.e. in this respect they held a significant level, although it happened on the verge of a foul.
"}, "type": "paragraph"}, {"id": "oimpmgt0", "data": {"html": "
There was interesting liquidity in the 6873-6900 range: there was not very much of it there, but it produced a northward reaction. And this was not accidental, because purchases were loaded here several times in one form or another.
"}, "type": "paragraph"}, {"id": "neb17lgx", "data": {"html": "
The week closed under the 6953-6971 range. I expected that the money placed here at the end of the week before last had buying as the priority, but that opinion turned out to be somewhat mistaken.
"}, "type": "paragraph"}, {"id": "qwug4rvy", "data": {"html": "
The week's core was formed in the 6905-6945 range. This is exactly where a very large amount of money was turned over on Wednesday. And they returned here. This is an area of real interest for major players.
"}, "type": "paragraph"}, {"id": "1vsyxeq8", "data": {"html": "
What to expect next week? Hard to say. Everything depends on how ready the market is to really go somewhere.
"}, "type": "paragraph"}, {"id": "k0san24e", "data": {"html": "
If this balance, which was being formed for almost two months, shifts into imbalance, then it will be possible to look for an exit point into an impulse. But we will not guess.
"}, "type": "paragraph"}, {"id": "g0q77j36", "data": {"html": "
Let us simply note that consolidation above 7040 (i.e. accumulation of volumes in a plane) may be a good northern signal, while consolidation below 6800 (i.e. accumulation of horizontal volumes) may become a southern signal.
"}, "type": "paragraph"}, {"id": "s81beutj", "data": {"html": "
Now let us look at RTH. Here the expectations were more accurate and clear.
"}, "type": "paragraph"}, {"id": "x8prxuos", "data": {"text": "If Monday passes without a strong hit, then it should be expected on Tuesday. The model implies a test of last week's lows from the very beginning, possibly with a renewal of the lows, which means strong dynamics.", "author": ""}, "type": "quote"}, {"id": "ynsxbbf6", "data": {"html": "
On Monday, America carefully loaded sales in the 6997-7015 range, from where they went south on Tuesday. At the same time, sales were loaded in the 6955-6971 range.
"}, "type": "paragraph"}, {"id": "bwy0gn1w", "data": {"alt": "futures", "url": "/uploads/2026/02/2026-02-07_11-10-37-1100x549.png", "size": "100%", "align": "center", "caption": "", "linkUrl": ""}, "type": "image"}, {"id": "ivf4r8wj", "data": {"html": "
In the second half of Tuesday and for most of Wednesday, the 6904-6943 range was traded. On Thursday, they pushed down to 6800, taking clean liquidity for a reversal in the 6806-6824 area.
"}, "type": "paragraph"}, {"id": "vaqjld38", "data": {"html": "
A level from the week before last remained on the chart: 6847-6860. A little money was rotated here last week, but from here Thursday distributed into shorts, while Friday started in buy.
"}, "type": "paragraph"}, {"id": "zsudgw88", "data": {"html": "
On Friday, they calmly passed through the week's core of 6904-6945, reaching Tuesday's first sales at 6955-6971, and fully canceled the shorts by consolidating above the week's VWAP.
"}, "type": "paragraph"}, {"id": "43bbs55k", "data": {"html": "
RTH shows better what may await us in the first half of the week and even beyond.
"}, "type": "paragraph"}, {"id": "81jr7nh9", "data": {"html": "
There is a steady impression that 6900 will be held in one form or another, and they may try to move into a northern expansion if the contract balance has already been formed. Then, in the harsh version, they may not let it go below 6920.
"}, "type": "paragraph"}, {"id": "pmm3q3ug", "data": {"html": "
If America unexpectedly opens above 6975 and starts rising calmly, then there is no need to look for sales.
"}, "type": "paragraph"}, {"id": "th0bkwpv", "data": {"text": "NQ Futures (Nasdaq-100)", "align": "center", "level": 2}, "type": "heading"}, {"id": "0dl6qp7d", "data": {"html": "
NQ futures showed the weakest dynamics among the major instruments. First, let us recall what I talked about in the previous review.
"}, "type": "paragraph"}, {"id": "q1w81494", "data": {"text": "The inability to go above 25700 at the beginning of the week will be a strong signal of preparation for a southern hit. Not necessarily very far, but quite possibly up to 1500 pips. The week's model favors the south more, at least in the first half.", "author": ""}, "type": "quote"}, {"id": "ej08nz9h", "data": {"html": "
Sales were gathered on Monday in the 25835-25925 range. And this was after the week opened with a southern gap. The sales range turned out to be much stronger than on the other instruments.
"}, "type": "paragraph"}, {"id": "l2anojyf", "data": {"alt": "futures", "url": "/uploads/2026/02/2026-02-07_11-45-19-1100x568.png", "size": "100%", "align": "center", "caption": "", "linkUrl": ""}, "type": "image"}, {"id": "i28h5o26", "data": {"html": "
The 25130-25225 range provided support at the start of the week, but now it is (for now) acting as a resistance range. And the main money during the week was turned over in the 24500-25100 range.
"}, "type": "paragraph"}, {"id": "2bohx78v", "data": {"html": "
Note that on NQ the past week became the most aggressive in terms of growth in trading turnover. And this is not surprising, since the week's volumes passed below the contract open.
"}, "type": "paragraph"}, {"id": "hja9nyou", "data": {"html": "
It looks as if this instrument is being turned south. Either the players on NQ were the first to start the move, or the toughest manipulators are here, having collected all the buyers' liquidity.
"}, "type": "paragraph"}, {"id": "i4fo3s9e", "data": {"html": "
And if the volumes accumulated below the contract open go north from Monday, that will be a very strong signal. But playing below 25100, and especially 24600, will be a southern signal, particularly if other instruments again move to the lower boundaries of their balances.
"}, "type": "paragraph"}, {"id": "uirawykt", "data": {"html": "
Now let's look at RTH.
"}, "type": "paragraph"}, {"id": "tf6vctox", "data": {"alt": "futures", "url": "/uploads/2026/02/2026-02-07_12-11-56-1100x549.png", "size": "100%", "align": "center", "caption": "", "linkUrl": ""}, "type": "image"}, {"id": "7qim5yso", "data": {"html": "
On Monday, shorts were carefully accumulated in the 25845-25940 range. On Tuesday, shorts were added in the 25480-25625 range, after which they moved further south with a relatively even accumulation of volumes.
"}, "type": "paragraph"}, {"id": "hmg643gz", "data": {"html": "
Volume rotations on Thursday and Friday were between 24560-24655 and 24980-25105. The week's core formed in the second cluster, and the week's POC is marked at 25100.
"}, "type": "paragraph"}, {"id": "yeg50vgb", "data": {"html": "
The quote returned to the week's VWAP. With a sharp move toward 25500, buyers may calm down, and sellers had better not think about opening trades. Above 26000 is clean buying. But whether that will happen is a big question.
"}, "type": "paragraph"}, {"id": "o9r8mgw4", "data": {"text": "YM Futures (DJ-30)", "align": "center", "level": 2}, "type": "heading"}, {"id": "iophw0ig", "data": {"html": "
The YM futures showed a new all-time high, slightly beyond 50250.
"}, "type": "paragraph"}, {"id": "5k8kpfef", "data": {"text": "Short targets are 48700-48500, and then we'll see. From 48500 one can try toward 49500: a decent thousand points.", "author": ""}, "type": "quote"}, {"id": "7hhu1obg", "data": {"html": "
Here it played out like clockwork, apart from Thursday's collapse.
"}, "type": "paragraph"}, {"id": "ynndwj2c", "data": {"alt": "futures", "url": "/uploads/2026/02/2026-02-07_12-55-41-1100x556.png", "size": "100%", "align": "center", "caption": "", "linkUrl": ""}, "type": "image"}, {"id": "xwe3pxx8", "data": {"html": "
The quote was picked up in the 48935-49215 range, that is, where liquidity was loaded last week. In the past week, buyers were slightly taken out by tails in this area, and that was the end of it.
"}, "type": "paragraph"}, {"id": "8u3q0xjk", "data": {"html": "
If next week they hold 50000, or more precisely the 49715-49775 range, then it will be possible to talk about the start of northern dynamics (there should be confirmation on other instruments).
"}, "type": "paragraph"}, {"id": "x82hr7z1", "data": {"html": "
But a move from Monday-Tuesday below 49500 will indicate a return into balance. If at the same time other instruments go south and NQ starts aggressively updating lows, then perhaps we will see further shorts. But this is all an alternative, which I do not particularly believe in yet.
"}, "type": "paragraph"}, {"id": "hm2jdjf5", "data": {"html": "
RTH shows strong buyer aggression.
"}, "type": "paragraph"}, {"id": "hxauuaq0", "data": {"alt": "futures", "url": "/uploads/2026/02/2026-02-07_13-01-58-1100x551.png", "size": "100%", "align": "center", "caption": "", "linkUrl": ""}, "type": "image"}, {"id": "b1r1gpjs", "data": {"html": "
If viewed in the context of the week, buyers can confidently hold the quote in the 49600-49900 range. This is slightly lower than in terms of the contract size, but still does not cancel the buying idea. And if the 50000 mark does not let it go lower, we expect strong northern dynamics.
"}, "type": "paragraph"}, {"id": "wgqf510y", "data": {"text": "Conclusion", "align": "center", "level": 2}, "type": "heading"}, {"id": "1aoek1ab", "data": {"html": "
The past week was the most active in a long time. This may mean both possible problems and the potential to build liquidity for a northern expansion. Taking into account the holding of the main securities in balance, a slight priority can be given to northern dynamics.
"}, "type": "paragraph"}, {"id": "pz769x6z", "data": {"html": "
An important signal: on all securities on Friday, trading volumes fell on very good growth after the high volumes of Wednesday and Thursday.
"}, "type": "paragraph"}, {"id": "o21fc2qs", "data": {"html": "
There is a pattern: if pressure in one direction comes on high turnover, and the reverse, stronger price reaction comes on reduced volumes, then this very often serves as a signal of the start of dynamics.
"}, "type": "paragraph"}, {"id": "ivfkv2iu", "data": {"html": "
If America opens on Monday with a gap after Friday's close, then one can try to look for a continuation north.
"}, "type": "paragraph"}, {"id": "6cx20l5n", "data": {"html": ""}, "type": "paragraph"}], "version": 1}