
U.S. Stock Market Futures: 2025 Review and General Forecast for Early 2026
{"blocks": [{"id": "i06172hh", "data": {"html": "
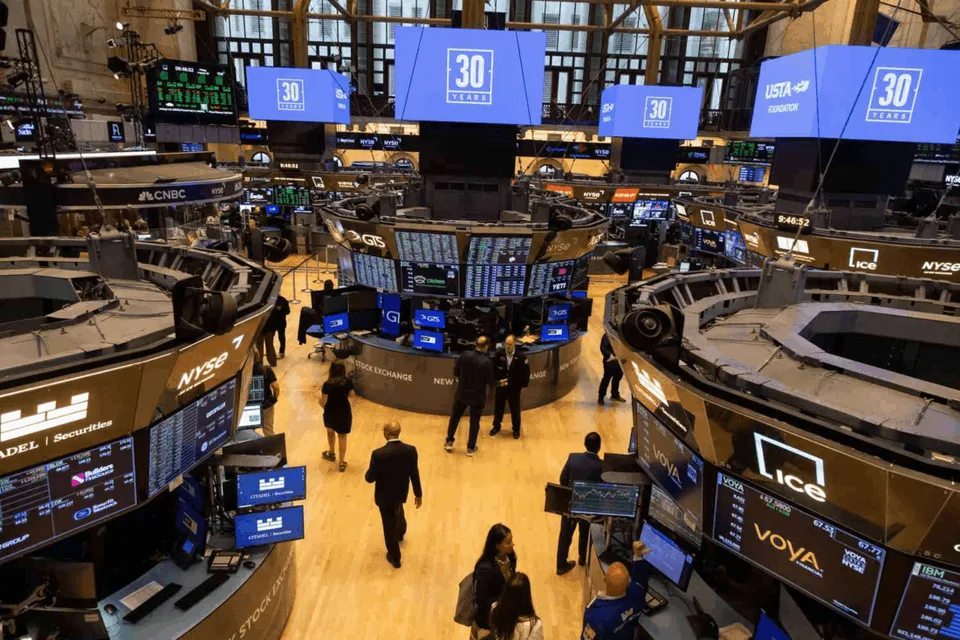
"}, "type": "paragraph"}, {"id": "4ewhltoj", "data": {"html": "
In the first week of the new year 2026, it is worth reviewing the placement of volumes in futures over the past year and, on this basis, building an action plan for the first quarter or even the first half of the coming year. But first, a few general points.
"}, "type": "paragraph"}, {"id": "nrt1ssk3", "data": {"html": "
The main event on exchanges in 2025 was the shaking out of random passengers from futures and stocks during the announcement of tariffs on the whole world. The other events did not have any particular impact on the market.
"}, "type": "paragraph"}, {"id": "7pknfrfz", "data": {"html": "
Most major strategists expect moderate growth in the S&P 500 in 2026 — roughly 6–12% from the end-2025 level. But the range of forecasts is wide: from a conservative, dull year to double-digit growth values if earnings and the “AI boost” persist, while risks of rising rates, geopolitical shocks, etc. are high.
"}, "type": "paragraph"}, {"id": "cs2quzea", "data": {"html": "
The base scenario assumes growth of 6-11%, the bullish one — growth of 15-20%. Speaking of investment banks, Goldman Sachs predicts reaching 7600 in 2026, Morgan Stanley — 7800, J.P. Morgan — 7500, Citigroup (Citi) — 7700, UBS — 7500, Bank of America (BofA / Merrill) — 7100.
"}, "type": "paragraph"}, {"id": "nmh24ctl", "data": {"html": "
But there are also southern alternatives: a moderately bearish scenario assumes a decline of 5-15% and even up to 20%. Citigroup stands out in particular with a possible deep fall to 5700 and Bank of America to 5500.
"}, "type": "paragraph"}, {"id": "1y9eovvt", "data": {"html": "
On average, the Fed and the largest investment banks estimate the risk of a recession in the U.S. at 25-30%: this is a meaningful but not dominant risk. Historically, at such levels of recession probability, the conditional possibility of a major market drawdown (20% or more) rises noticeably, but does not become automatic.
"}, "type": "paragraph"}, {"id": "21mwkbxj", "data": {"html": "
Thus, the market de facto prices in about a 1-in-5 chance that in 2026 we will see a full-fledged bear market of −20% or more. That is not much, but it is far from little. In any case, for now we proceed from the highest probability of moderate stock market growth.
"}, "type": "paragraph"}, {"id": "yt03qonb", "data": {}, "type": "readmore"}, {"id": "1ow804iw", "data": {"text": "ES Futures (S&P 500)", "align": "center", "level": 2}, "type": "heading"}, {"id": "poqxshb2", "data": {"alt": "futures", "url": "/uploads/2026/01/2026-01-03_02-45-31-1100x547.png", "size": "100%", "align": "center", "caption": "", "linkUrl": ""}, "type": "image"}, {"id": "s31nklr1", "data": {"html": "
ES futures showed confident upward dynamics in 2025, except for the story with Comrade Trump's tariffs.
"}, "type": "paragraph"}, {"id": "pwbxrtjg", "data": {"html": "
The most relevant key range is 6630–6730. Here, buyers aggressively bought the dips in October and November. This is exactly where the +1 deviation of the annual VWAP is located, and within the buy impulse this is the expected support zone.
"}, "type": "paragraph"}, {"id": "73lwho7r", "data": {"html": "
A very important range is 6235–6375. The average VWAP for all of 2025 has pulled up here, and liquidity was also accumulated here in the summer for a push all the way to 7000.
"}, "type": "paragraph"}, {"id": "mk994r82", "data": {"html": "
The third most important range is in the 5900–6100 zone. This is where last year opened, and this is also where buyers fully bought out the “tariff” drawdown.
"}, "type": "paragraph"}, {"id": "hskrxn5u", "data": {"html": "
Main scenarios for the first half of 2026
"}, "type": "paragraph"}, {"id": "a17qpuyu", "data": {"html": "
A firm hold of the 6630-6730 range with rotations around 7000, followed by a move north. The next scenario, in turn, implies a transition into deeper volume rotations, but no further than 6235-6375.
"}, "type": "paragraph"}, {"id": "lc7p20sp", "data": {"text": "NQ Futures (Nasdaq-100)", "align": "center", "level": 2}, "type": "heading"}, {"id": "wtrno392", "data": {"alt": "futures", "url": "/uploads/2026/01/2026-01-03_03-09-20-1100x547.png", "size": "100%", "align": "center", "caption": "", "linkUrl": ""}, "type": "image"}, {"id": "rgq8sumi", "data": {"html": "
The NQ futures failed to update the all-time high just before the holidays. But we will not blame it for that.
"}, "type": "paragraph"}, {"id": "l6kqmju3", "data": {"html": "
The most important ranges on this instrument, in our humble opinion, are: 21300-22100, 22900-23600, 24500-25000. I also cannot help but highlight the tactical range of 23800-24050: there is a chance that we will mention it in the first quarter of 2026.
"}, "type": "paragraph"}, {"id": "tqiyivjt", "data": {"html": "
The 2025 year opened in the 21300-22100 range, and the instrument was immediately bought there after the tariff policy became clearer.
"}, "type": "paragraph"}, {"id": "mivsvcqu", "data": {"html": "
In the 22900-23600 range, volumes were accumulated during the hot summer of 2025, which ultimately produced distribution around 26500. The annual VWAP almost reached this range.
"}, "type": "paragraph"}, {"id": "9muaty8y", "data": {"html": "
But in the 24500-25000 range, very interesting volume spikes were observed, which twice showed a northern reaction. The second time, of course, was weaker (on other instruments the second time was stronger). The +1 VWAP deviation is also located in this range.
"}, "type": "paragraph"}, {"id": "inoj39nb", "data": {"html": "
For the first and second quarters of 2026, the ideas are simple: either volume rotations with accumulation no lower than 24500 (extreme value 24000), or rotations around 23000 with tails typical for NQ down to 22000.
"}, "type": "paragraph"}, {"id": "z94hrf02", "data": {"text": "YM Futures (DJ-30)", "align": "center", "level": 2}, "type": "heading"}, {"id": "j2ieaqoz", "data": {"alt": "futures", "url": "/uploads/2026/01/2026-01-03_02-18-58-1100x524.png", "size": "100%", "align": "center", "caption": "", "linkUrl": ""}, "type": "image"}, {"id": "nbww0r39", "data": {"html": "
Within the year, it seems appropriate to me to highlight the following ranges: 42150-42950; 44150-45150 and 46000-46450.
"}, "type": "paragraph"}, {"id": "2ap2ioev", "data": {"html": "
The 42150-42950 range is where buyers worked for a month and a half in May-June. It was in this range that buyers collected sellers' liquidity and moved impulsively toward 49000. A move here is possible in the event of a sufficiently pessimistic scenario without a transition into a "bearish" phase (a reminder: a bear market is a decline of 20+%).
"}, "type": "paragraph"}, {"id": "1ps2ner1", "data": {"html": "
The 44150-45150 range is important because it is the zone where short positions were built at the very beginning of 2025 before a decent drawdown, and it is the zone where buyers gained strength during the summer and moved further. In the event of a neutral or moderately negative development, this range may well become a support zone around the end of the first or even second quarter of 2026.
"}, "type": "paragraph"}, {"id": "glald4dg", "data": {"html": "
The importance of the 46000-46450 range is hard to overestimate. This was where serious volume activity appeared for the first time since April, after which the quote moved north. In fact, this is the support of the last quarter of 2025. The +1 VWAP deviation for all of 2025 is also located here. Under a positive scenario, this is exactly where pullbacks will go in order to gather strength for the next push.
"}, "type": "paragraph"}, {"id": "adnyfnnc", "data": {"html": "
The main ideas at the current stage are the expectation of volume rotations no further than 46000-47000, with gradual volume accumulation for the continuation of the northern dynamic. At the current stage, northern expansion is likely impossible, since the standard passage range has already been completed, which means that a pullback dynamic is maturing.
"}, "type": "paragraph"}, {"id": "r5oji3ry", "data": {"html": "
The second idea is a continuation of the rotation around 44000. This is a scenario that is quite expected, and it has quite a few outcomes in the middle of the year.
"}, "type": "paragraph"}, {"id": "xkbsiypw", "data": {"text": "Conclusion", "align": "center", "level": 2}, "type": "heading"}, {"id": "p47lmtis", "data": {"html": "
In our annual forecast, we assumed that, at least in the first half of the year, one should not expect any “black swans.” This does not mean there will be none. It means that we proceed from the main development scenarios discussed at the Fed and leading investment banks.
"}, "type": "paragraph"}, {"id": "c2n8xwm8", "data": {"html": "
Yes, the risk of a full-fledged recession exists, but we will discuss its development when it starts to materialize. At the same time, if we see a deep drawdown of 20+%, we will closely watch to make sure that serious buyers do not again buy up all the supply, as happened in March-April 2025.
"}, "type": "paragraph"}, {"id": "cza0s351", "data": {"html": "
As for real medium-term trading, around the end of January to the beginning of February, a picture will be drawn that can provide a good and clear swing trade. We will wait.
"}, "type": "paragraph"}, {"id": "dvn5mjtu", "data": {"html": "
And in conclusion, I will show the RTY futures on the Russell 2000 index. This index tracks 2000 small-cap companies. The growth model in 2025 is generally the same as in other securities.
"}, "type": "paragraph"}, {"id": "9y5xflqw", "data": {"alt": "futures", "url": "/uploads/2026/01/2026-01-03_08-05-02-1100x552.png", "size": "100%", "align": "center", "caption": "", "linkUrl": ""}, "type": "image"}, {"id": "pp2lx3f9", "data": {"html": "
The last wave of growth since mid-November is especially worth highlighting. The index gained about 11%, which is 1.5 times more than the S&P 500. Why is this important?
"}, "type": "paragraph"}, {"id": "bwxrpwnp", "data": {"html": "
Confident growth in the stocks included in the Russell 2000 index is a strong signal of confidence in the near-term prospects of the stock market. We will finish here for today.
"}, "type": "paragraph"}, {"id": "bexh0a02", "data": {"html": "
Respectfully,
Ivan Rusin
"}, "type": "paragraph"}], "version": 1}