
What Types of Moving Averages Are There?
 Hello, ladies and gentlemen, forex traders!
Most of us are well familiar with the four types of moving averages available in the MetaTrader 4 terminal: exponential (EMA), simple (SMA), linear weighted (LWMA), and smoothed (SMMA). However, that does not exhaust the list. Many traders, analysts, and market professionals developed quite a few different moving average variations over the second half of the 20th century, trying to solve certain problems common to all known moving averages. First and foremost, this is the indicator's delayed reaction to price changes.
In today's material, we will try to lift the veil of mystery and find out what other moving averages exist, how they are calculated (it is not necessary to memorize the calculation formulas; they are needed for a deeper understanding of the indicators), who the developer-authors are, and how their creations can be used in practical market work.
The History of the Moving Average
According to Alexander Elder, some of the first to use moving averages were anti-aircraft gunners during the Second World War; they used moving averages to aim guns at airplanes. As for who exactly authored the very first indicator, that is unknown. Among the first major experts on moving averages were Richard Donchian (Richard Donchian) and J. M. Hurst (J. M. Hurst).
 Donchian (1905-1993) was an American trader, analyst, and businessman. He worked at Merryll Lynch, where he created a strategy based on several moving averages. Influenced by the book "Reminiscences of a Stock Operator," he became interested in financial markets, and after the losses he suffered in 1929 during the financial crash, he became deeply involved in technical analysis.
 Hurst was an engineer by training and was also actively involved in market trading. He is the author of the well-known book "The Profit Magic of Stock Transaction Timing" (the English original can be found online without difficulty), which became a market classic. He described the principles of using moving averages in stock trading.
Thus, it is quite reasonable to assume that the moving average indicator already existed in the middle of the last century and is, without any doubt, one of the oldest technical indicators. The Moving Average indicator is very well known and popular, so it can be found in absolutely any platform intended for trading. In addition to the four MA types (they have already been examined in detail on our site), there are quite a few other versions and modifications. The formula for the simple moving average is absurdly simple:
A simple, or arithmetic, moving average is calculated by summing the instrument's closing prices over a certain number of single periods (for example, over 20 days) and then dividing the sum by the number of periods.
SMA = SUM (CLOSE (i), N) / N
where:
SUM is the sum;CLOSE (i) is the closing price of the current period;N is the number of calculation periods.
And here is the picture as well (SMA 21):
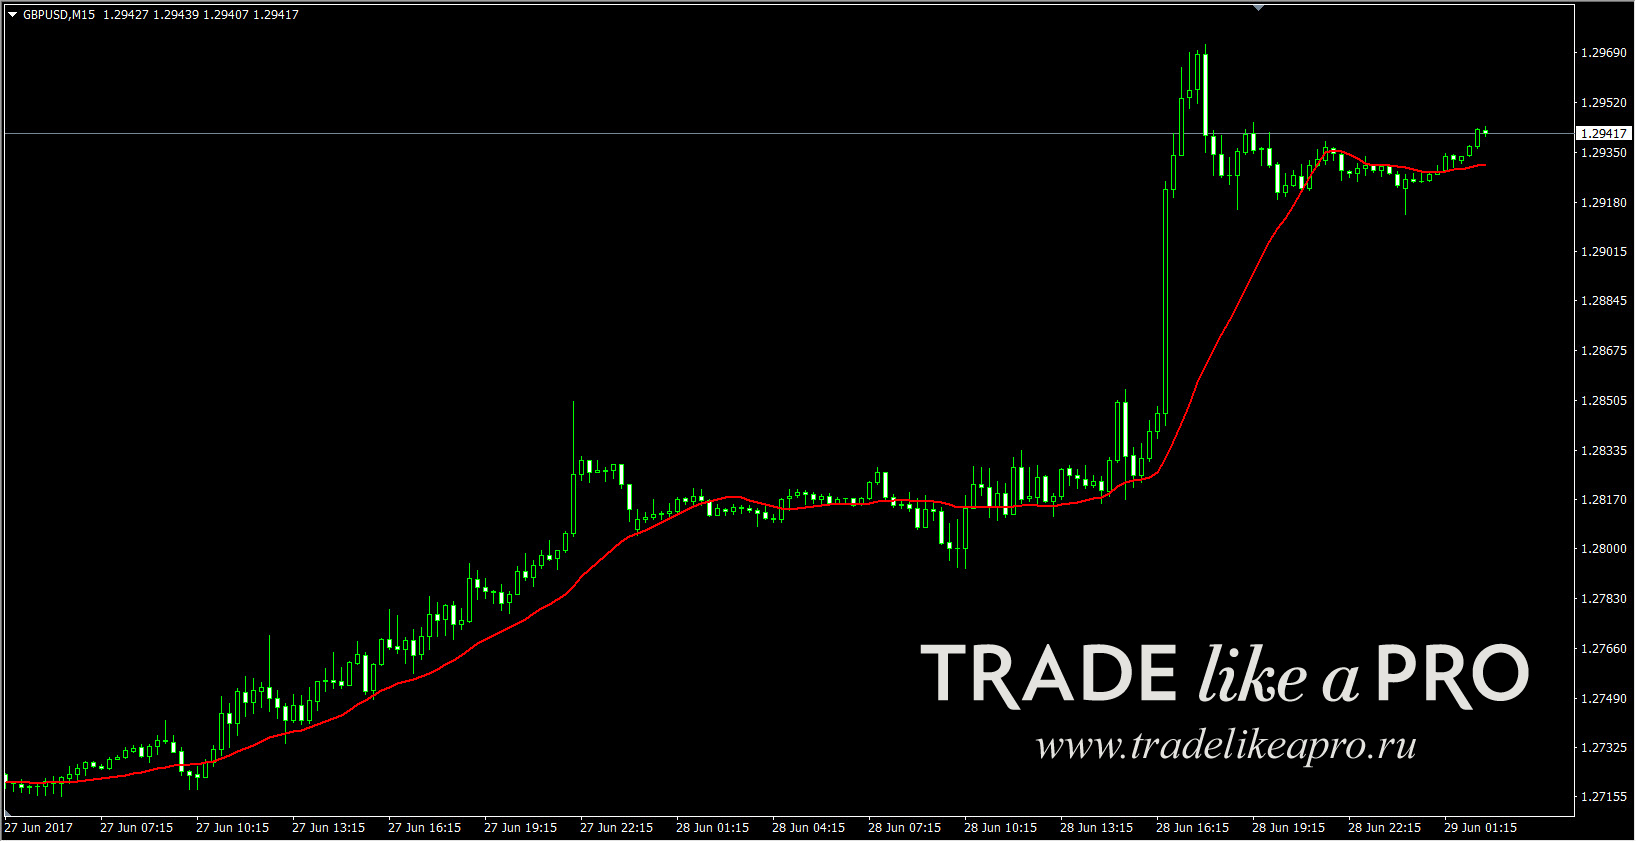 To calculate the indicator, the plain closing price of the candle (bar) is taken; it is in the numerator. Then it is divided by the required number of days (in the denominator), depending on what moving average period the trader needs, for example 20, 50, 100 and so on. That is all. On the other hand, this simplicity has a downside: the indicator becomes sluggish and lags behind. Price has already reversed and is moving in the opposite direction, while the indicator is still not signaling a change in trend:
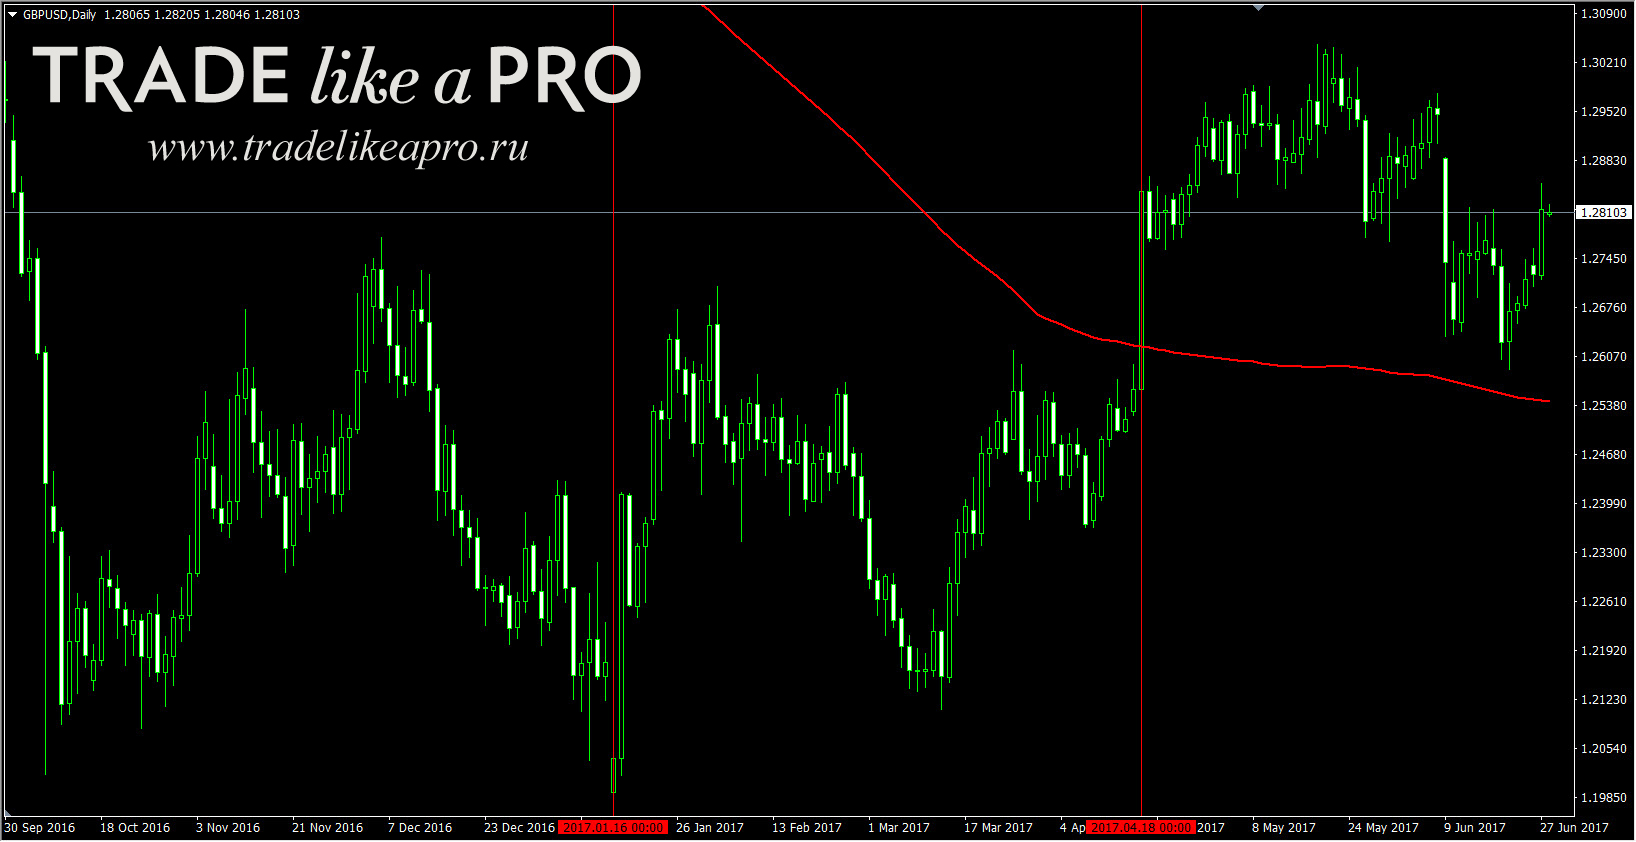 An example with the "200 moving average." Using levels and Price Action, one could have bought there (and quite a few traders did), and only after more than 500 points and 66 daily candles did the price finally break the daily reference point, the 200-period moving average. A moving average, like any technical indicator, is not perfect; one of its main drawbacks is lag. Traders, analysts, and programmers have fought, are fighting, and will continue to fight this problem. At present, many interesting and worthwhile moving average variants have been created, and we will get acquainted with them below.
It is also worth mentioning that all indicators are installed according to the standard instructions.
Adaptive Moving Average
 Adaptive Moving Average (AMA, sometimes also written as KAMA after the first letter of the creator's surname) is an adaptive moving average developed by Perry Kaufman (Perry Kaufman). He is one of the world's leading trading specialists and has more than 30 years of experience in the futures and Forex markets, among others. He is the author of several books.
 He described his creation in the book "Smarter Trading" in 1995 (the English-language book is easy to find online). Comparison of AMA (14) with SMA (14) from MetaTrader 4:
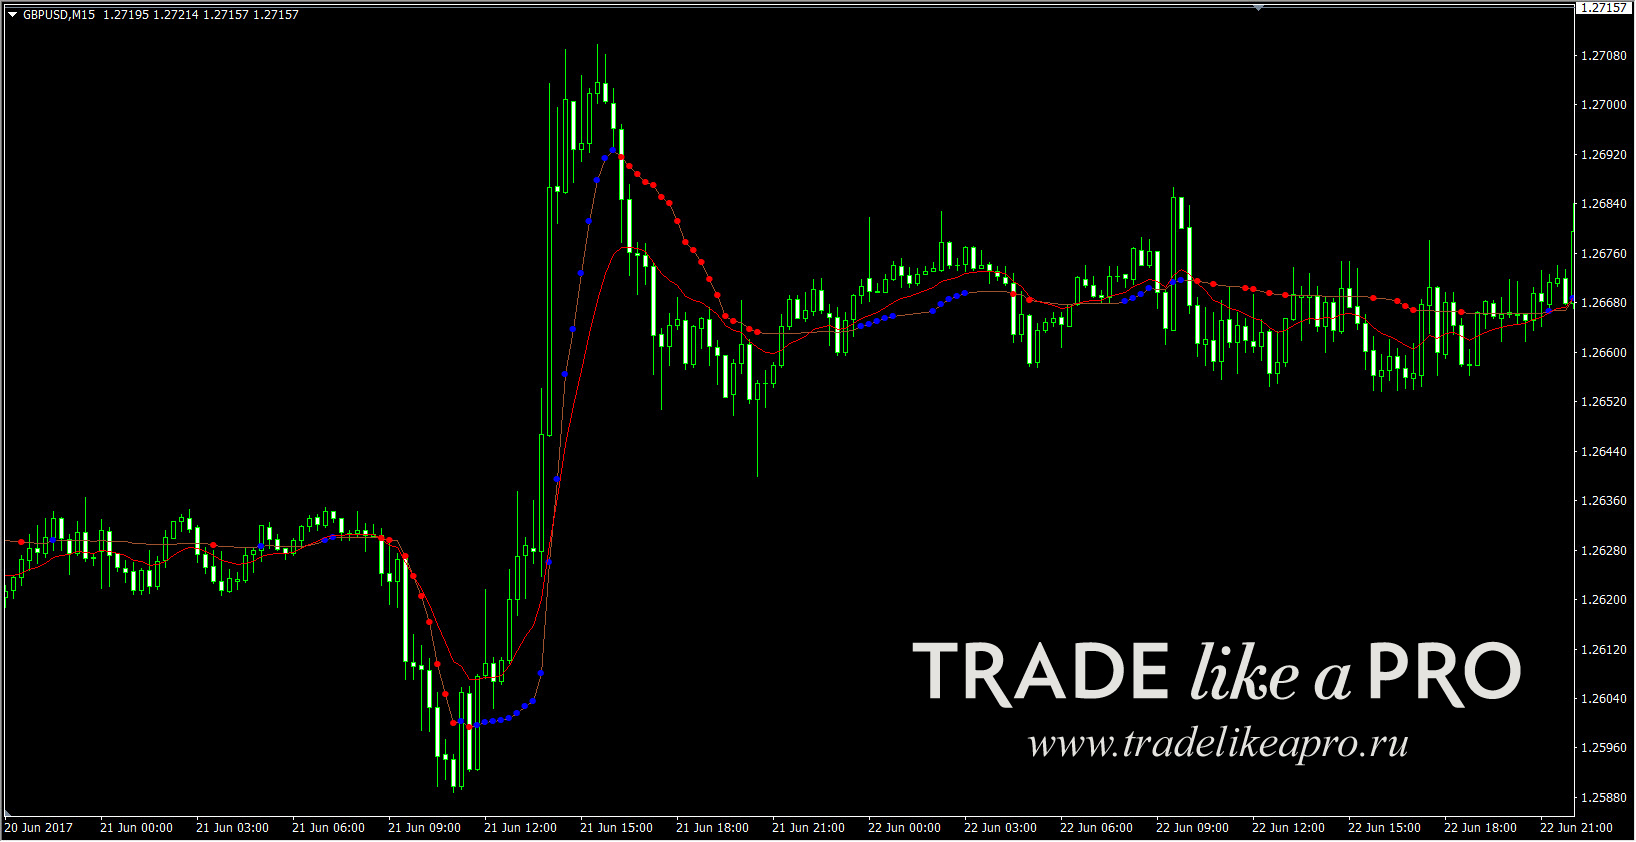 As can be seen from the picture, AMA reacts much faster to strong price changes than a simple MA. However, it is also clear that during small (short-term) changes, the advantage remains with the simple moving average. From this follows a simple conclusion, also voiced by the creator of the indicator: profitable work in the market requires trending moves. When the market is in a channel, when there is no clearly expressed trend, other trading strategies should be used. That is, no one has canceled the trader's work; blindly trusting and relying on a single indicator alone is unacceptable. Proper analysis and determining whether the market is in trend or flat comes with practice and experience: the more trades, the easier it becomes.
The formula for calculating Kaufman's moving average looks like this:
ER(i) = Signal(i)/Noise(i)
where:
ER(i) — the current value of the efficiency ratio; Signal(i) = ABS(Price(i) - Price(i - N)) — the current value of the signal, the absolute value of the difference between the current price and the price N periods ago; Noise(i) = Sum(ABS(Price(i) - Price(i-1)),N) — the current value of the noise, the sum of the absolute values of the difference between the current period price and the previous period price over N periods.
With a strong trend, the efficiency ratio (ER) will tend toward 1; in the absence of directional movement, it will be slightly above 0. The resulting ER value is used in the exponential smoothing formula:
EMA(i) = Price(i) * SC + EMA(i-1) * (1 - SC)
where:
SC = 2/(n+1) — the EMA smoothing constant, n — the period of the exponential moving average; EMA(i—1) — the previous EMA value.
It is necessary that the smoothing coefficient for a fast market be the same as for an EMA with a period of 2 (fast SC = 2/(2+1) = 0.6667), and for a period with no trend the EMA period should be 30 (slow SC = 2/(30+1) = 0.06452). Thus, a new variable smoothing constant (scaled smoothing constant) SSC is introduced:
SSC(i) = (ER(i) * ( fast SC - slow SC) + slow SC
or
SSC(i) = ER(i) * 0.60215 + 0.06425
For a more effective impact of the resulting variable smoothing constant on the averaging period, Kaufman recommends squaring it.
The final formula for the calculation:
AMA(i) = Price(i) * (SSC(i)^2) + AMA(i-1)*(1-SSC(i)^2)
or (after transformation):
AMA(i) = AMA(i-1) + (SSC(i)^2) * (Price(i) - AMA(i-1))
where:
AMA(i) — the current AMA value; AMA(i—1) — the previous AMA value; SSC(i) — the current value of the variable smoothing constant.
The indicator was developed to solve two contradictions: the problem of random price spikes, which can be interpreted as the beginning of a new trend; on the other hand, excessive smoothing leads to lagging readings. One piece of the author's advice can be applied not only to working with his indicator, but to trading in general: develop your own trading approach (rather than taking something ready-made; moreover, the approach itself can be ridiculously simple, one indicator and one oscillator) and test it on historical data. It sounds absurdly banal and primitive, yet it works. In addition, Mr. Kaufman uses the Exel program to test his approaches.
How to apply it? As for the practical use of the indicator in trading, there will be nothing new here: it is buying when the indicator is directed upward and the price is above the indicator, and mirror-opposite conditions for selling. However, in practice such trading will produce quite a few small losing trades. The developer himself understood this as well, so as a filter he suggests using another technical indicator, StandartDeviation. Approximately this is what should result: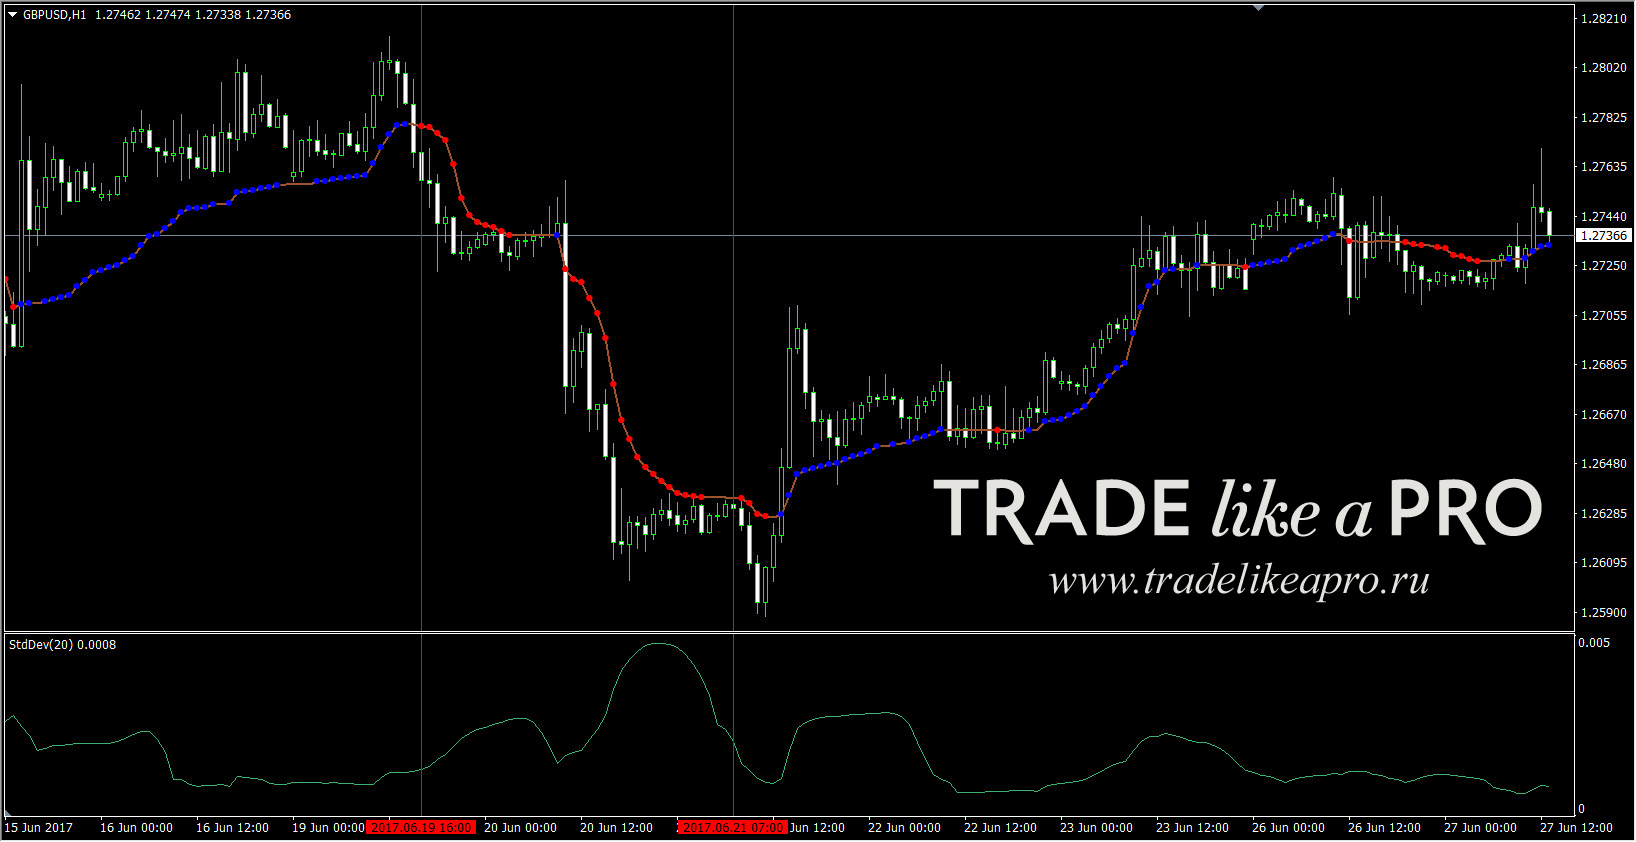 A sell signal: AMA is directed downward, the price is below the MA. The StdDev indicator is rising. As soon as it starts to decline, this is one of the signals that most likely the trend is ending, an opportune moment to exit the position. A stop order can be placed beyond the last local maximum, and take profit can be set at twice that distance. Agree, all of this is very simple. And nevertheless effective. By the way, Kaufman himself also recommended experimenting with indicator settings for different markets and instruments. And there is no doubt at all that this is a highly effective tool.
Double Exponential Moving Average
 Double Exponential Moving Average (DEMA) - a double exponential moving average. Indicator developer: Patrick Malloy (Patrick G. Mulloy), published it in 1994 in his article “Smoothing Data with Faster Moving Averages” (in the February issue of “Technical Analysis of Stocks & Commodities”). Here is what the author wrote about his development: “Moving averages have one drawback, delay time, which increases as the period of moving averages increases. As a solution, a modified version of exponential smoothing was created with lower delay-time costs...” The calculation formula is the difference between a doubled single EMA and a twice-smoothed EMA of the same series, and it looks like this:
DEMA(i) = EMA(Price, N, i) + EMA(err, N, i) = EMA(Price, N, i) + EMA(Price - EMA(Price, N, i), N, i) =
= 2 * EMA(Price, N, i) - EMA(Price - EMA(Price, N, i), N, i) = 2 * EMA(Price, N, i) - EMA2(Price, N, i)
where:
EMA(err, N, i) — the current value of the exponential average of the error err; EMA2(Price, N, i) — the current value of double sequential smoothing of price.
Here, the EMA with the same period is subtracted from the doubled EMA value, but it is built not from closing prices (as usual), but from the values of the same EMA itself (that is, using double smoothing). As a result, the lag is less than the lag of each average separately, and that is the indicator's advantage. The indicator settings include only the moving-average period.
In the screenshot below, the red SMA 14 is compared with DEMA 14:
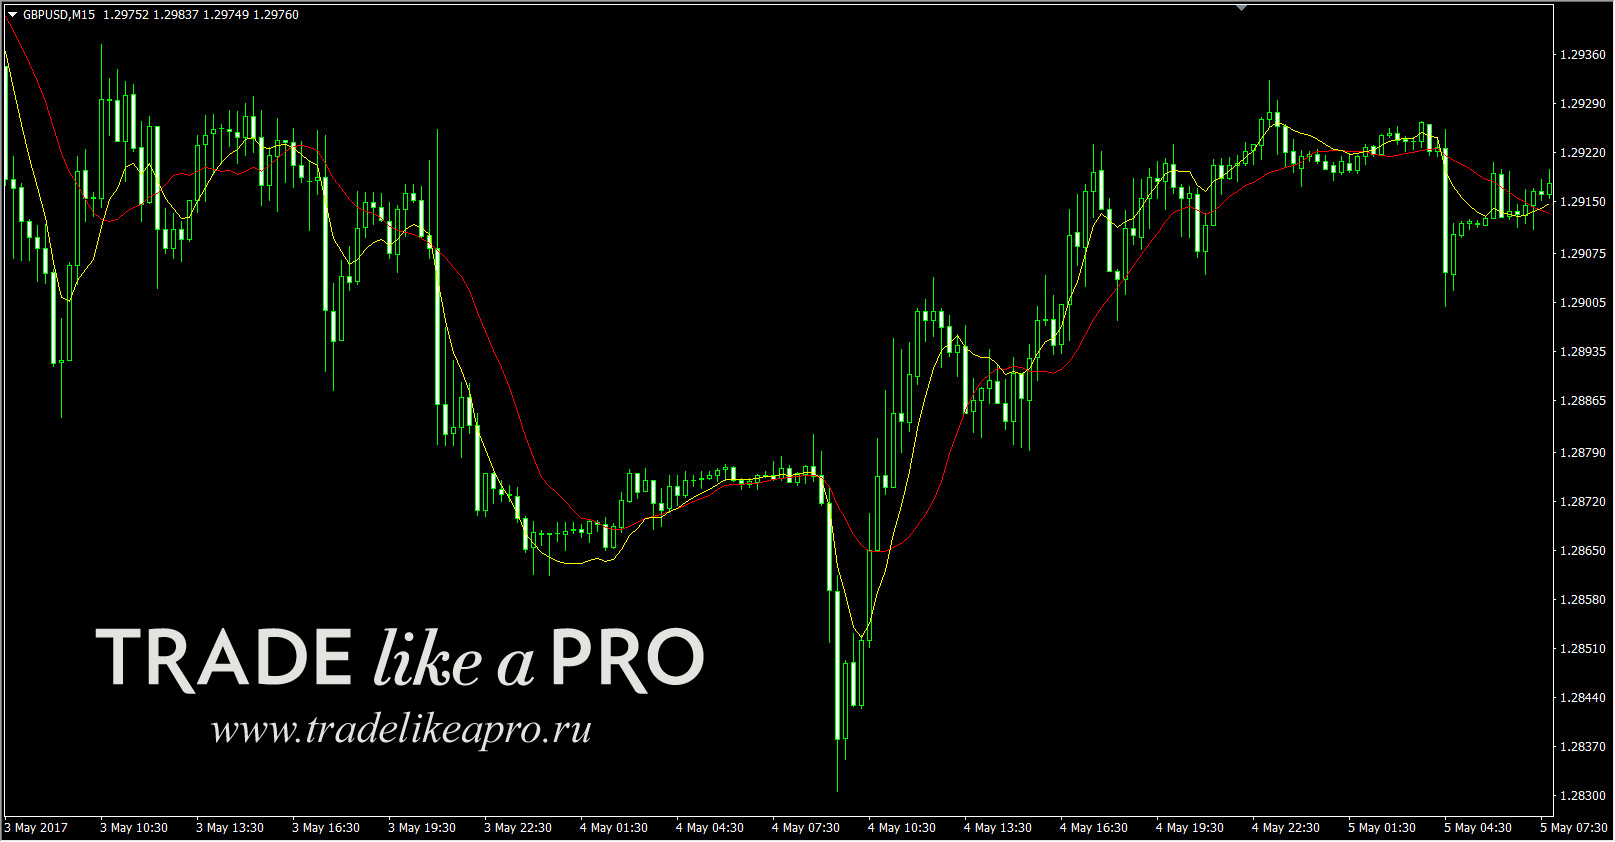 How to apply it? Let us compare DEMA and EMA, one of the best moving averages available in the MetaTrader 4 terminal:
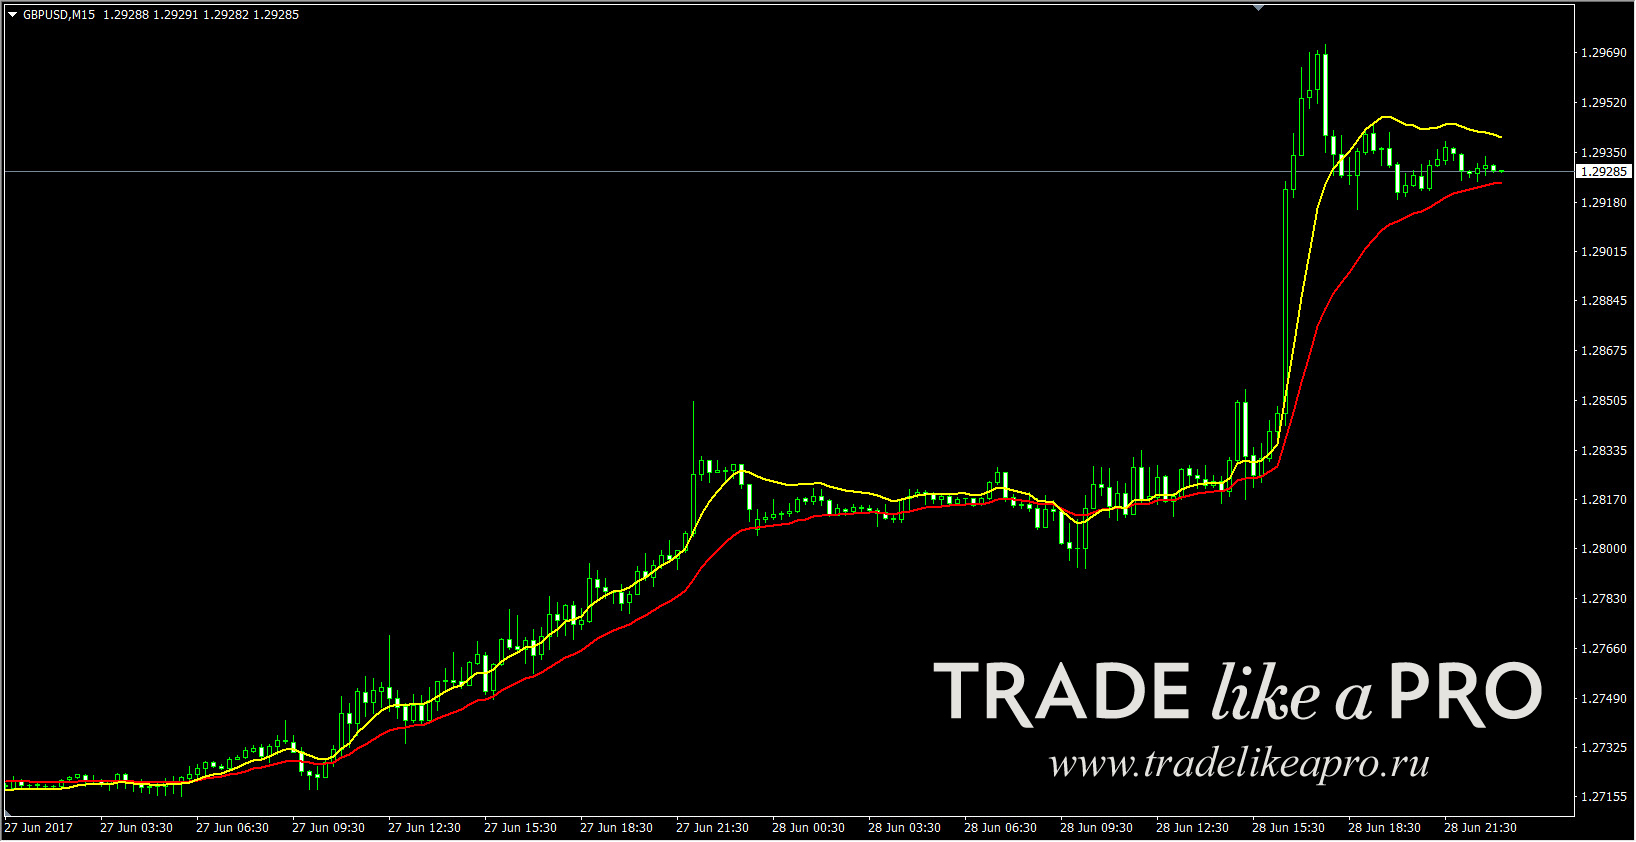 In both cases, the period is 20. I think everything is already clear here: DEMA (yellow) reacts to price changes much faster; it is much closer to price than EMA (red). For example, if you use DEMA as an external indicator for trailing a profitable position with an auxiliary advisor, the trade will be closed earlier and the profit will be greater than if you used EMA. Of course, one should not forget about the market here, but having a full set of tools for every occasion will not be superfluous.
In addition, the DEMA indicator itself can be used to smooth the readings of other indicators based on moving averages, for example MACD, DEMA_MACD (you can look at it in the corresponding topic). According to Patrick Malloy's test results, it turned out that the same MACD using DEMA, although it gives fewer signals, significantly improved their positive follow-through. Thus, the double EMA is a very interesting tool and one worthy of the closest possible examination.
FRAMA
 FRAMA is a Fractal Adaptive Moving Average indicator developed by John Ehlers (John Ehlers). Ehlers is the author of several books and technical indicators (for example RVI).
 Comparison of the FRAMA indicator with SMA14:
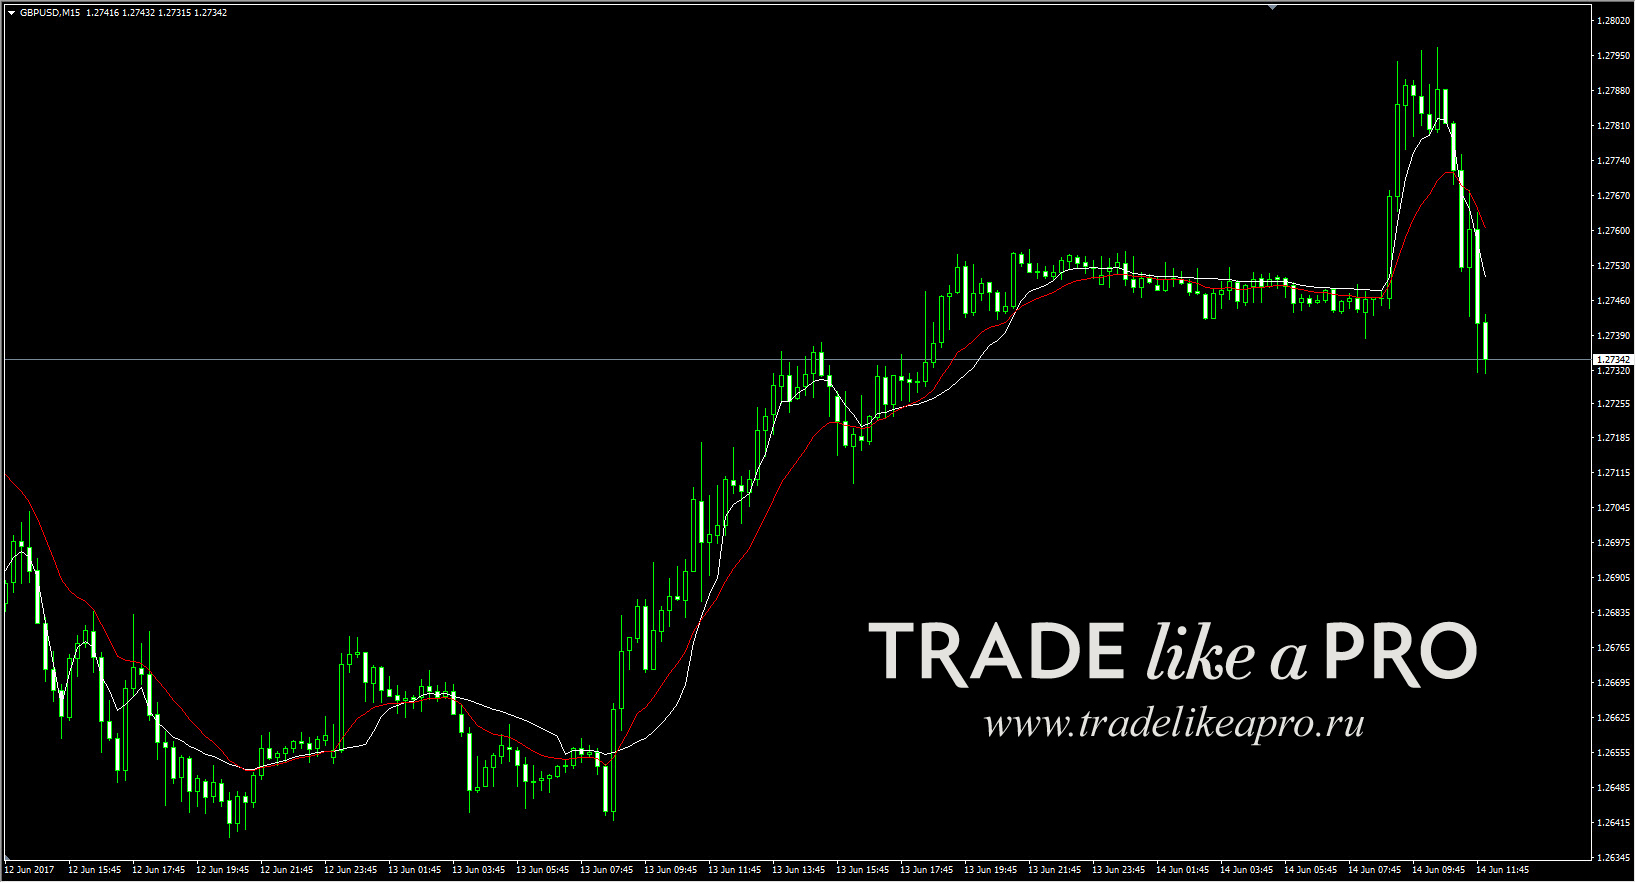 The indicator is based on the EMA algorithm. The indicator's main advantage is that it responds well to large trends, and during a flat it stops sharply, which is exactly what can be seen in the screenshot. As for the calculation formula, it looks like this:
FRAMA(i) = A(i) * Price(i) + (1 - A(i)) * FRAMA(i-1)
where:
FRAMA(i) — the current FRAMA value; Price(i) — the current price; FRAMA(i-1) — the previous FRAMA value; A(i) — the current exponential smoothing factor.
The exponential smoothing factor is calculated by the formula:
A(i) = EXP(-4.6 * (D(i) - 1))
where:
D(i) — the current fractal dimension; EXP() — the mathematical exponential function.
The fractal dimension of a straight line equals one. It is clear from the formula that if D = 1, then A = EXP(-4.6 *(1-1)) = EXP(0) = 1. Thus, if the price changes linearly, exponential smoothing is not used, because in this case the formula looks as follows:
FRAMA(i) = 1 * Price(i) + (1 — 1) * FRAMA(i—1) = Price(i)
That is, the indicator follows the price exactly.
As for the indicator settings, there are only two of them: selecting the period and selecting the price for calculation (0 - closing price; 1 - opening price; 2 - high price; 3 - low price; 4 - median price; 5 - typical price; 6 - weighted closing price). As for the use of fractals to calculate the moving average readings, it should not be confused with Bill Williams' fractals - they have nothing in common.
How to apply it? In trading, FRAMA is used like all trend indicators. To filter false signals, it is necessary to use some kind of oscillator, and the developer of the indicator himself also says this. If you are tired of the standard MT4 tools, you can find something unusual and interesting here.
Hull Moving Average
 The Hull Moving Average (HMA) indicator is the Hull moving average. The author is the Australian trader, mathematician, financier, and analyst Alan Hull (Alan Hull).
 According to Alan himself, he was working on a completely different indicator when he became interested in the problem of the moving average lagging behind price, and as a result this indicator appeared (in 2005). The calculation formula looks like this:
To understand how the HMA removes lag from price, let us look at the following example: 0+1+2+3+4+5+6+7+8+9/10=4.5; As a result, the average value is 4.5, which is quite far from the last price value (9). And in practice we will see a fairly strong lag of the indicator behind the candles on the chart. Alan Hull proposed reducing the lag as follows: 5+6+7+8+9/5=7, which is already much closer to the current price (7 is much closer to 9 than 4.5 is to 9). Next, Alan added to the number the difference between the two average numbers (7-4.5=2.5) and as a result got (7+2.5=9.5) 9.5 - even slightly more than the current price 9, resulting in a very good balance between lag and smoothing. The problem of the moving average lagging behind price was practically eliminated. Compared with the regular SMA (14) from MT4 (red color), the HMA gives a possible entry signal much earlier, and it also changes its color for uptrends and downtrends, which can be convenient compared with a regular indicator.
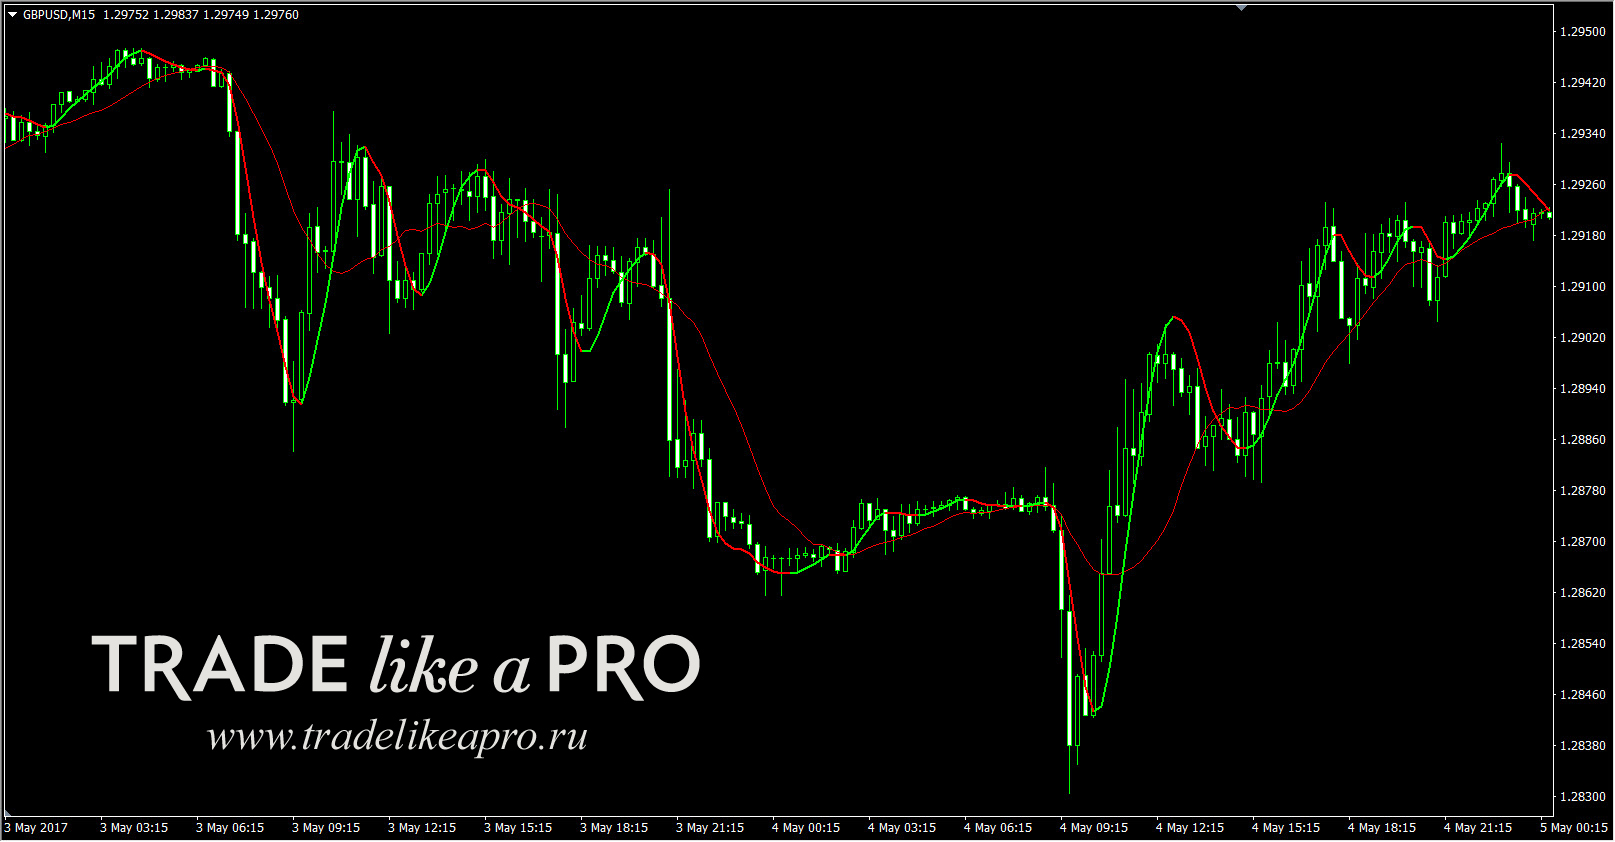 How to apply it? Let us look at the settings of this indicator:
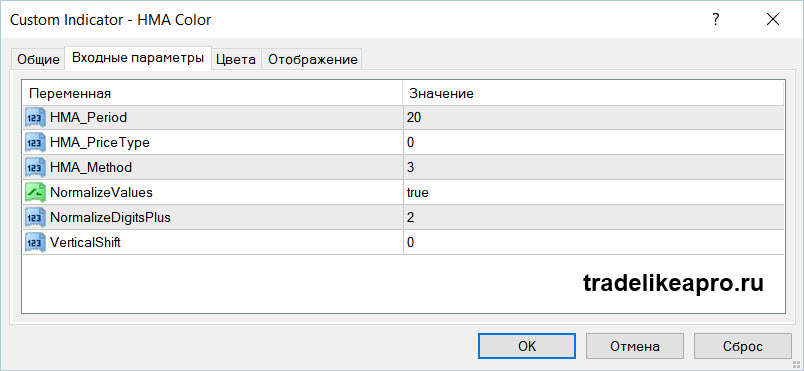 What they mean is below:
- HMA _ Period – the period of the Hull moving average (default 20);
- HMA _ PriceType – apply the moving average calculation to a price value (default Close). Entered as numbers (0 - Close; 1 - Open; 2 - High; 3 - Low; 4 - Median Price; 5 - Typical Price; 6 - Weighted Close);
- HMA_Method – the method for calculating the Hull moving average (default linear weighted). Entered as numbers (0 – Simple; 1 – Exponential; 2 – Smoothed; 3 – Linear Weighted);
- NormalizeValues – value normalization (this parameter can be neglected and left at its default, since it does not greatly affect the indicator readings; the same also applies to the parameter below, NormalizeDigitsPlus);
- VerticalShift – moving average vertical shift, the value is set in points.
We have a detailed review of this indicator on the site, including a video lesson and examples of how it works. You can view it here.
Jurik Moving Average
 The Jurik Moving Average (JMA) indicator was developed by Mark Jurik (Mark Jurik) in 1998. Mark Jurik is the founder of Jurik Research; in the late 1980s and early 1990s he managed to work for the U.S. army, and because the Cold War ended, his developments and research proved useful in the financial sphere, where he mainly works now. In fact, he is also the author of technical indicators, for example RSX and some others.
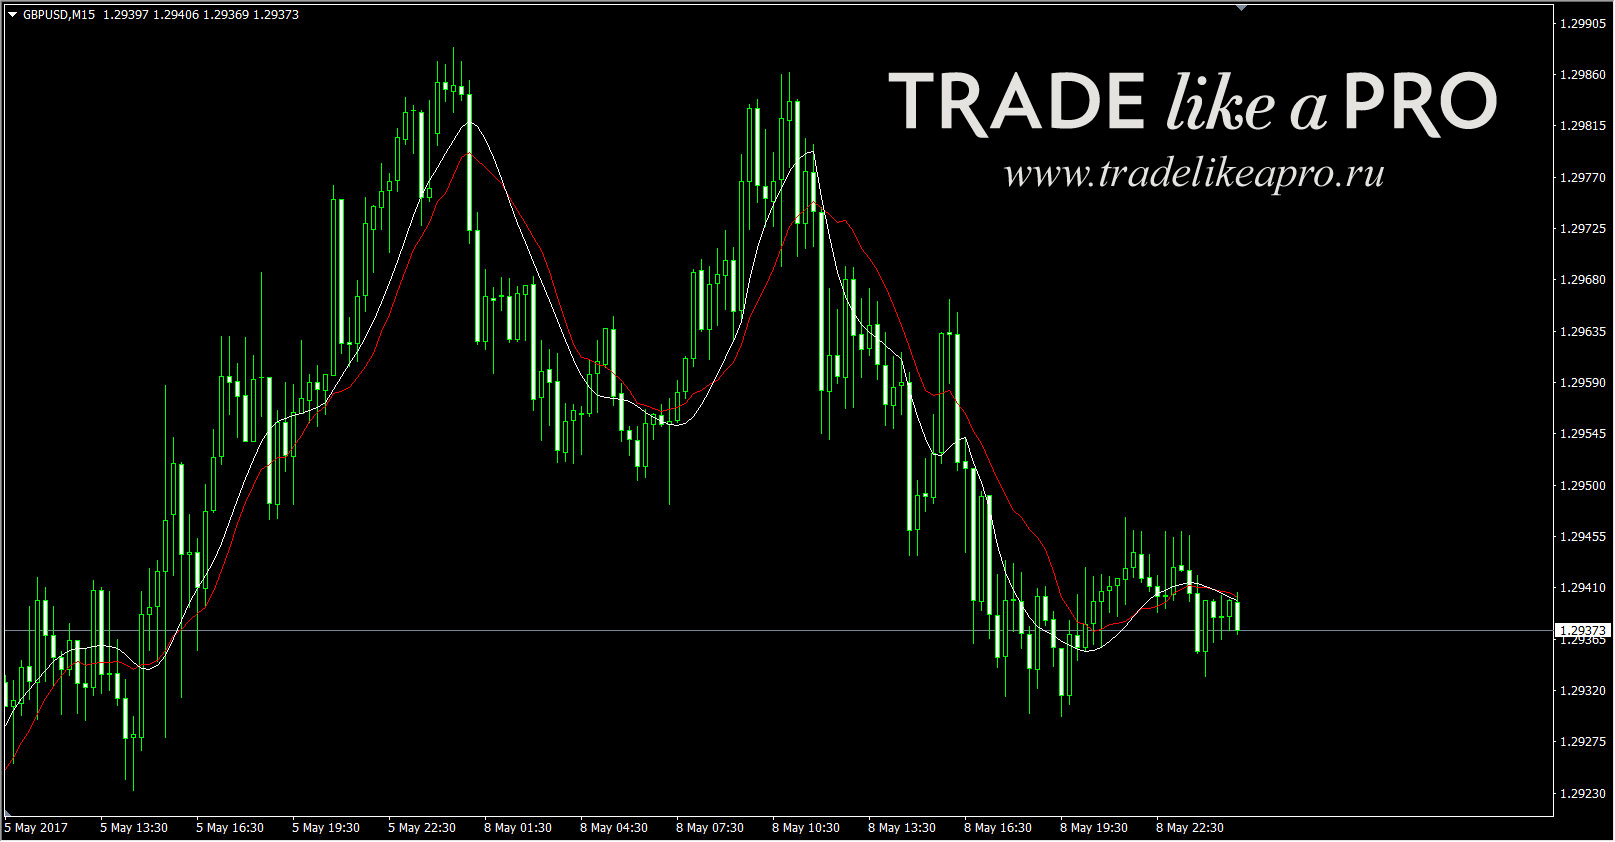
 Compared with the red SMA 14, the JMA 14 signals a trend change earlier:
 Unfortunately, it was not possible to find the formula for calculating the JMA indicator anywhere - apparently it is a secret. But it is worth mentioning the indicator settings.
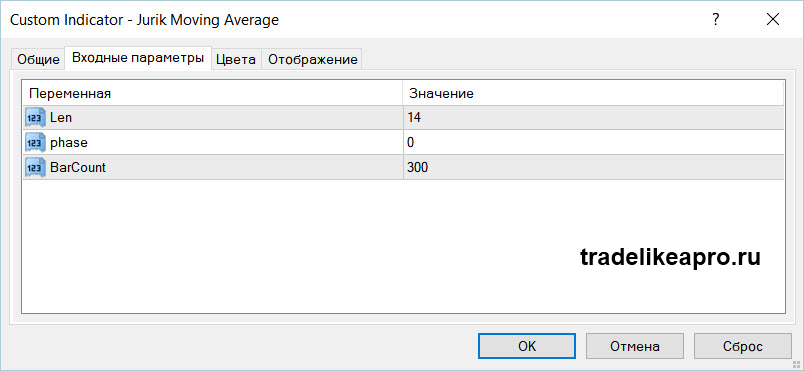 There are only three of them:
- Len - the indicator period, default 14;
- Phase - with this parameter you can try to find a compromise between two opposite properties of the indicator: lag or flying beyond the price - values can be from -100 to +100 (see the screenshot below);
- BarCount - the number of bars for calculating the readings.
Once again regarding the Phase parameter - what it affects and how it is visually seen on the chart:
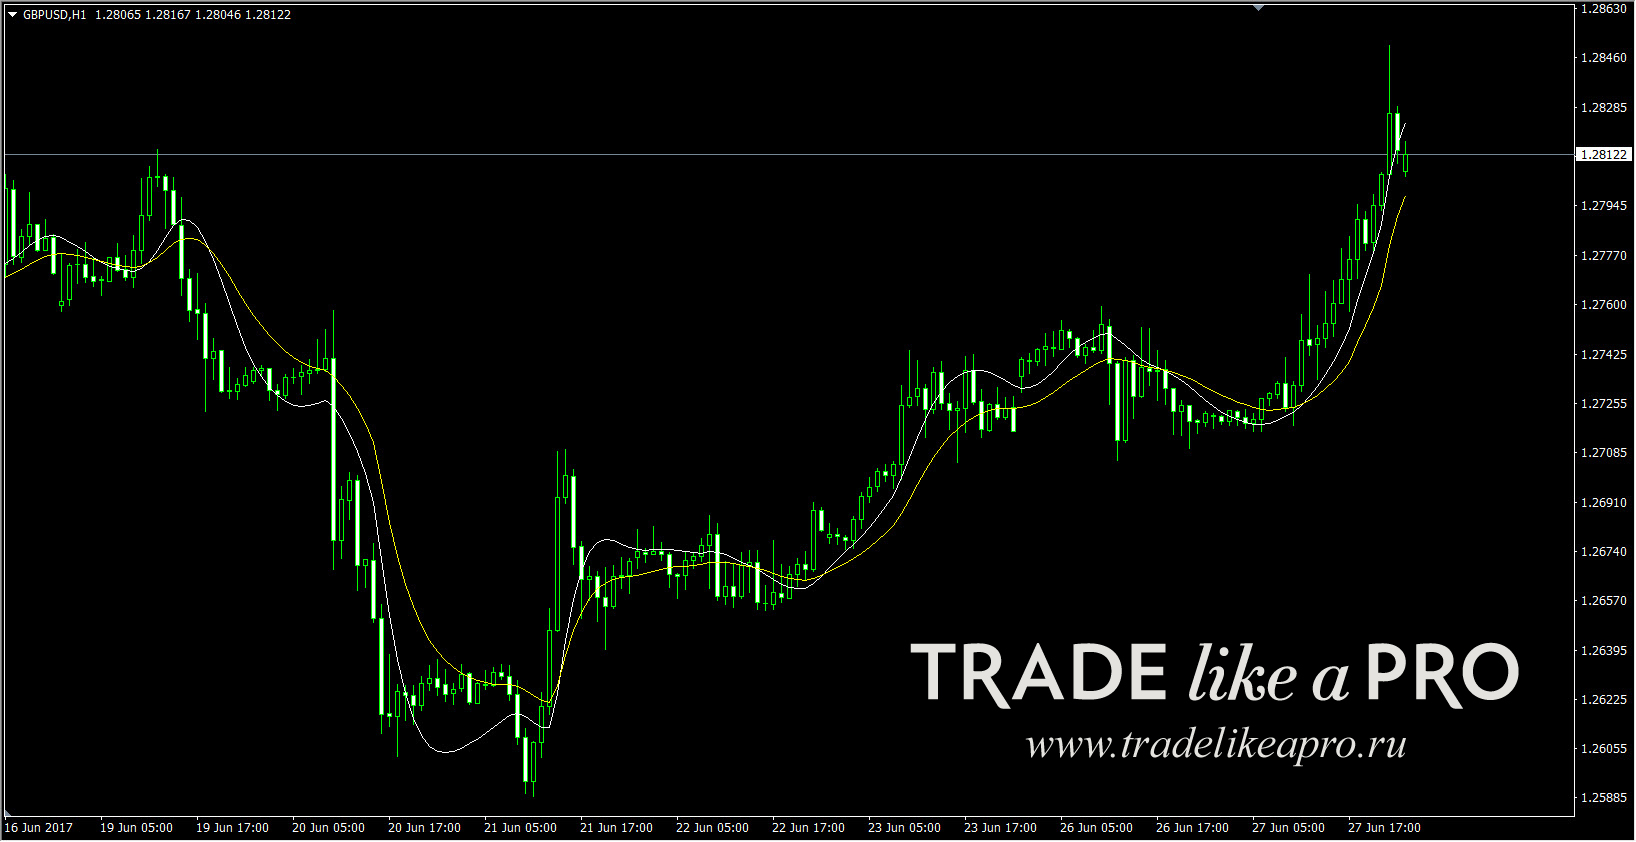 The screenshot shows two JMAs: the white one has a Phase setting of +100 - the moving average is closer to the price during a trending move, but when the trend ends and a reversal occurs, this moving average flies far beyond the price movement - the market is already going in the other direction, while the indicator continues to show the old one. Unfortunately, no one has yet managed to solve such a problem. The yellow JMA has a Phase setting of -100, and it reacts more slowly to price changes. Thus, the trader has a choice: either use the earliest signal and at the same time observe "false" indicator readings during the end of the trend, or use the opposite approach. If neither situation is critical, then this parameter can be left untouched altogether.
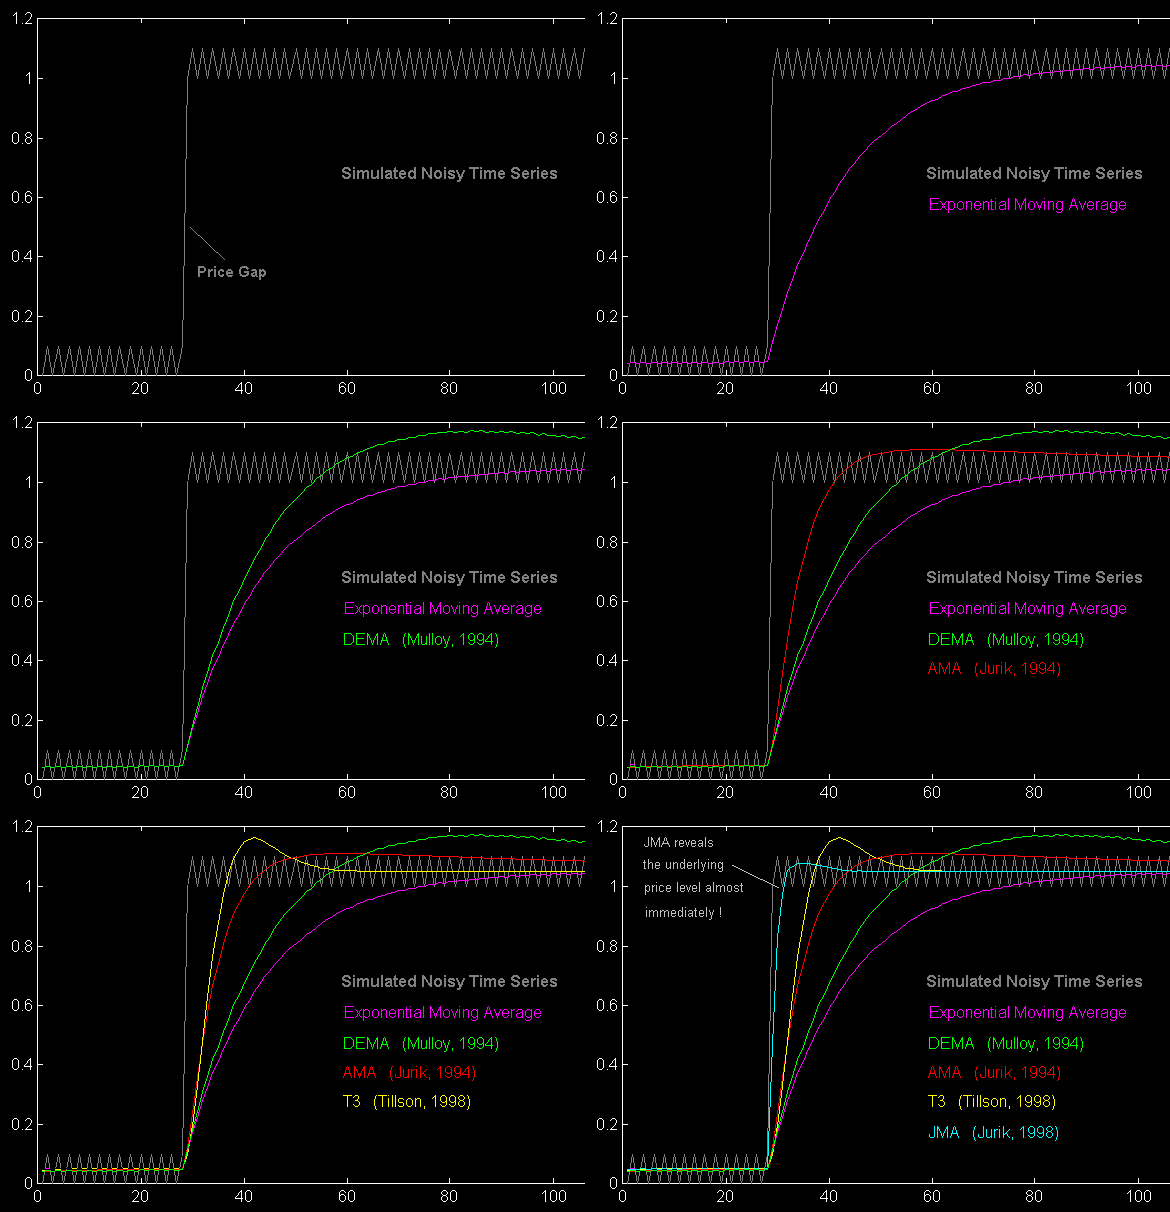
How to apply it? JMA is one of the very best technical indicators in its class. No, of course it is not a holy grail that allows you to earn 100500% profit per day, but the problems with lag and with the indicator reacting to unnecessary noise are solved here as well as possible. A small gif animation from the author's site showing how different types of moving averages react to a gap:
 Let us not be lazy and install all the moving averages shown in our terminal (keeping their colors) and take a look (period 14 everywhere):
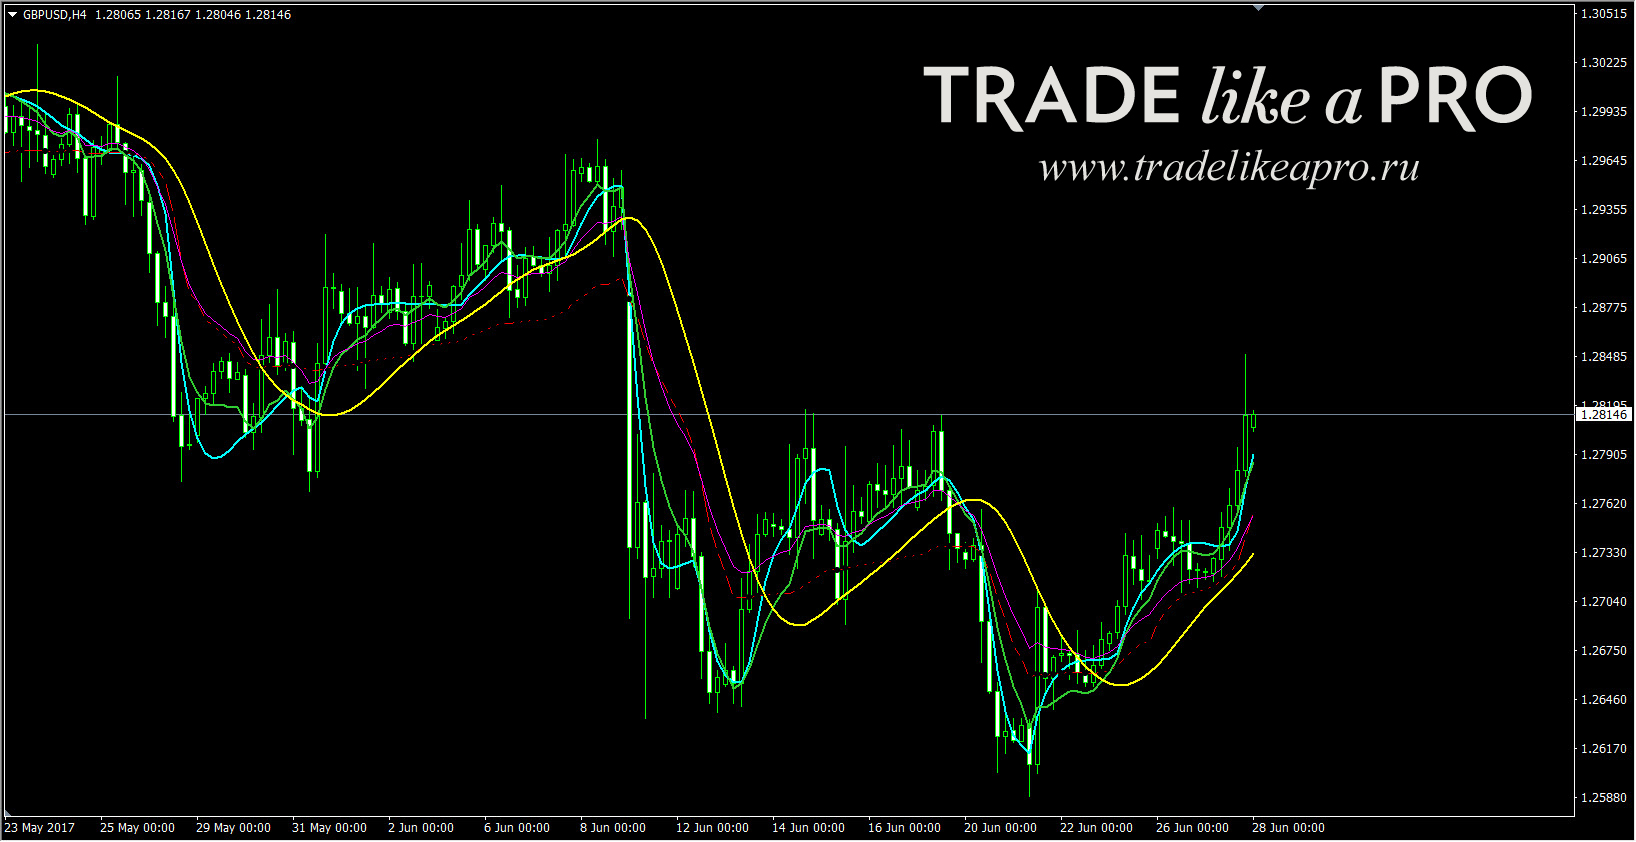 Indeed, Mark Jurik's moving average is almost always closer to the price than other MAs. Well, in some places there is "competition" from the double exponential EMA (green color).
If we compare the popular exponential moving average (red) with the JMA (white), then the advantage of the latter will be here as well:
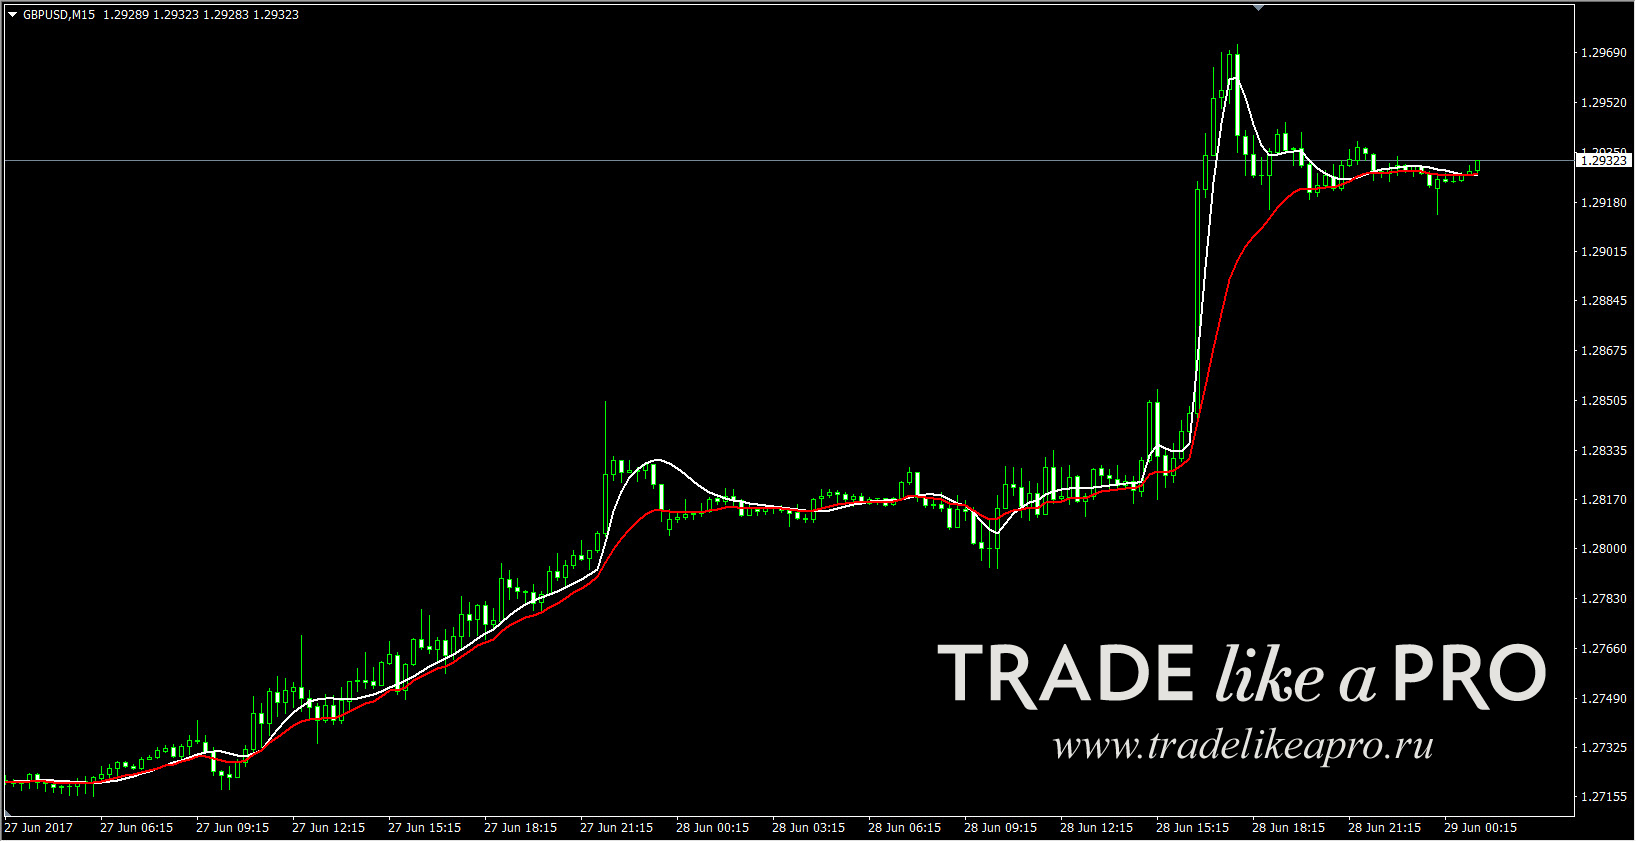 Another example of why it is better to use JMA rather than the standard MT4 moving averages:
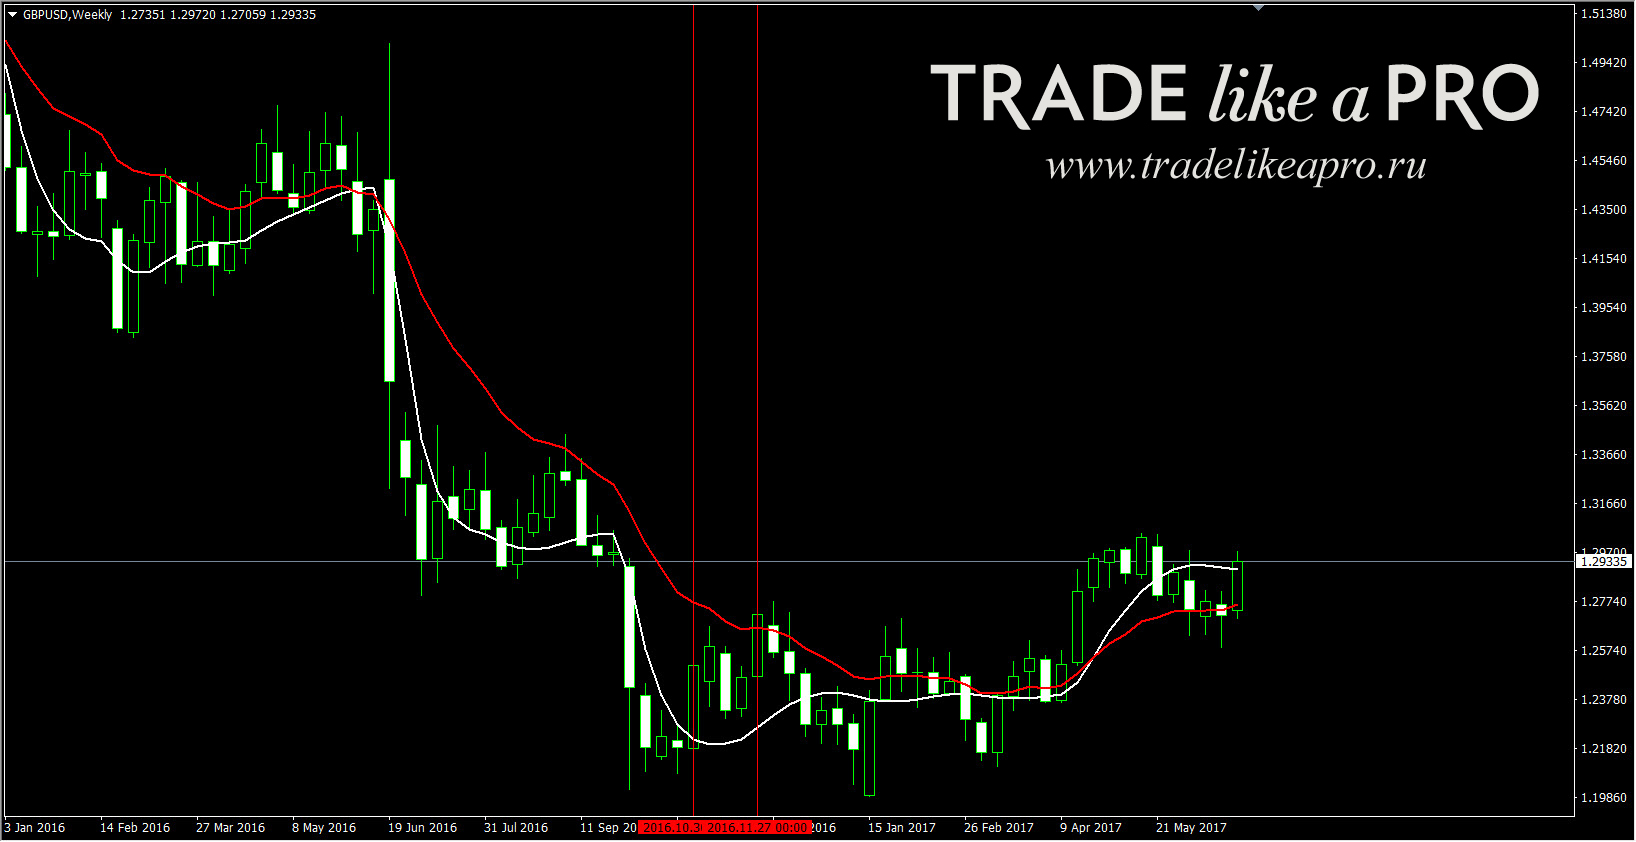 If you take MA readings into account when exiting a trade, then it is better to exit earlier with a larger profit (in points) than to wait a full four (!) weeks and lose part of the profit in the process (the screenshot shows the W1 timeframe). In skillful hands, this will be a very powerful weapon.
Triple Exponential Moving Average
 The Triple Exponential Moving Average (TEMA) indicator is a triple exponential moving average, also developed by Patrick Mulloy (Patrick G. Mulloy) and published in the magazine "Technical Analysis of Stocks & Commodities". The calculation principle is similar to the DEMA indicator. In general, the TEMA formula looks like this:
First, DEMA is calculated, then the price deviation error from the DEMA indicator values is calculated:
err(i) = Price(i) - DEMA(Price, N, ii)
where:
err(i) - the current DEMA error; Price(i) - the current price; DEMA(Price, N, i) - the current DEMA value of the Price series with period N.
Let us add the value of the exponential average of the error to the DEMA value and obtain TEMA:
TEMA(i) = DEMA(Price, N, i) + EMA(err, N, i) = DEMA(Price, N, i) + EMA(Price - EMA(Price, N, i), N, i) =
= DEMA(Price, N, i) + EMA(Price - DEMA(Price, N, i), N, i) = 3 * EMA(Price, N, i) - 3 * EMA2(Price, N, i) + EMA3(Price, N, i)
where:
EMA(err, N, i) - the current value of the exponential average of the err error; EMA2(Price, N, i) - the current value of double sequential price smoothing; EMA3(Price, N, i) - the current value of triple sequential price smoothing.
And, which is an important feature, the indicator is calculated only from the candle closing price. The TEMA indicator on the chart:
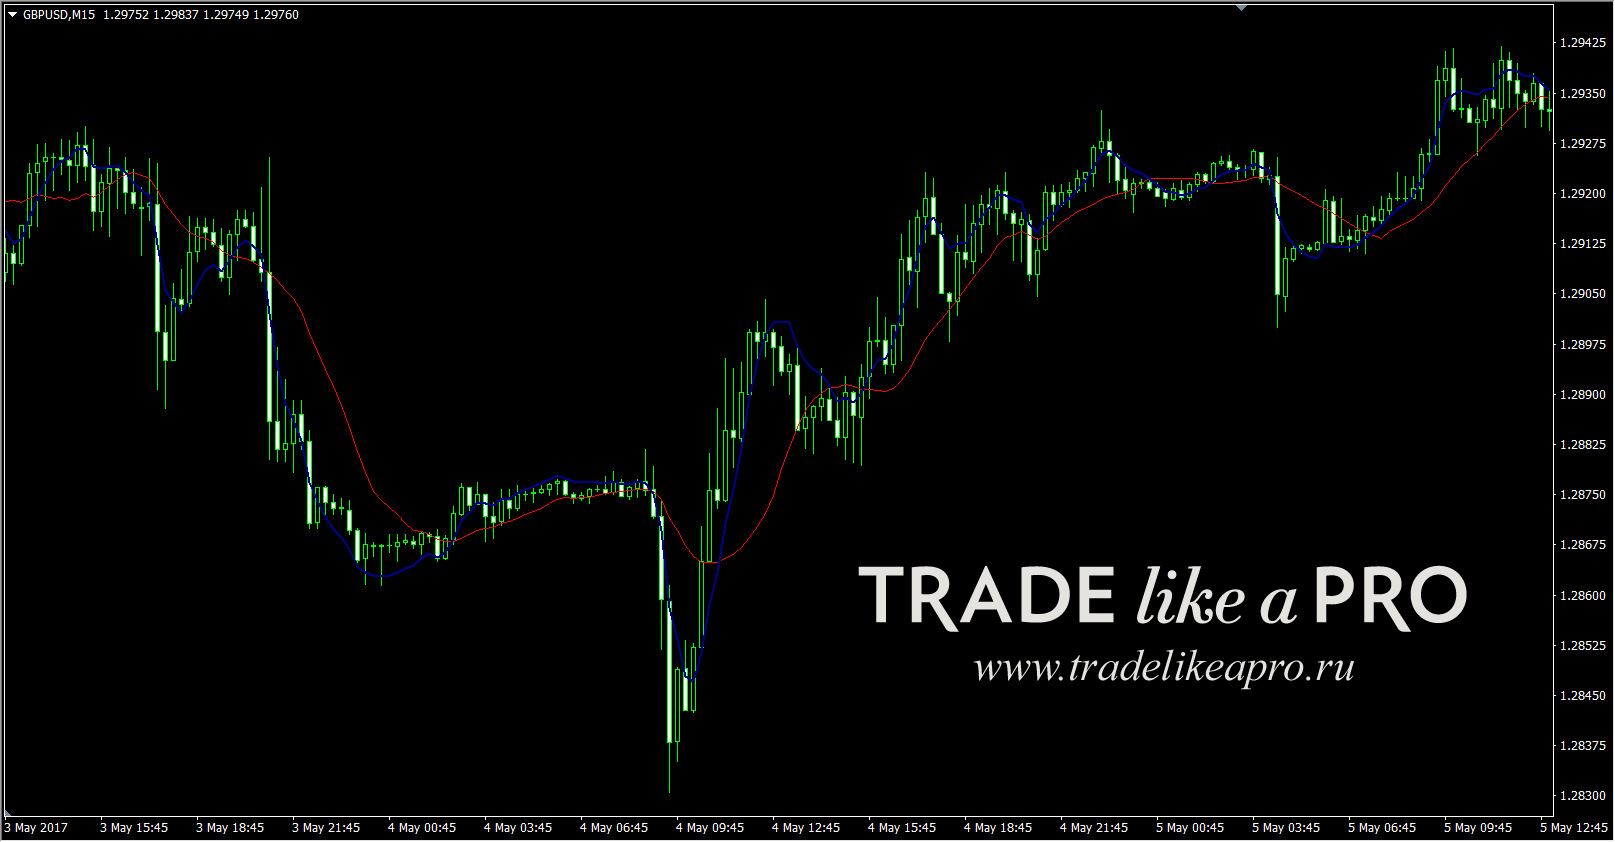 As an example, the regular SMA (14) from the terminal is shown (red color), and the blue line is TEMA (14). Even from this example it is clear that the signal from the triple exponential MA arrives much earlier than from the simple moving average. This was precisely the task pursued by the author-developer, and it should be noted that he succeeded quite well in this matter. In addition to the TEMA indicator, the download archive includes a modified version where you can choose the average smoothing method and apply the calculation to different prices. From the settings of the basic indicator, there is only the choice of the MA period.
How to use it? Let us look at TEMA (white line) and the exponential moving average (red line) from MetaTrader 4:
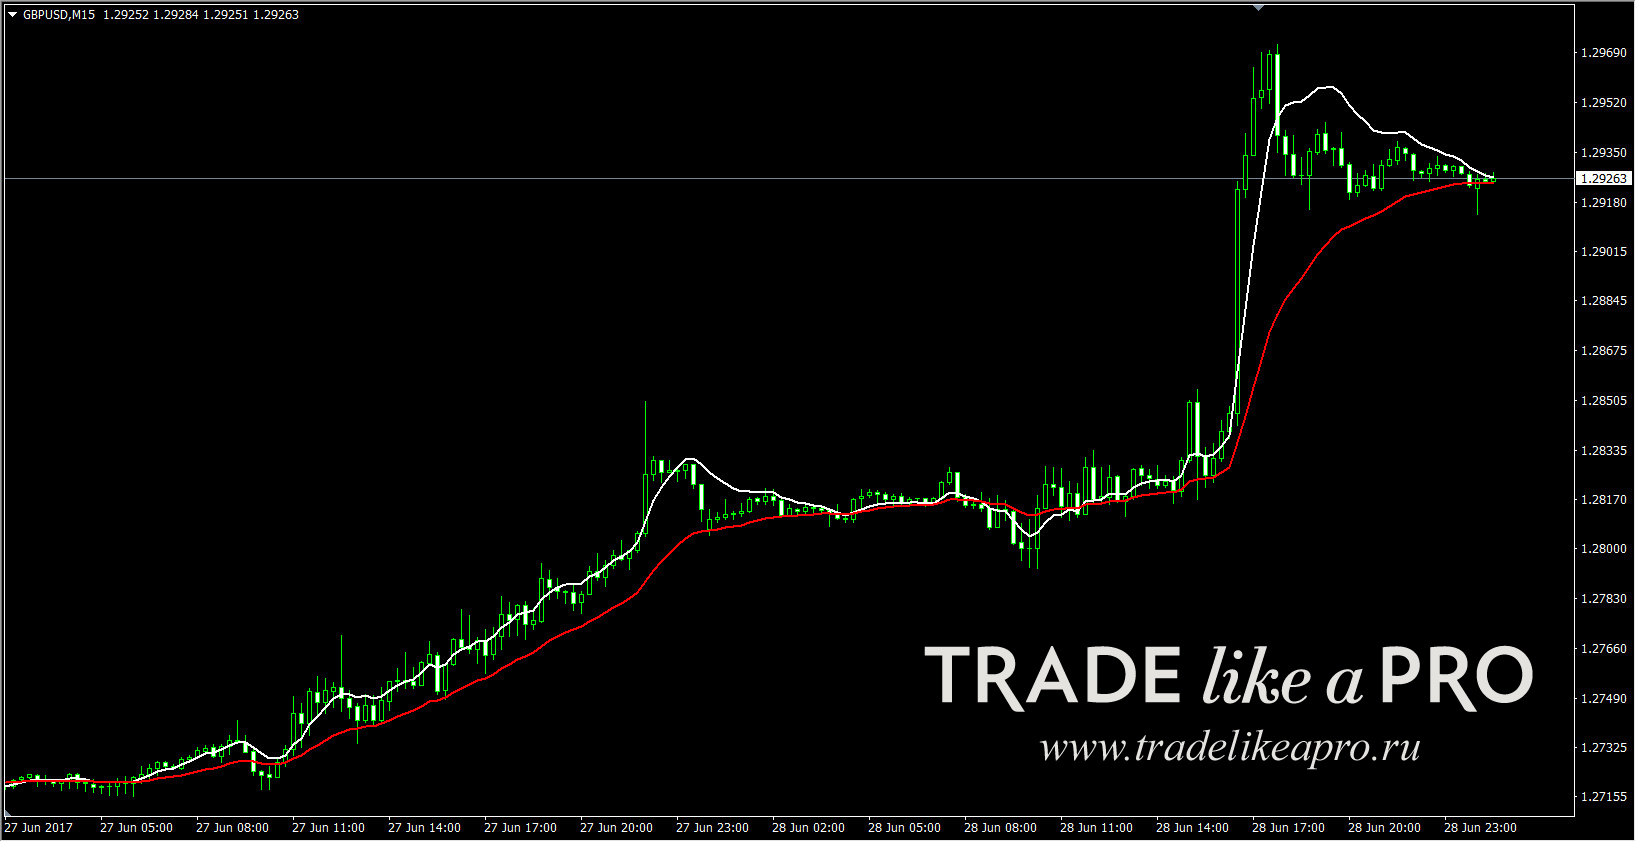 The period is set to 21 in both cases. I think no comments are required anymore - everything is clear from the picture. It would also be useful to compare the double (purple DEMA line) and triple (white TEMA line) exponential moving averages:
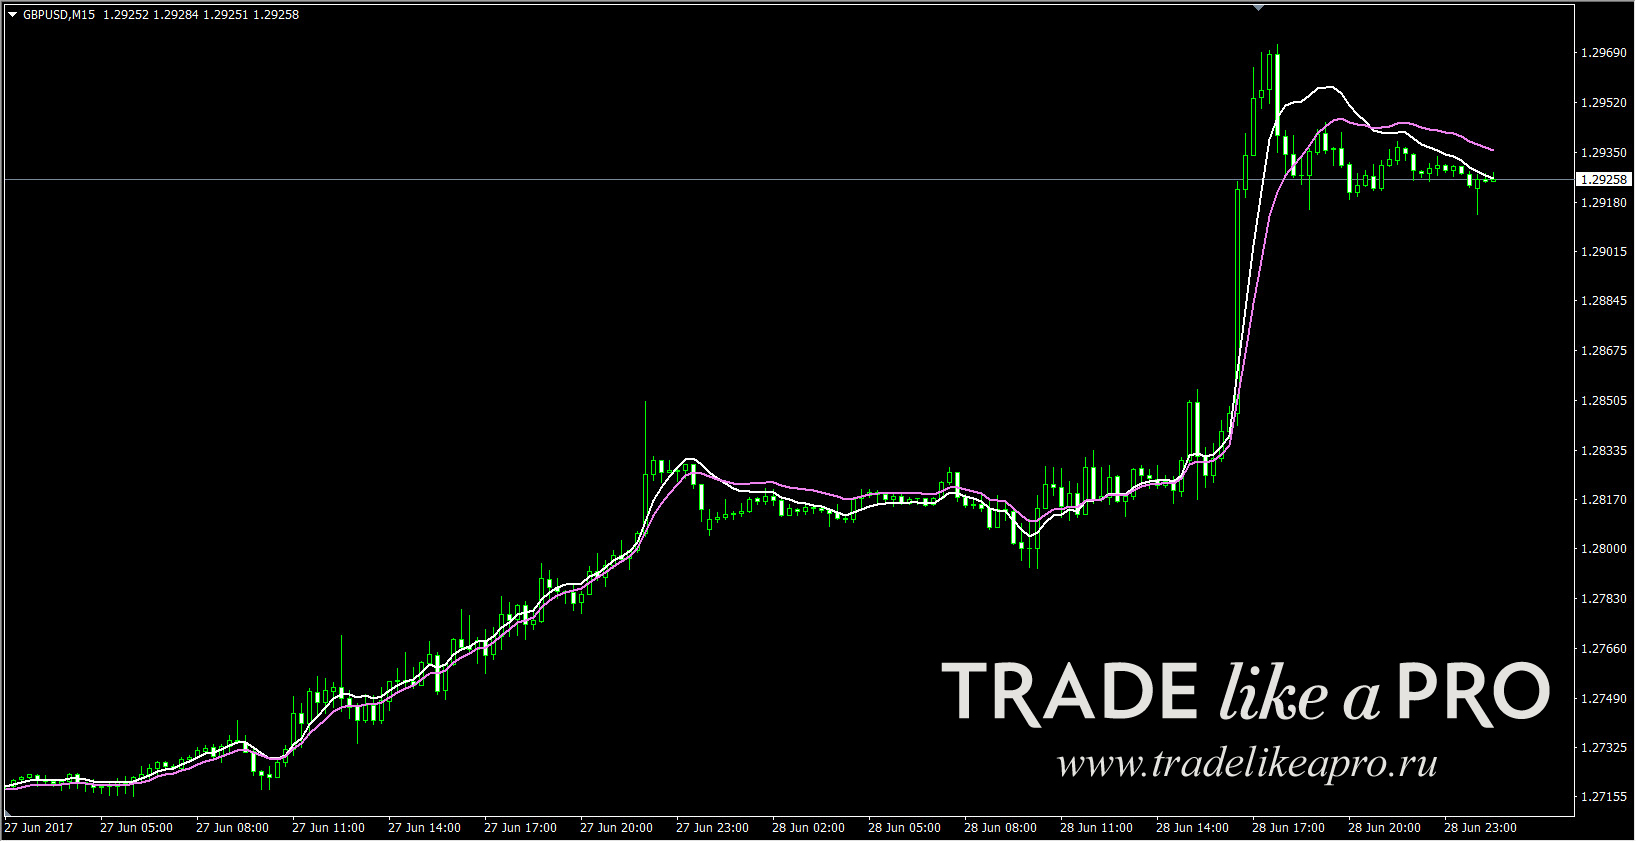 The difference between them is not especially fundamental. As a conclusion, either one can be used/applied in trading. A small nuance is that these indicators are present in the MetaTrader 5 terminal, while for MT4 they are simply not there by default.
Variable Index Dynamic Average
 The Variable Index Dynamic Average (VIDYA) technical indicator is a moving average with a dynamic averaging period. Its author is the American trader and analyst of Indian origin Tushar Chande (Tushar Chande).
 Born in 1958, he is known for his engineering inventions (he holds nine patents), which are used one way or another in the forex field (first of all these are technical indicators, for example the Aroon Oscillator; there are also modifications of the stochastic and some other indicators). He is the author of books and scientific articles on Forex topics. And in 1994 he proposed his own version of a moving average with a dynamically changing averaging period - VIDYA. EMA averaging in his indicator depends on price volatility, and the volatility measure chosen was another oscillator by the same author, the Chande Momentum Oscillator (CMO). The VIDYA calculation formula looks like this:
The value of the Variable Index Dynamic Average is calculated similarly using CMO:
VIDYA(i) = Price(i) * F * ABS(CMO(i)) + VIDYA(i-1) * (1 - F* ABS(CMO(i)))
where:
ABS(CMO(i)) - the absolute current value of the Chande Momentum Oscillator; VIDYA(i-1) - the previous value of VIDYA.
The CMO value is calculated by the formula:
CMO(i) = (UpSum(i) - DnSum(i))/(UpSum(i) + DnSum(i))
where:
UpSum(i) = the current sum of positive price increments for the period; DnSum(i) = the current sum of negative price increments for the period.
VIDYA 14 (compared with the red SMA 14):
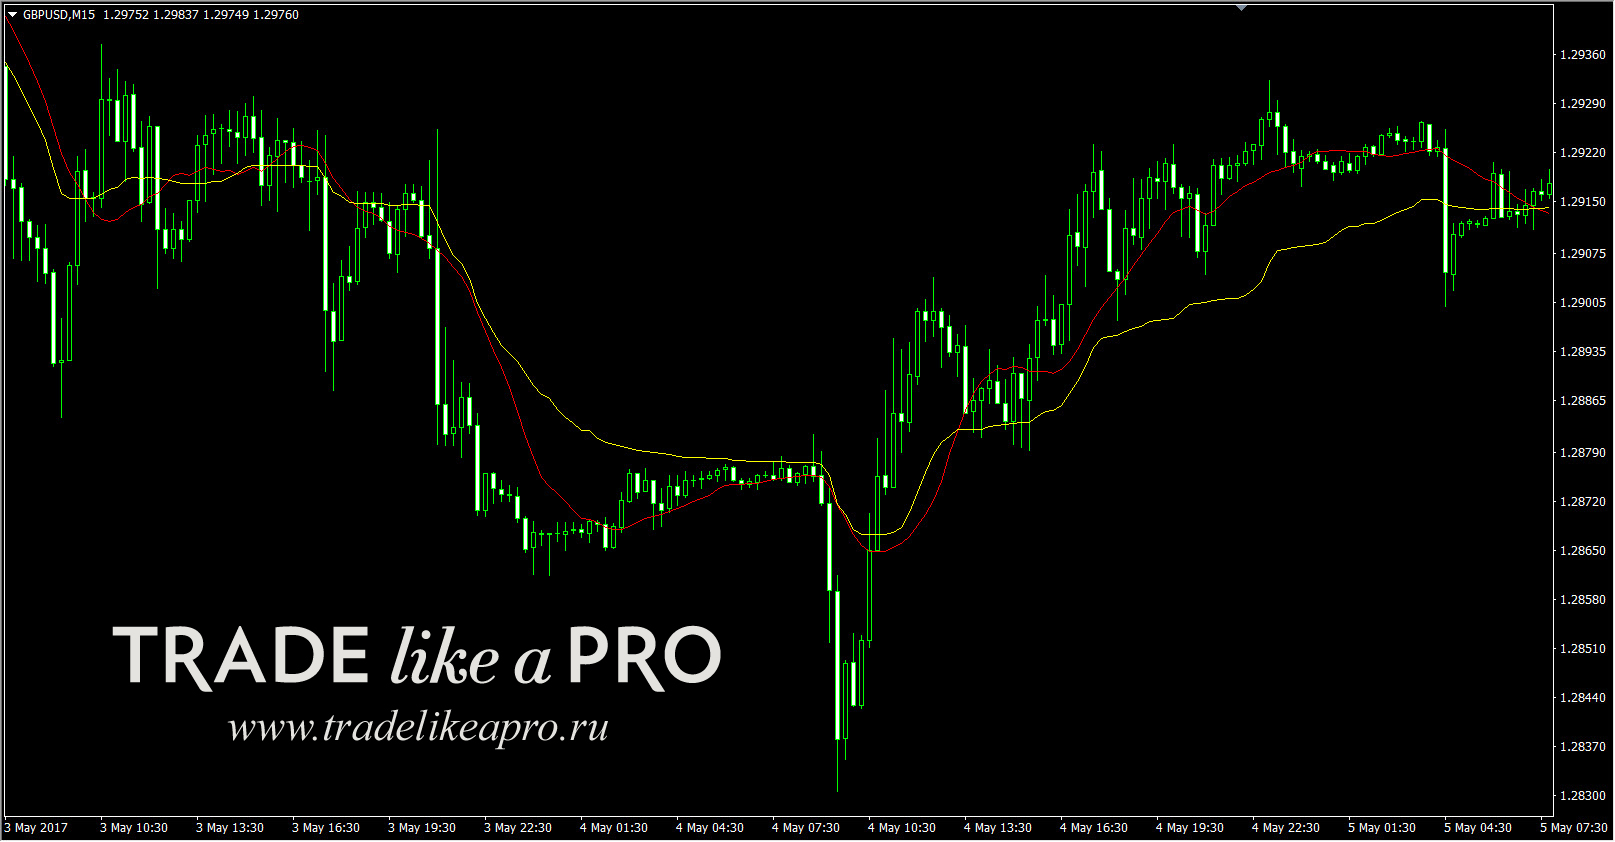 As can be seen from the screenshot, one of the features of the indicator is that it assumes an almost horizontal position after the completion of an upward/downward trend. This feature can be used as a signal to exit a position.
How to use it? As often happens in the world of indicators, there are quite a few different versions and modifications, especially when a thing becomes popular. And this is exactly such a case:
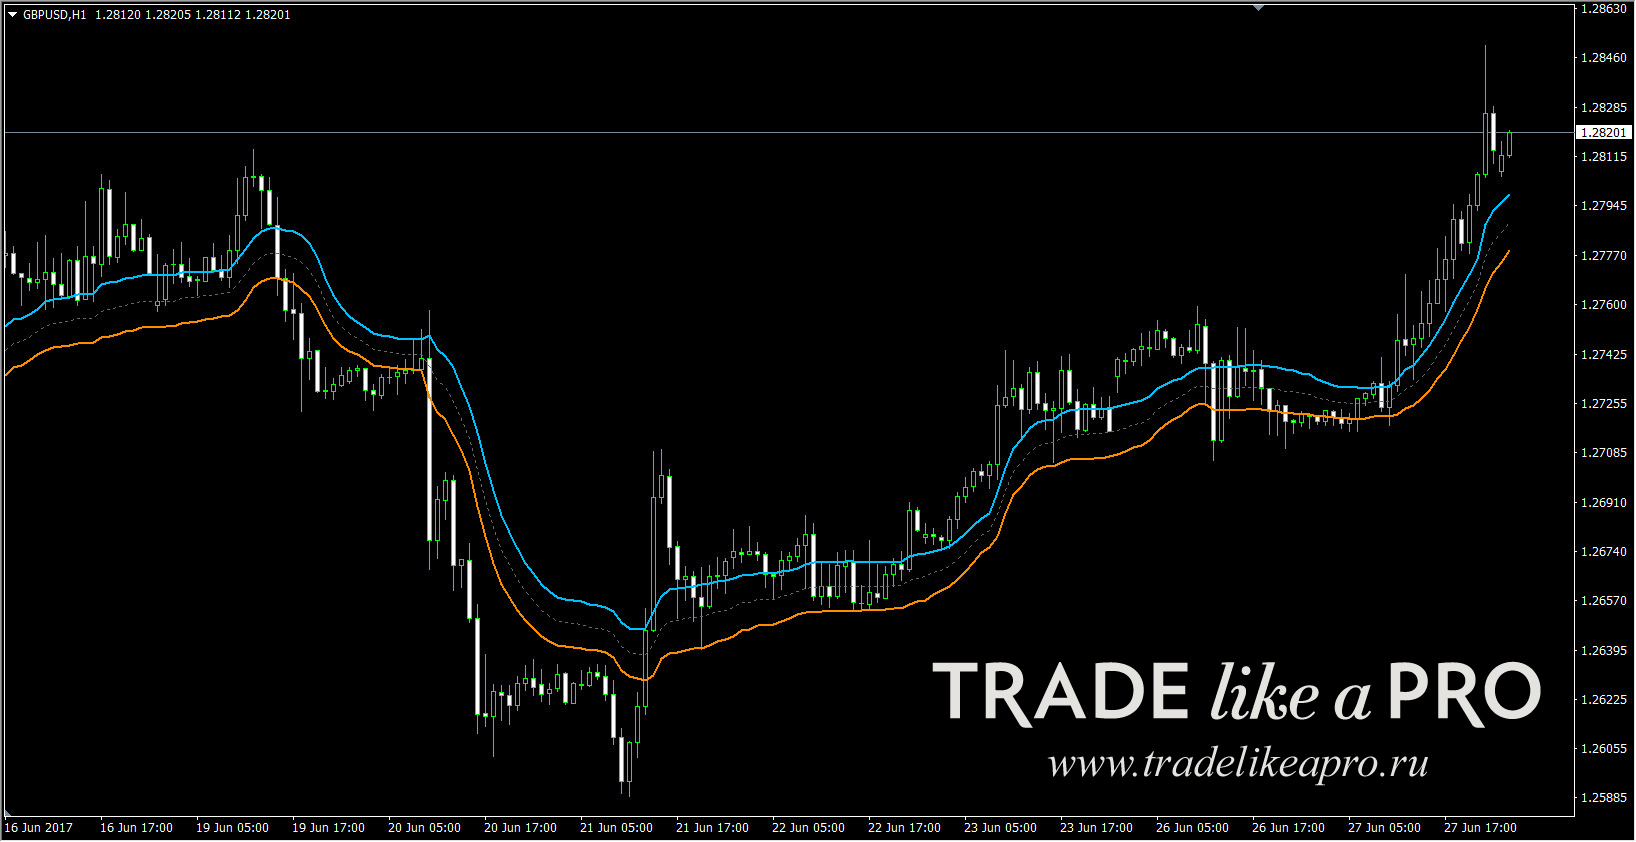 The VIDYA indicator is also known in this form. As you have already guessed, it strongly resembles Bollinger Bands or the Keltner Channel. Both VIDYA variants are included in the collection that you can download at the end of the article.
How can Tushar Chande's indicator be used in trading? The simplest and most elementary approach is the price crossing the indicator downward for sells, and upward for buys. However, as can be seen even from the screenshot above, in that case we are guaranteed quite a few small losing trades as well. This is a common problem for all trend systems (as traders say, we earn on the trend and lose in the flat). And here, as was already said above, it is worth applying one of the properties of VIDYA: when the trend movement loses its strength, the indicator takes an almost horizontal position, signaling that if you are in the market, it is time to exit; if you are out of the market, then it is not worth trading now.
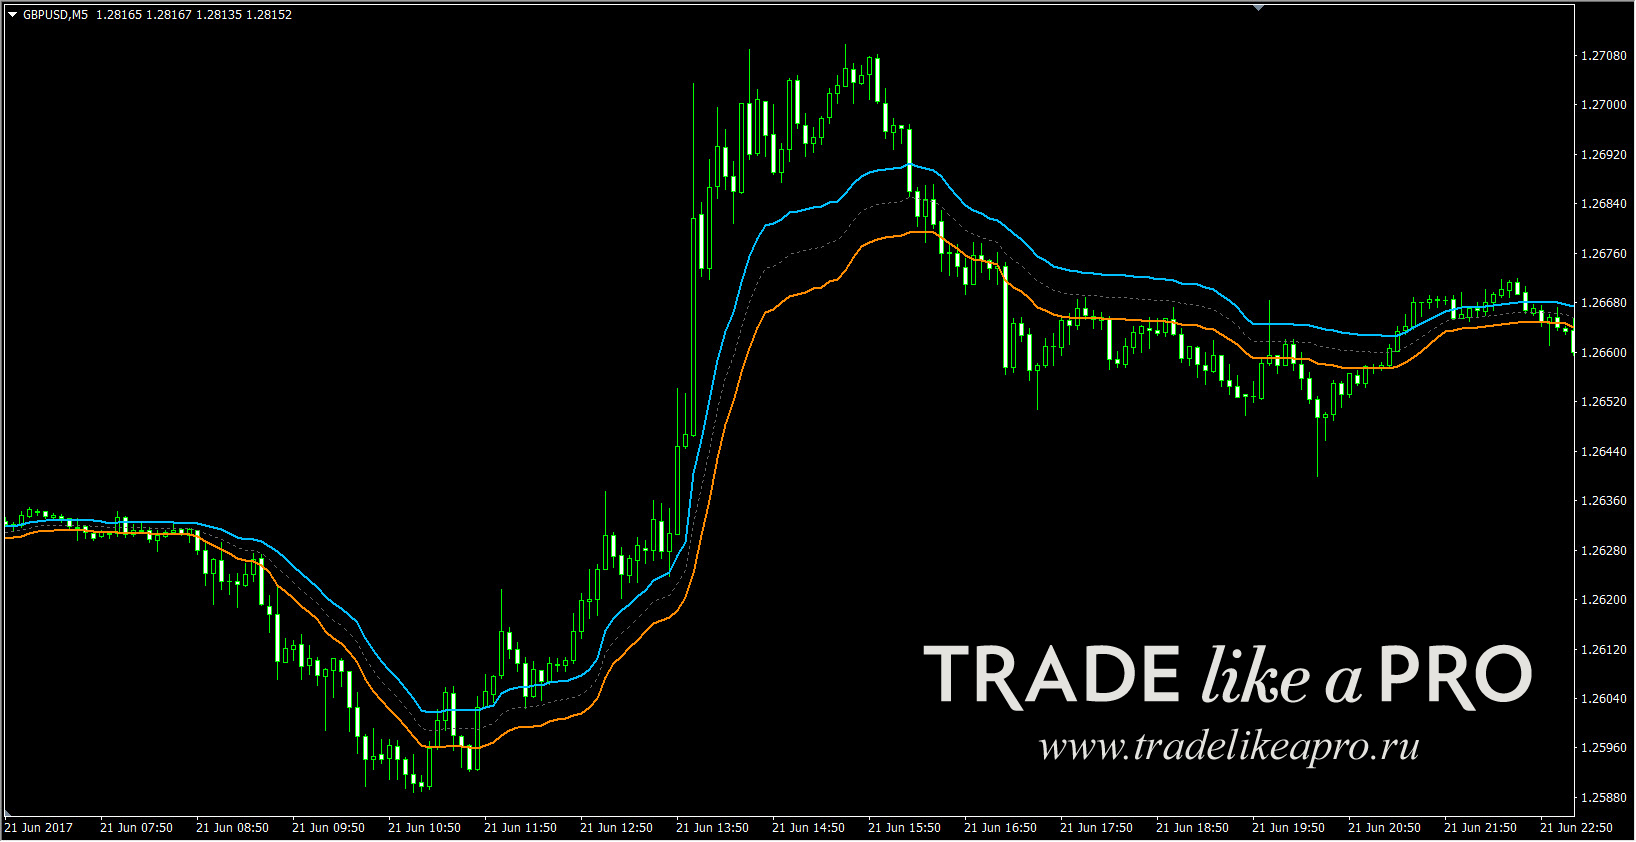 A typical example of how it works: before noon (terminal time) there is a signal to sell, after noon no one will doubt that it is necessary to buy. And closer to evening already (the close of the American session) the indicator takes an almost horizontal position, there is nothing for intraday traders to do in the market. Of course, such good trending days will not always happen, there will also be days with a string of losing trades, this should not be forgotten either. As the trader develops and improves, intuitive understanding will also grow, when it is not worth getting into the market.
Volume Weighted Moving Average
 Volume Weighted Moving Average (VWMA) is a volume-weighted moving average. The following principle is implemented in the indicator: the larger the volume of a candle, the more weight this candle has. The author, unfortunately, is unknown. In the settings you can set the number of bars (candles) for the calculation. In the screenshot, as usual, 14 SMA (red) and VWMA (14):
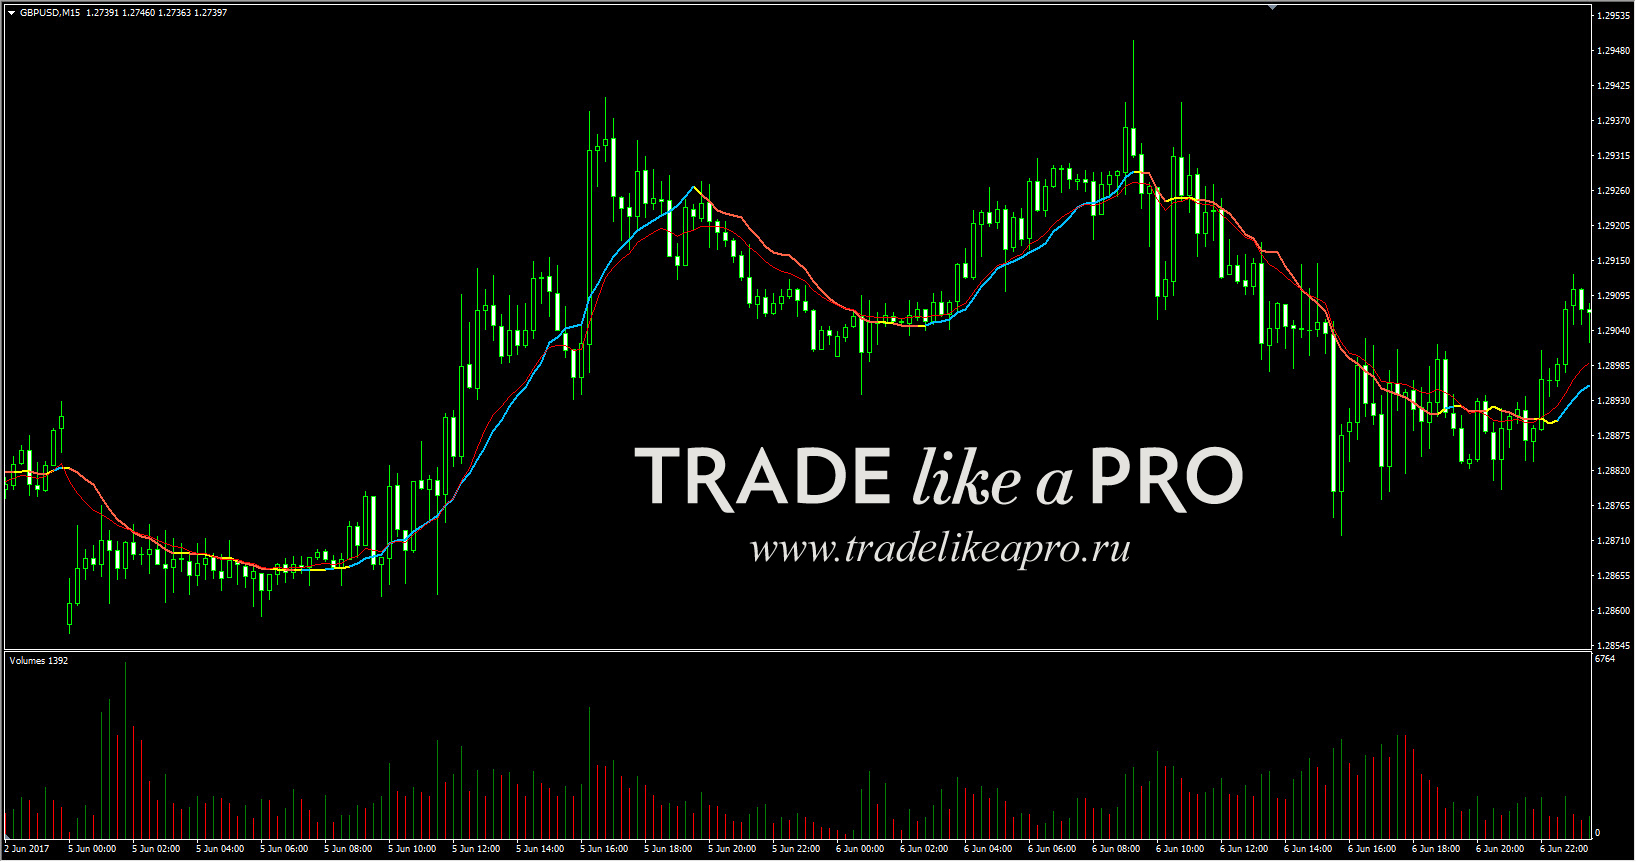 The picture also has a volume indicator added, it illustrates quite well that when there is increased volume in the market, VWMA 14 is ahead of the SMA 14 moving average; when volumes fall (during the Asian session), the opposite happens. Thus, in this moving average greater weight is given to volume, and its "pattern" will depend on that. The calculation formula looks like this:
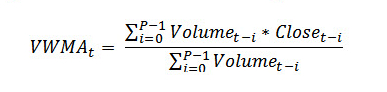 How to use it? The indicator settings have two parameters: selecting the moving average period and selecting the type of price calculation (entered as a number in the settings: 0 - CLOSE price; 1 - OPEN price; 2 - HIGH price; 3 - LOW price; 4 - MEDIAN price; 5 - TYPICAL price; 6 - WEIGHTED price, here everything is analogous to other indicators, without translation into Russian).
As is already clear from the name, as a filter for this moving average you can apply any volume indicator, Better Volume, for example. If you are a supporter of the VSA methodology in forex, then this moving average will definitely interest you.
Welles Wilder's Moving Average
Trading guru Welles Wilder (eng. J. Welles Wilder) also created his own variation of the moving average. In general, without exaggeration, he is a legendary and outstanding figure in the field of trading.
 Let us just look at the list of technical indicators that he developed and that many traders have been using for more than one decade already. These are ADX (ADMI), ASI, ATR, Parabolic SAR, RSI. Impressive, right? And there is also WWMA, Welles Wilder’s Moving Average, Welles Wilder's moving average. It looks like this:
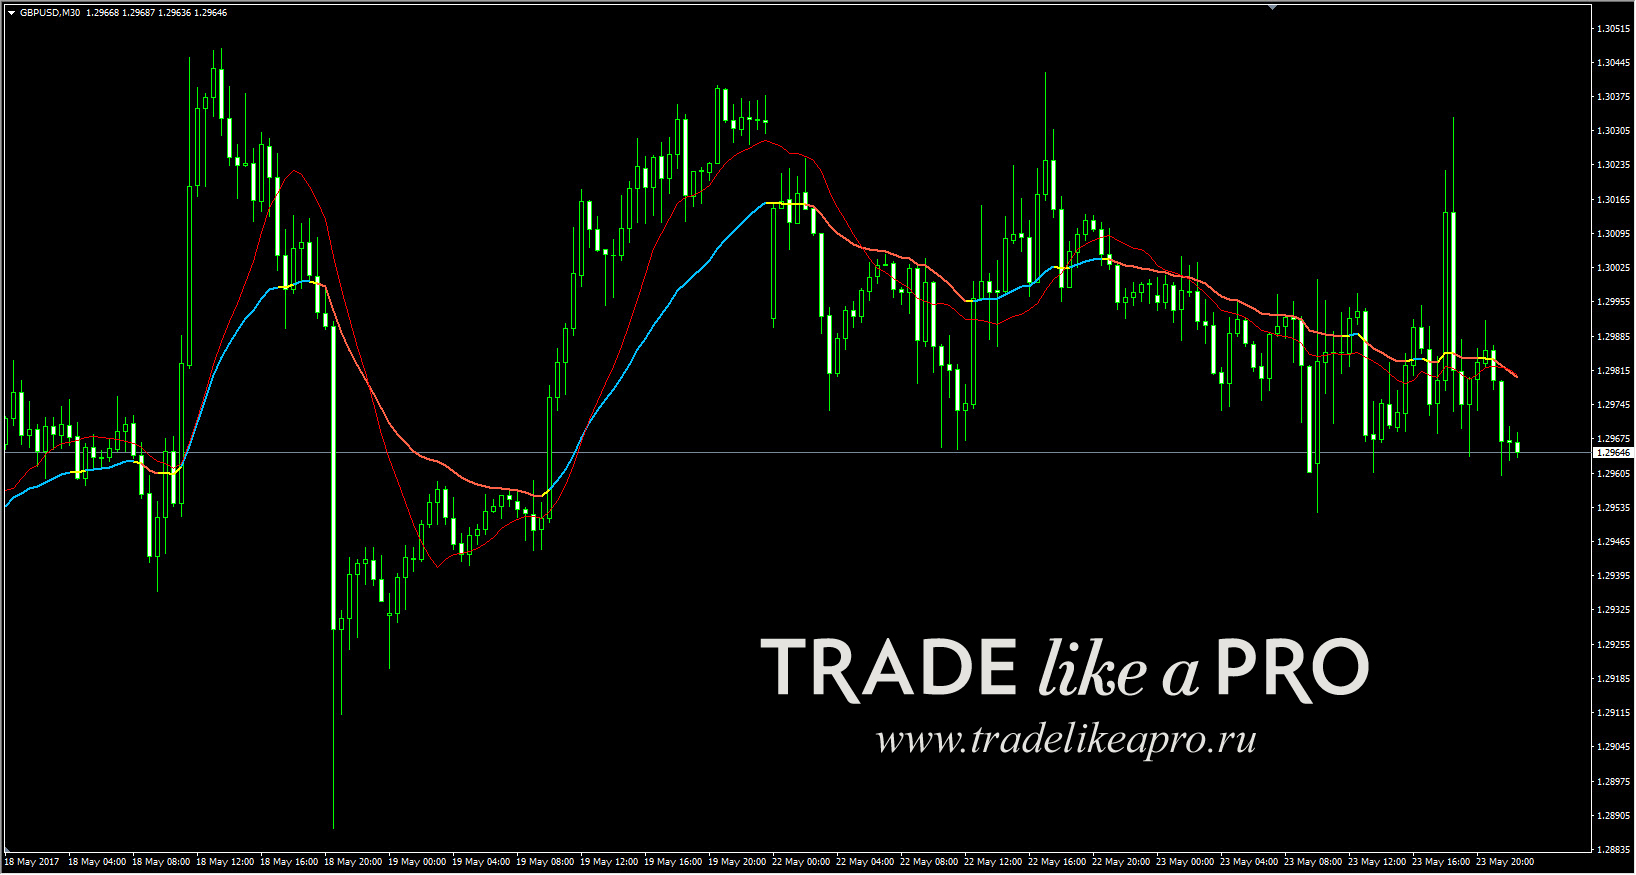 In the screenshot, as usual, a comparison with the 14 SMA (the WWMA indicator is taken from AllAverages_v2_5). The WWMA calculation formula has the following appearance:
 From the formula it is clear that Wilder's moving average is nothing other than an exponential moving average, WWMA(n)=EMA(2n−1). They really are quite similar:
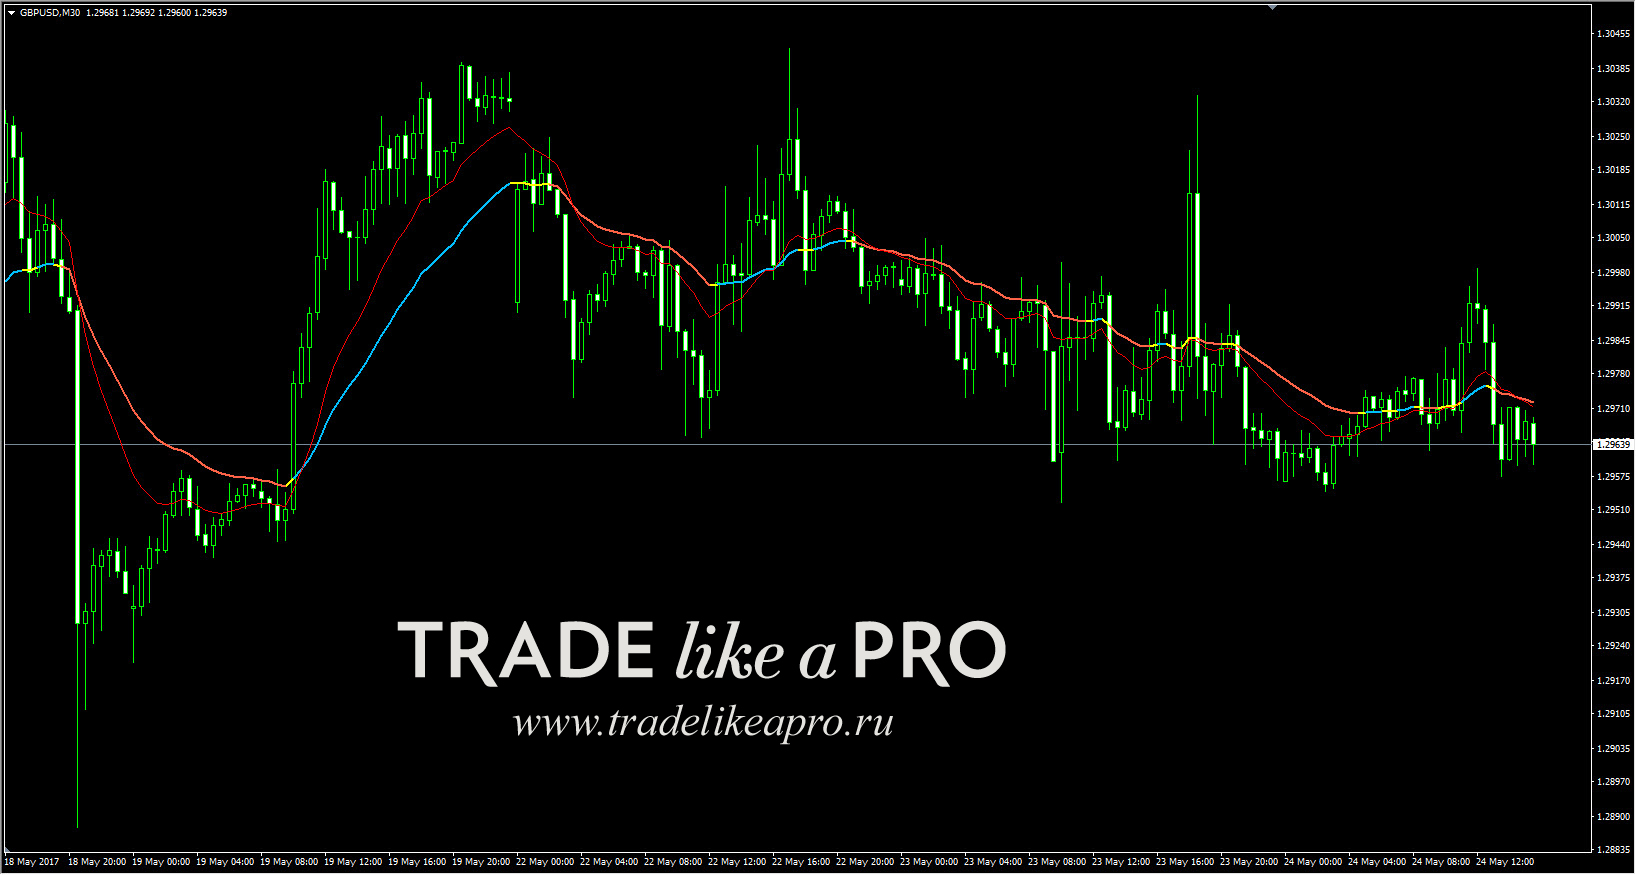 How to use it? As a filter for screening out false signals, you can immediately recommend one of Wilder's indicators. There is no need to explain how they work. Everyone knows the good old RSI.
All Moving Averages in One
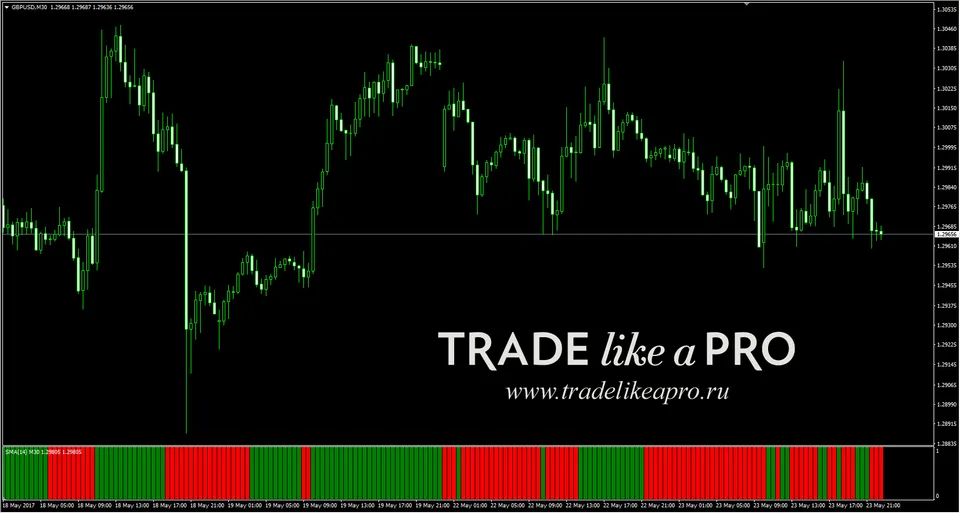
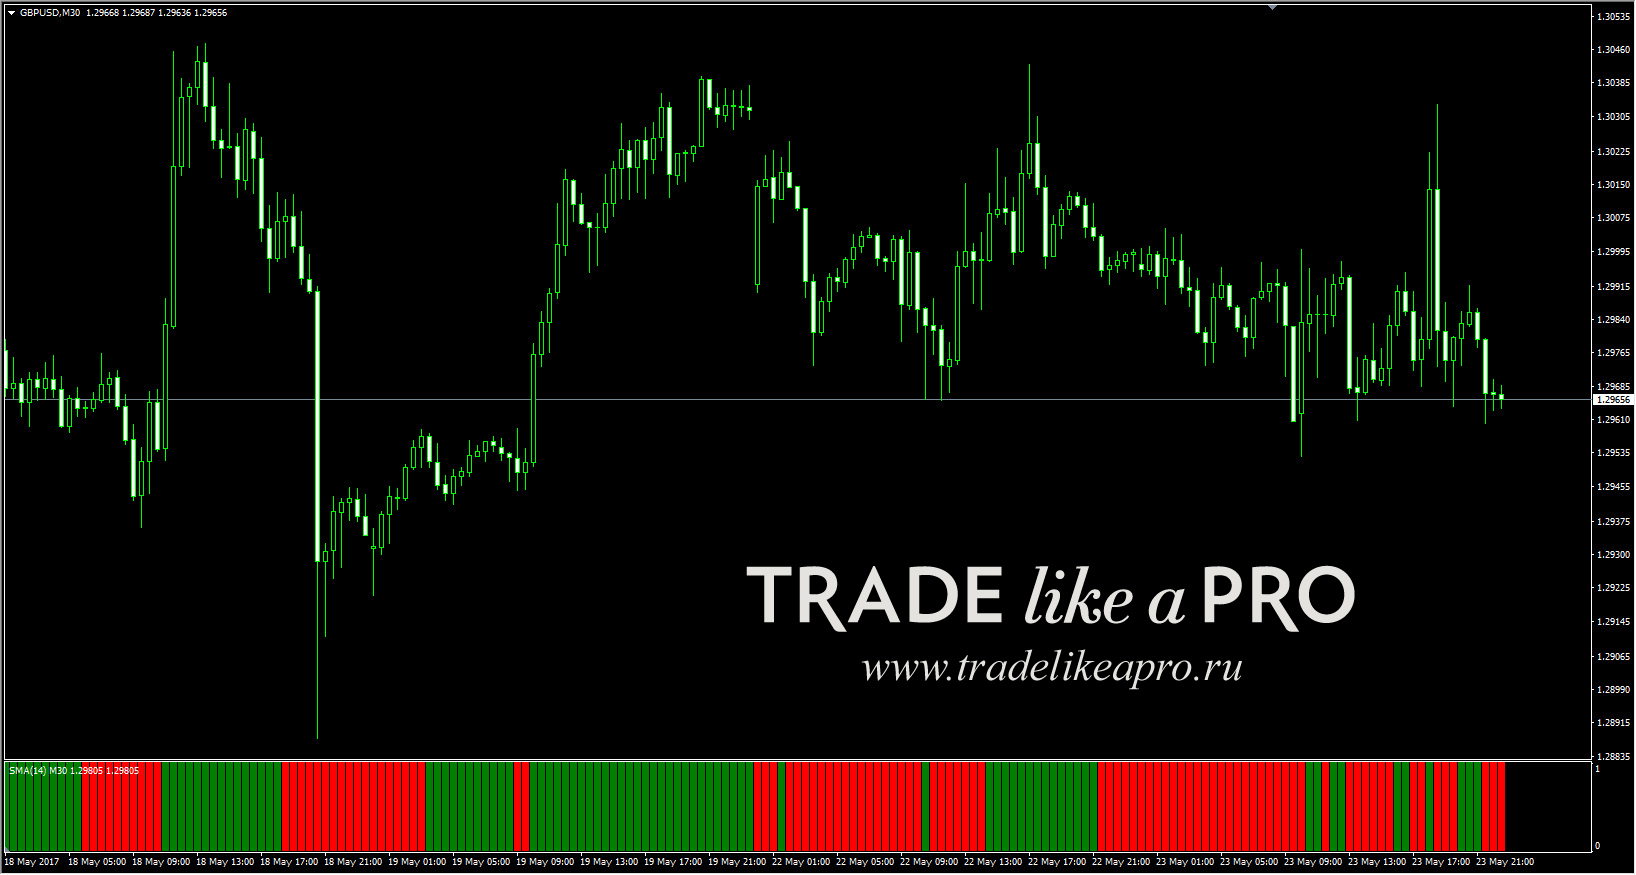
If taking a single indicator separately is inconvenient, and you want to quickly and efficiently compare different types of moving averages and choose the best among them, then a solution to this problem has been found. There is such a series of indicators, All Averages. Why a series? Because there are quite a lot of such indicators, with all kinds of modifications, both for working on the chart and for placement in a subwindow. In one of them, nearly twenty different types of MA are implemented, which you can set in the indicator and see what will work better on the chart.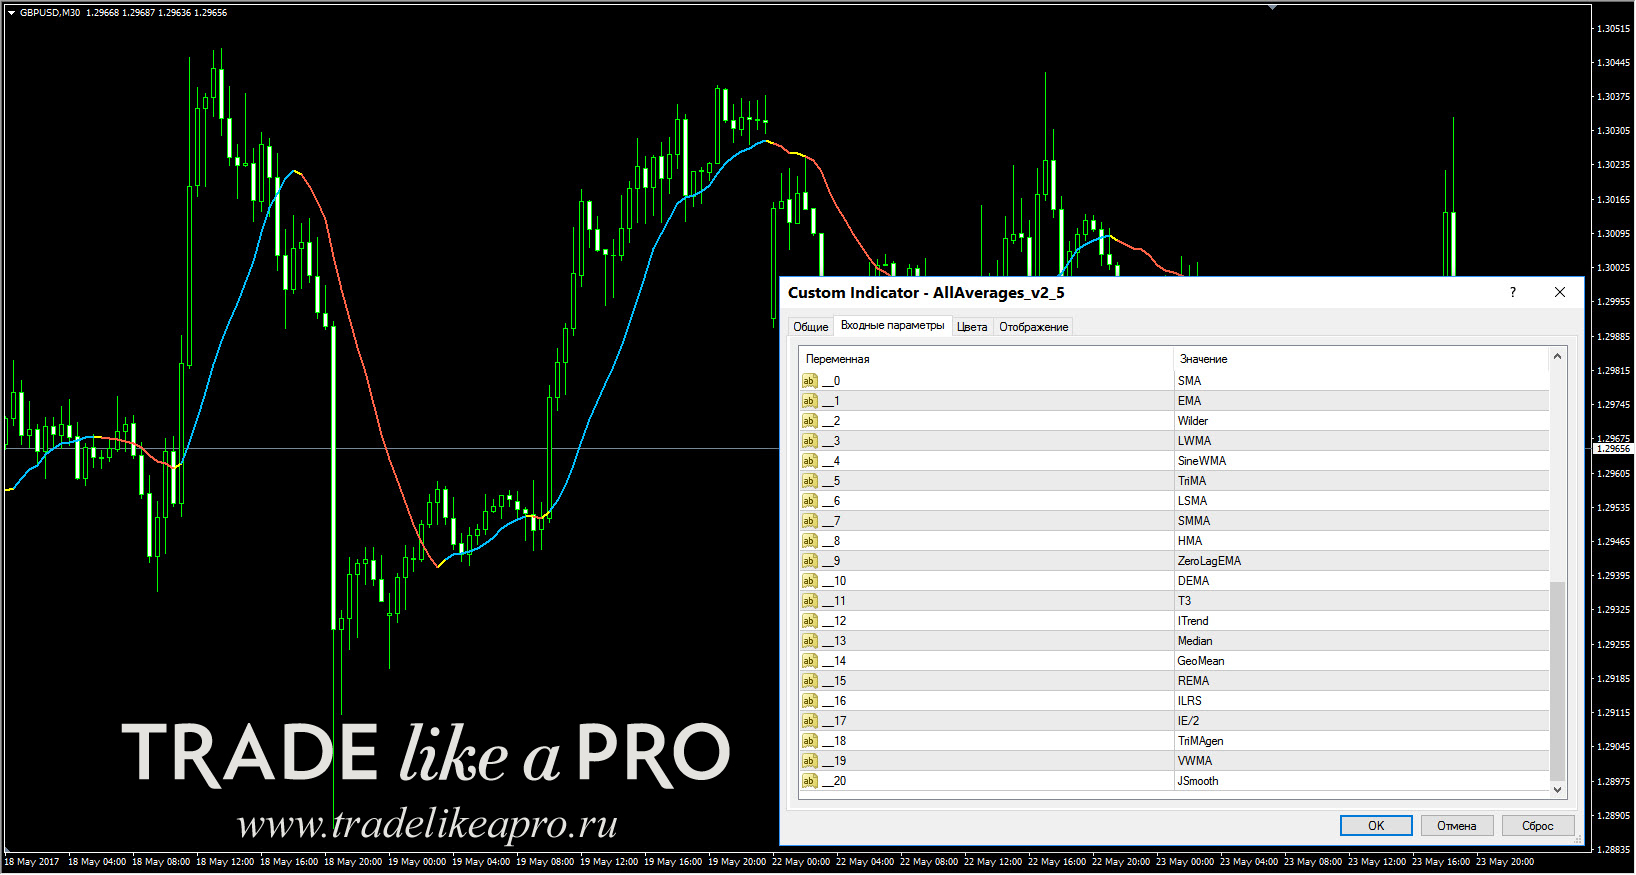 The 14 SMA is shown. In the settings you can see all the MA types that can be selected. Here is the same indicator (14 SMA), but in the form of a subwindow histogram:
 Conclusion
 In conclusion, it is worth highlighting a couple of the most optimal moving averages, where there is minimal lag and a small overshoot beyond the price during a strong trend. Without a doubt, these will be Jurik Moving Average and Triple Exponential Moving Average. Their use in trading, instead of the standard MAs from MT4, will be much more effective in any strategy.
The topic of moving averages is very extensive. It is a kind of whole universe. And it is simply impossible to talk about all versions and modifications of moving averages. I suggest not limiting yourself to this post, but following the link below to the forum, where more than six hundred different modifications of the indicator for the MetaTrader 4 terminal are presented. And even there not everything is collected) Moreover, most indicators are available with open code (open source) in the form of MQL files, which will be interesting for programmers and everyone who wants to know how technical indicators are written. By the way, you can download all the indicators from this article at the link below.
One more important point: although in most of the moving averages considered, the lag problem has been solved one way or another, this solution also has another side. If you rely only on one indicator and take all its signals, nothing good will come of it because of the large number of false triggers. You should always still have some filter in the form of another indicator or oscillator, or the same indicator but with data from a higher timeframe, and so on. Remember this.
Good luck and see you again!
In conclusion, it is worth highlighting a couple of the most optimal moving averages, where there is minimal lag and a small overshoot beyond the price during a strong trend. Without a doubt, these will be Jurik Moving Average and Triple Exponential Moving Average. Their use in trading, instead of the standard MAs from MT4, will be much more effective in any strategy.
The topic of moving averages is very extensive. It is a kind of whole universe. And it is simply impossible to talk about all versions and modifications of moving averages. I suggest not limiting yourself to this post, but following the link below to the forum, where more than six hundred different modifications of the indicator for the MetaTrader 4 terminal are presented. And even there not everything is collected) Moreover, most indicators are available with open code (open source) in the form of MQL files, which will be interesting for programmers and everyone who wants to know how technical indicators are written. By the way, you can download all the indicators from this article at the link below.
One more important point: although in most of the moving averages considered, the lag problem has been solved one way or another, this solution also has another side. If you rely only on one indicator and take all its signals, nothing good will come of it because of the large number of false triggers. You should always still have some filter in the form of another indicator or oscillator, or the same indicator but with data from a higher timeframe, and so on. Remember this.
Good luck and see you again!
Download All Indicators from the Review

Respectfully, Pavel aka Pavel888