
Turtle Strategy - old-school trading classic

A legendary strategy that brought millions of dollars to traders all over the world. A famous experiment that showed that anyone can trade on the exchange if they follow the rules of the system. A trading philosophy which, once understood, will open new dimensions of making profit on Forex for you. The classic "turtle" system, despite its age, carries many lessons, allowing you to look into the very essence of price movements and big trends.
Characteristics of the "Turtle" trading system
Platform: Any
Currency pairs: EURUSD, USDRUB, AUDUSD, USDCAD,NZDUSD,USDSGD,EURGBP, Gold, stocks, commodities, indices
Timeframe: D1
Trading time: around the clock
Recommended brokers: Alpari, Roboforex, Amarkets
Reference material

- Curtis Faith's book "Way of the Turtle. From Novice to Legendary Trader": - Download the electronic version
- Michael Covel's book "The Complete TurtleTrader"
- Installing indicators in MT4
- Installing strategies
The history of the strategy's origin

Many years ago, two traders, Richard Dennis and William Eckhardt, argued about whether it was possible to teach an ordinary person trading by teaching them a trading system and urging them to follow its rules with discipline.
Richard Dennis said that it was possible, while William Eckhardt believed that it was not. He thought that one needed some kind of sixth sense or intuition to work on the exchange. Put simply, to have talent.
The result of their argument was an experiment. Richard Dennis placed an ad and recruited people off the street in order to train them in his trading system. At the end of the training, he allocated certain sums to the best students for trading. And what do you think happened? Without his close supervision, some of the students made millions, while some from his group, on the contrary, lost them. The market was the same. They traded at the same time. The rules for each of them were the same.
This experiment shows that trading success depends not so much on the system as on the person themself.
It does not matter how much you know in total. If you do not know how to apply it in practice, then you are not as smart as you might think.
Today we will examine what kind of system it was that Richard Dennis taught his students, and we will try to understand why some traders lost money while others earned it.
Auxiliary indicators

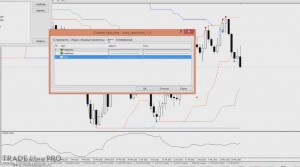
- Azzx_donchian (Donchian Channels)
Builds channels based on the highs and lows over a specified number of days.
In the case of a 20-day period, the last 20 candles are taken into account. The highest and the lowest price are marked. The same happens with a 55-day period. There is nothing complicated here. You can easily draw the channel yourself with a pencil on paper. The indicator is applied to the chart three times with periods of 55 days, 20 days, and 10 days.
- TheClassicTurtleTrader (Turtle)
You can find breakouts yourself, but it will be faster and easier to use auxiliary indicators.
TheClassicTurtleTrader shows breakouts with red and blue dots and displays entries and exits with arrows.
It is applied to the chart twice. One with a period of 20 and a stop period of 10. The second with a period of 55 and a stop period of 20.
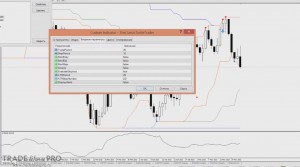
For successful classic trading, the indicators "Donchian Channels" and "The Classic Turtle Trader". are enough.
Let's add the indicator to the chart to see everything clearly:
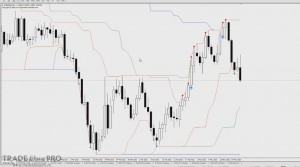
We can see that the indicator's dots also serve as signals when the channel over the last n days continues to expand or contract.
- Turtle
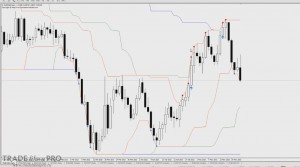
Shades the areas of the 10, 20, and 55-day breakout and marks entry with arrows and exit with check marks.
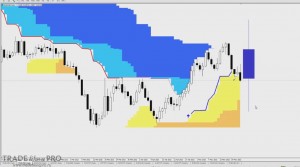
Draws a candle that shows the medium-to-long-term trend.
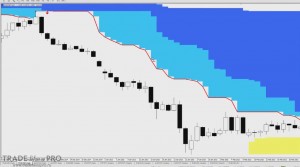
In this example, it is not a very strong downtrend.
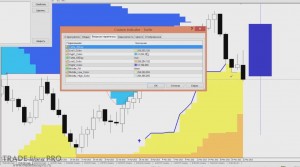
Default settings. If desired, you can change the display settings of the 55-day channel and the colors.
- ATR
A standard indicator in the terminal.
It is set with a period of 20.
Entry rules

Two types of trading are based on a Donchian channel breakout. Trades are opened immediately as soon as the price breaks the channel. There is no need to wait for the candle to close.
A shorter-term entry:
- The price breaks the 20-day Donchian channel.
- The trade on the previous signal, whether we entered it or not, closed at a loss.
If the previous trade closed with a profit, we skip the entry. If it later turns out that the breakout is profitable, then we enter it later on the break of the 55-day channel.
In the picture you can see the daily chart of EUR/USD.
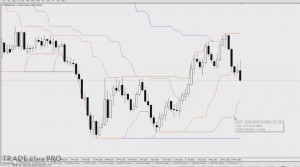
The green lines show the boundary of the Donchian Channel with a period of 20, that is, 20 days.
When the price breaks this channel, we enter a trade.
A more long-term entry:
-The price breaks the 55-day Donchian Channel.
Interestingly, we do not use a filter based on the previous trade, we always enter.
Stop-loss

For Forex, there is a simplified form of calculation for the turtles. It looks as follows:
ATR (20) * 2
An interesting fact is that back then the turtles did not place stop orders in the market, since they traded fairly large positions. Thus, they did not want to demonstrate this to the broker. Instead of placing an order, they watched the price during the day and organized an exit as soon as it reached the breakout level.
At the same time, it was important that the loss did not exceed certain values related to the current volatility in the market. The stop-losses were virtual.
But you and I are not trading billions, so we definitely need to place real stop-losses.
In order to work with the stop-loss calculation formula, it is worth adding the ATR indicator to the chart:
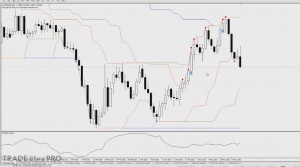
In the last trade, the stop-loss would have been 280 points:
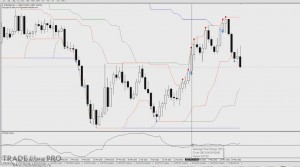
The reason for the large figures is that these are daily charts.
This stop-loss is set solely for insurance purposes, since exits occur according to the rules discussed below, and accordingly the stop-loss is triggered extremely rarely.
It is set in order to protect yourself from unpleasant situations involving some kind of sharp price movements during the day.
Exit Rules

As is well known, if there is an entry, then there must be an exit.
- For a trade opened on a breakout of the 20-day channel, the exit occurs when the opposite 10-day channel is broken.
- For a trade opened on a breakout of the 55-day channel, the exit occurs when the opposite 20-day channel is broken.
- In the first case, the turtles exited on a breakout of the 10-day channel. On the chart it is marked with red boundaries:
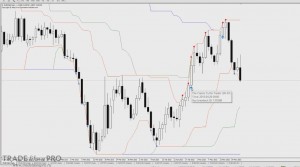
The auxiliary indicator clearly shows the exit point.
When crossing below the low of the 10-day channel, we get a point like this:
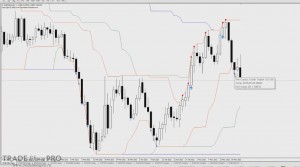
If you hover the cursor over it, the indicator name, time, and a note about exiting long positions will appear.
- And in the case of the 55-day channel, the exit was made when the 20-day channel was broken.
Let us open a sell trade and look at it once again.
On the chart you can see the breakout for the 55-day chart:
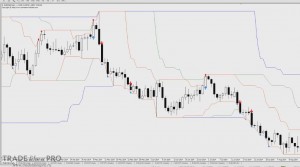
At the highlighted point there was an upward breakout of the 20-day channel. Here we would have exited the trade:
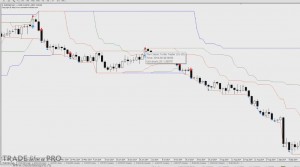
This is exactly how exits from these positions occur. It is important to monitor the readings carefully and enter and exit positions when signals appear.
Additional Orders

They are placed at approximately every 0.5 ATR from the entry point
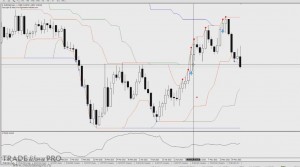
We could have entered the market somewhere around this level. The ATR would have been 140 points. Half of that is 70:
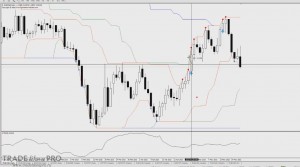
After 70 points, we would have placed one more entry order in the same direction. After another 70, one more, and after another 70 points, one more.
The add-on orders would have been arranged like this at every 70 points:
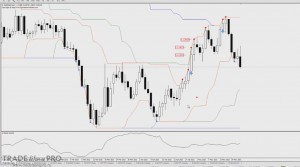
If the ATR had been different, then the add-ons would have been made in equal portions of half of it.
Money Management

Now let us talk about money management.
- Risk per trade no more than 1%
- When using add-on orders, risk per trade is 0.25%
I would like to say right away that the Turtles never risked more than 1% of the deposit on a trade. If you also want to use add-on orders, then it is worth using a risk of about 0.25% of the deposit in each trade.
As for the stop-losses of add-on orders, they are calculated exactly as described above. When each add-on order is reached, the stop-loss of the total position is moved one level higher or lower. Simply put, it shifts a little.
I will surely see comments about the small risk per trade, but the Turtles traded a large number of markets and instruments. This precaution was needed so that in case of losses on individual positions, they could still stay in the game overall. This is the main purpose of money management - to allow us to stay in the game during a long streak of losing trades.
Trade Examples

Now let us look at several examples of entries into the market.
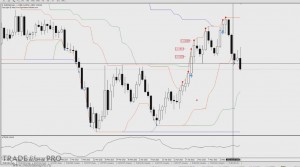
- The penultimate entry at the crossing of the 20-day channel will be straightforward
The position here closed with a small profit of about 15 pips:
The position opened on the breakout of the 55-day channel would have been closed by the protective stop-loss:
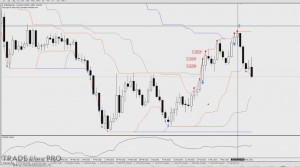
Please note that we would have skipped the long entry at the last high on the breakout of the 20-day channel, because the previous breakout of the 20-day channel brought a profit.
- Let us see whether we could have entered a trade using the example of another breakout.
Potentially, it is profitable:
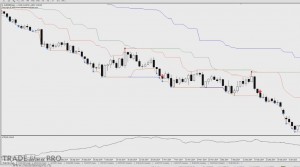
Let us see whether the previous breakout was profitable. For it to be considered losing, the price must move against our potential position by at least 2 ATR:
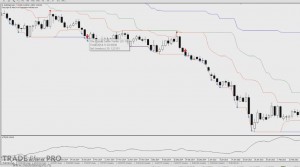
In our case, it did not move that distance, but the trade still ended up closing at a loss. The reason was the crossing of the 10-day channel.
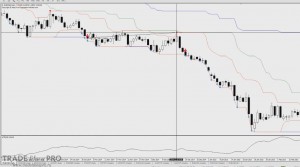
Consequently, we can take the signal under consideration.
- Now let us look at a signal that would give us an opportunity to enter the breakout and make a profit as well:
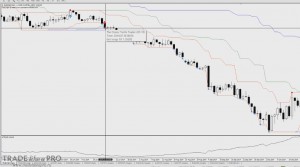
The previous signal was losing. We can see a clear reversal, so we would have been able to enter the market confidently at the candle close:
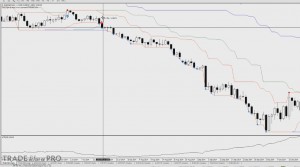
The stop-loss would be set as a protective one. At the moment, the ATR amounted to 47 points. Therefore, we would take about 100 points.
The trade could have been held further until the maximum of the 10-day channel was crossed:
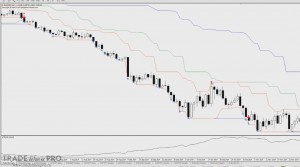
The indicator helpfully shows with a red dot the moment when it was worth exiting the market.
We would have exited with a profit of 630 points:
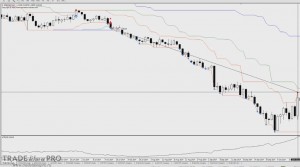
This is exactly what the strategy is designed to capture: such trends.
- Now let's look at entries based on the 55-day channel.
Let me remind you that in the case of a 55-day breakout, we take all trades, regardless of whether they were profitable in the past or not. And we exit the trade when the 20-day channel is broken.
It is most convenient to use 2 charts so that it is easier to navigate the strategy.
The last entry in our example occurred a little later than the 20-day one:
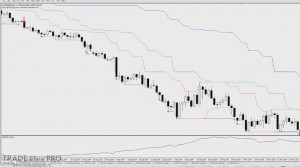
The stop-loss is calculated in the same way.
In this case, it amounted to about 92 points. It would have been set on our chart:
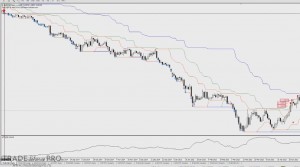
We would have exited the system after a long period of time.
Let's calculate the profit that we could have received in the end:
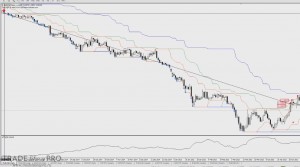
The profit on this trade would have been 2300 points with a stop-loss of 100 points. That is, the profit would have been 23 times greater than the stop!
You must agree that this is a very good trade. This is the full power of long-term trends.
Of course, there will be a lot of false signals in the system, but that is how it was intended.
The book about the history of the Turtles mentions that they made the biggest money on trends 3-4 times a year. Simply put, 4 trades brought in the main income, despite the fact that they traded many instruments.
Lessons of the Turtles

1) Trade with an edge. Find a strategy that delivers positive results in the long term so that you have a long-term advantage.
2) Manage risk. Control risks so you can continue trading, otherwise you will not have time to enjoy a string of successful trades.
3) Be consistent. Follow your trade entry plan to achieve the system's goal: making a profit.
4) Do simple things. Simple systems stand the test of time more easily.
Trend Table Since 2010
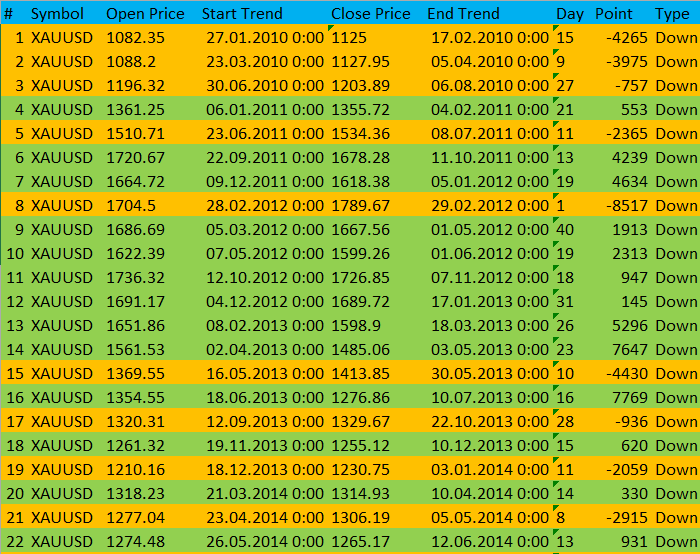
The author of the Turtle indicator compiled an interesting table that calculates all trends since 2010 after a breakout of the 20-day channel. A trend is considered complete when it returns to the opposite 10-day level. The calculations were made for the major currency pairs: EURUSD, GBPUSD, USDCHF, NZDUSD, USDJPY, USDCAD, AUDUSD, EURGBP, GOLD, and SILVER.
Attention! These are simply ALL breakouts of the 20-day channel with completion on a return to the 10-day channel. These are not entries under the Turtle system. The additional condition for entry under system 1 (that the previous entry had been unprofitable), as well as the breakout of the 55-day channel, were not taken into account.
The first table shows downtrends, the second shows uptrends.
Legend for the table:
1) # - sequential number;
2) Symbol - currency pair;
3) Open Price - the price at the start of the trend, breakout of the 20-day level;
4) Start Trend - the time the trend began;
5) Close Price - the closing price, pullback to the opposite 10-day level;
6) End Trend - the time the trend ended;
7) Day - trend duration in days;
8) Point - the number of points from the entry price to the closing price;
9) Type - trend type Down/Up - descending/rising;
10) Total shows the final sum of POINTS.
I advise using this information as interesting material for your own research. You have probably already come up with a couple of ideas.
Download the table
Conclusion

The Turtle strategy clearly shows us that long-term trends cannot be ignored. And that you can make big money on them while spending minimal effort. I understand perfectly well that intraday trading persistently tempts you with the expectation of instant results, but you can combine the 2 approaches: trade long-term in one account, and make shorter-term trades in another.
Download the "Turtles" strategy files

Strategy thread on the forum
Respectfully, Pavel Vlasov Tlap.io