
TRIX Indicator - Triple EMA for Reliable Entry

TRIX is a time-tested technical analysis tool that filters out market noise and helps avoid unnecessary entries. The indicator is quite elegant: in essence, it is the percentage ratio of nearby values of a triple exponentially smoothed moving average (TMA) of closing prices (close).
The TRIX indicator (Triple Exponential Average / triple exponentially smoothed moving average) was developed by Jack Hutson in the early 1980s. Hutson, as publisher and editor of the authoritative magazine "Technical Analysis of Stocks & Commodities", set himself the task of creating a tool that would solve two key problems: filtering random market noise and generating timely signals. The result of his work was the TRIX indicator, first presented to the general public in the article "Good TRIX" in 1982.
Since then, TRIX has been regarded as a smoothed momentum oscillator: it compares not the price itself, but the rate of change of an already heavily smoothed series. This became its strong side: TRIX is less jumpy than more "fast" oscillators, and therefore is better suited to finding a sustainable direction rather than guessing every micro-movement.
This material is for informational purposes, cannot and should not be regarded as consultation or advice.
TRIX calculation formula and the logic of triple smoothing
The strength of TRIX lies in its ability to "smooth" the price chart. Unlike ordinary Moving Average, TRIX passes price through three consecutive exponential moving averages (EMA), and then calculates the percentage change of the resulting value.

Why is triple smoothing needed? Its main task is to eliminate minor cyclical fluctuations with a period smaller than the specified one (for example, 14 days). The first smoothing removes the most obvious noise, and each subsequent one makes the indicator line smoother and smoother, allowing focus on the dominant trend. That is why TRIX is considered more sensitive to momentum than the classic MACD.
The process of calculating the TRIX indicator consists of four stages.
- First smoothing: the first-level EMA is calculated (for example, a 14-period one) from the closing price: EMA1 = EMA(Close, N, i)
- Second smoothing: the EMA of the result of the first step is calculated: EMA2 = EMA(EMA1, N, i)
- Third smoothing: the process is repeated, and the EMA of EMA2 is calculated: EMA3 = EMA(EMA2, N, i)
- 3. Third smoothing: the process is repeated, and the EMA of EMA2 is calculated: EMA3 = EMA(EMA2, N, i)
The point of the formula is not complication for the sake of complication. Each additional exponential smoothing reduces noise, but increases lag. When ROC is applied to this series, the indicator stops being just an "average line" and turns into a measure of trend acceleration/deceleration. Therefore, TRIX is often perceived as a cleaner, but more lagging version of the "momentum" logic: it filters random fluctuations better, but confirms a reversal later than aggressive oscillators.
Signals and strategies for using the TRIX indicator
TRIX is an oscillator that fluctuates around the zero line. The main TRIX signals are: crossing the zero line, crossing the signal line, and divergences.
All examples below are shown on TradingView charts with the custom TRIX indicator installed.
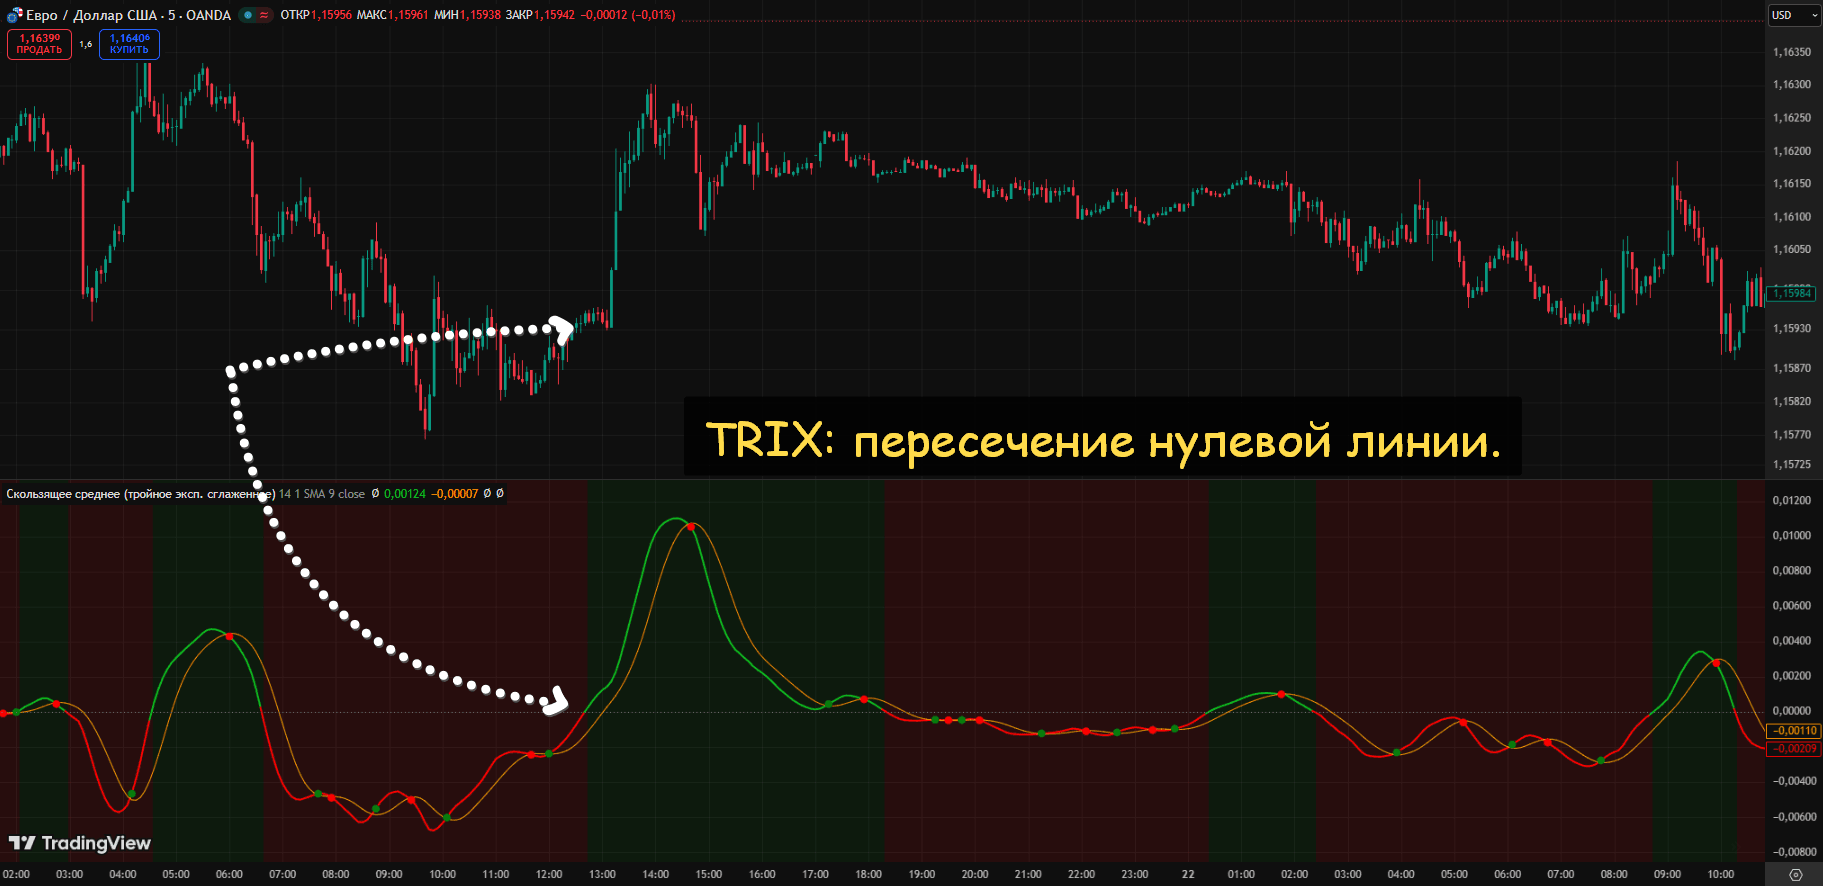
The first strategy is the zero-line crossover. It is considered the simplest and most reliable signal.
If TRIX moves above zero, momentum becomes bullish; if below zero, bearish. This is no longer just an entry trigger, but an assessment of the market regime: who is currently controlling the move, buyers or sellers.
Such a signal allows entry into a position in the direction of the emerging trend, filtering out sideways movement.
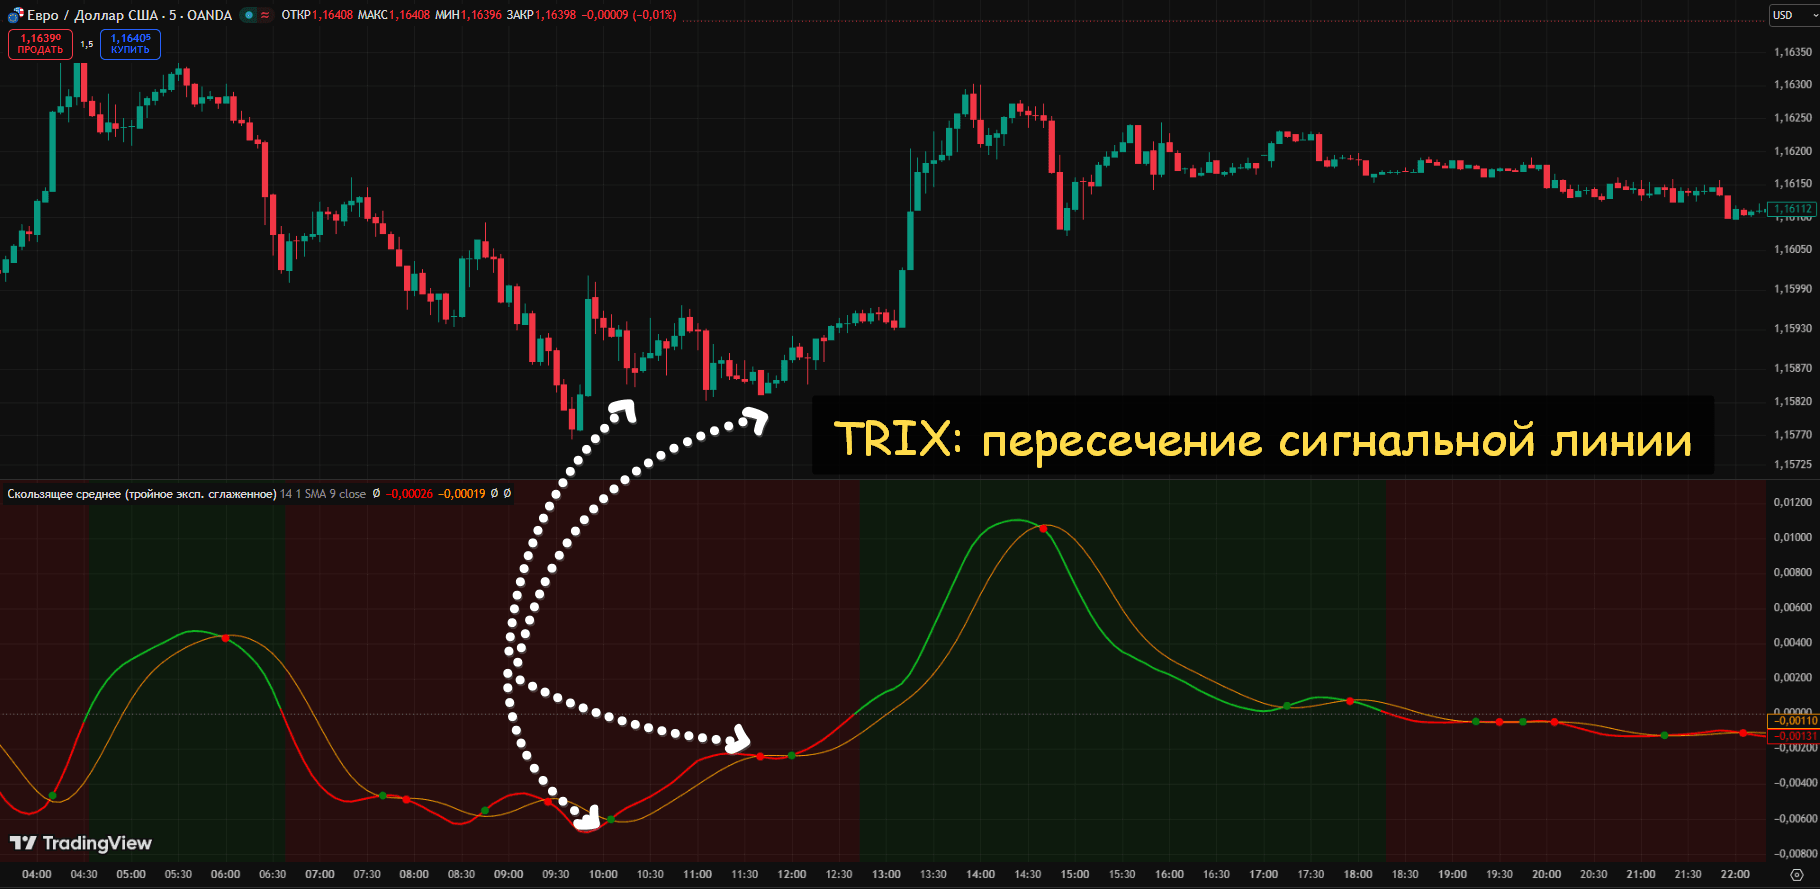
The second basic strategy is the signal-line crossover. This is the most common signal: when TRIX crosses its signal EMA from bottom to top, it is an early bullish sign; from top to bottom, bearish.
This method is similar to using MACD. Signal-line crossover signals are usually more sensitive and help catch momentum changes within a trend.
But this signal has a weak spot: in a sideways market it gives many false triggers, because TRIX itself is smoothed by nature and can lag on weak movement.
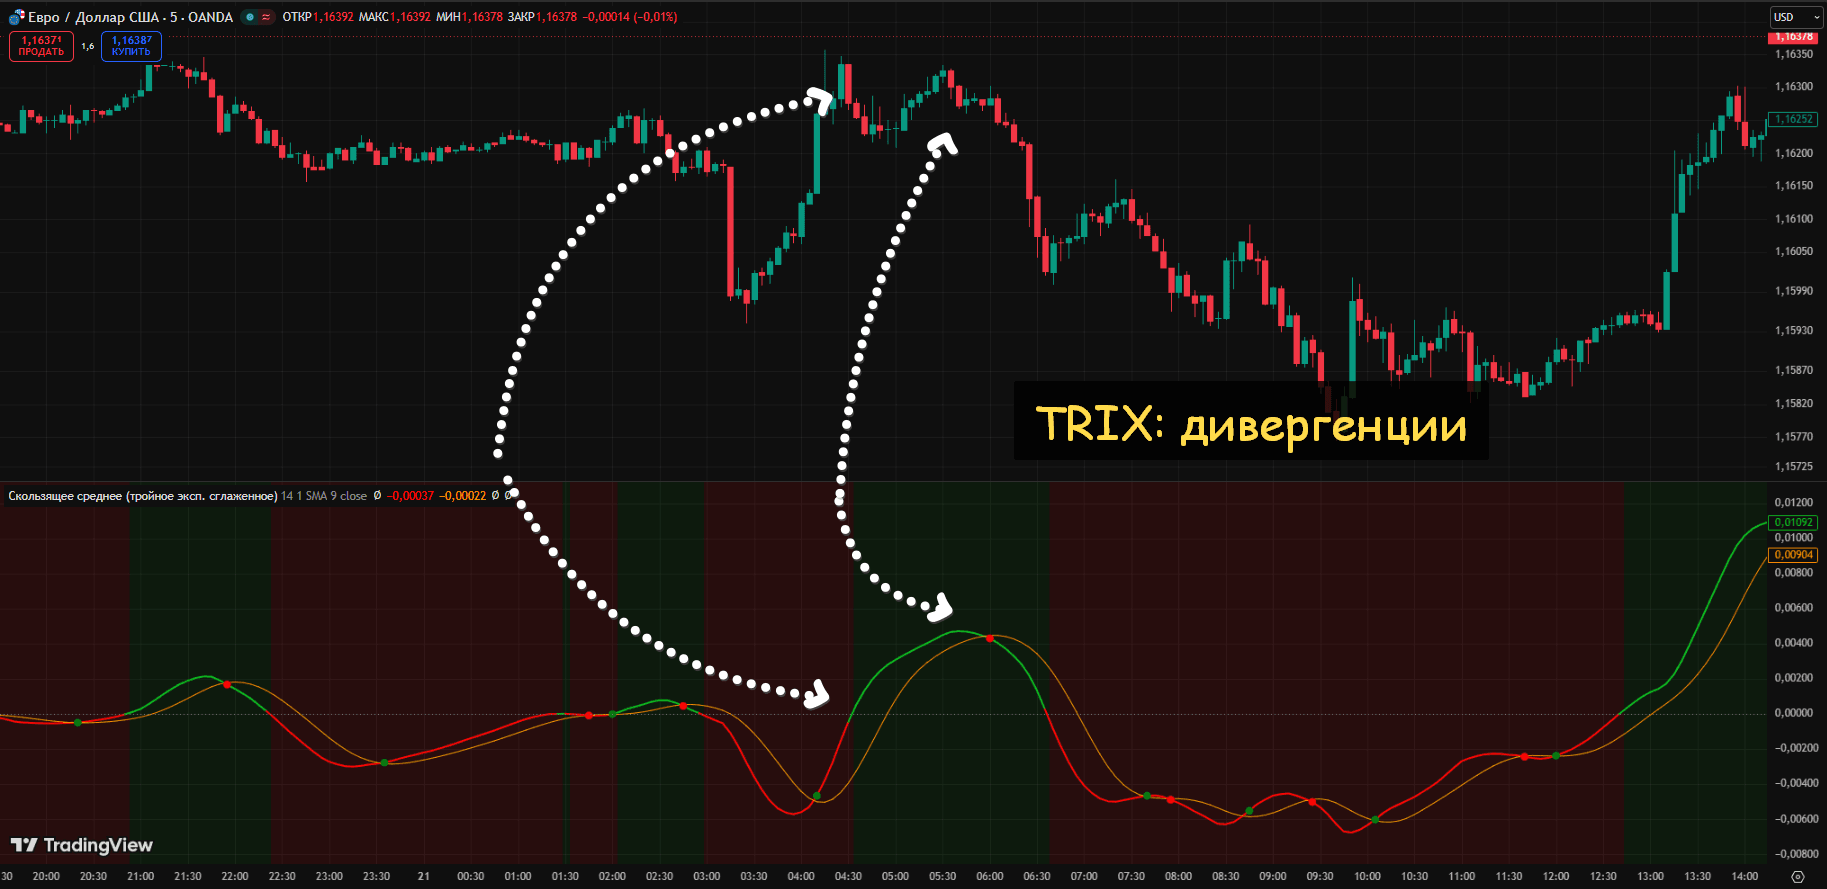
The third strategy is divergences. A bullish divergence occurs when the price makes a lower low, while TRIX makes a higher low; a bearish one occurs when the price updates a high, but TRIX does not confirm the strength of the move.
Jack Hutson himself in his article "Good TRIX" noted that "the best results" are achieved when using TRIX to determine entry points in trending markets, for example, after a correction, the ending of which may be signaled by a divergence.
In other words, divergences are better used in a trend as confirmation of the end of a pullback, but not for searching for a countertrend on a strong market.
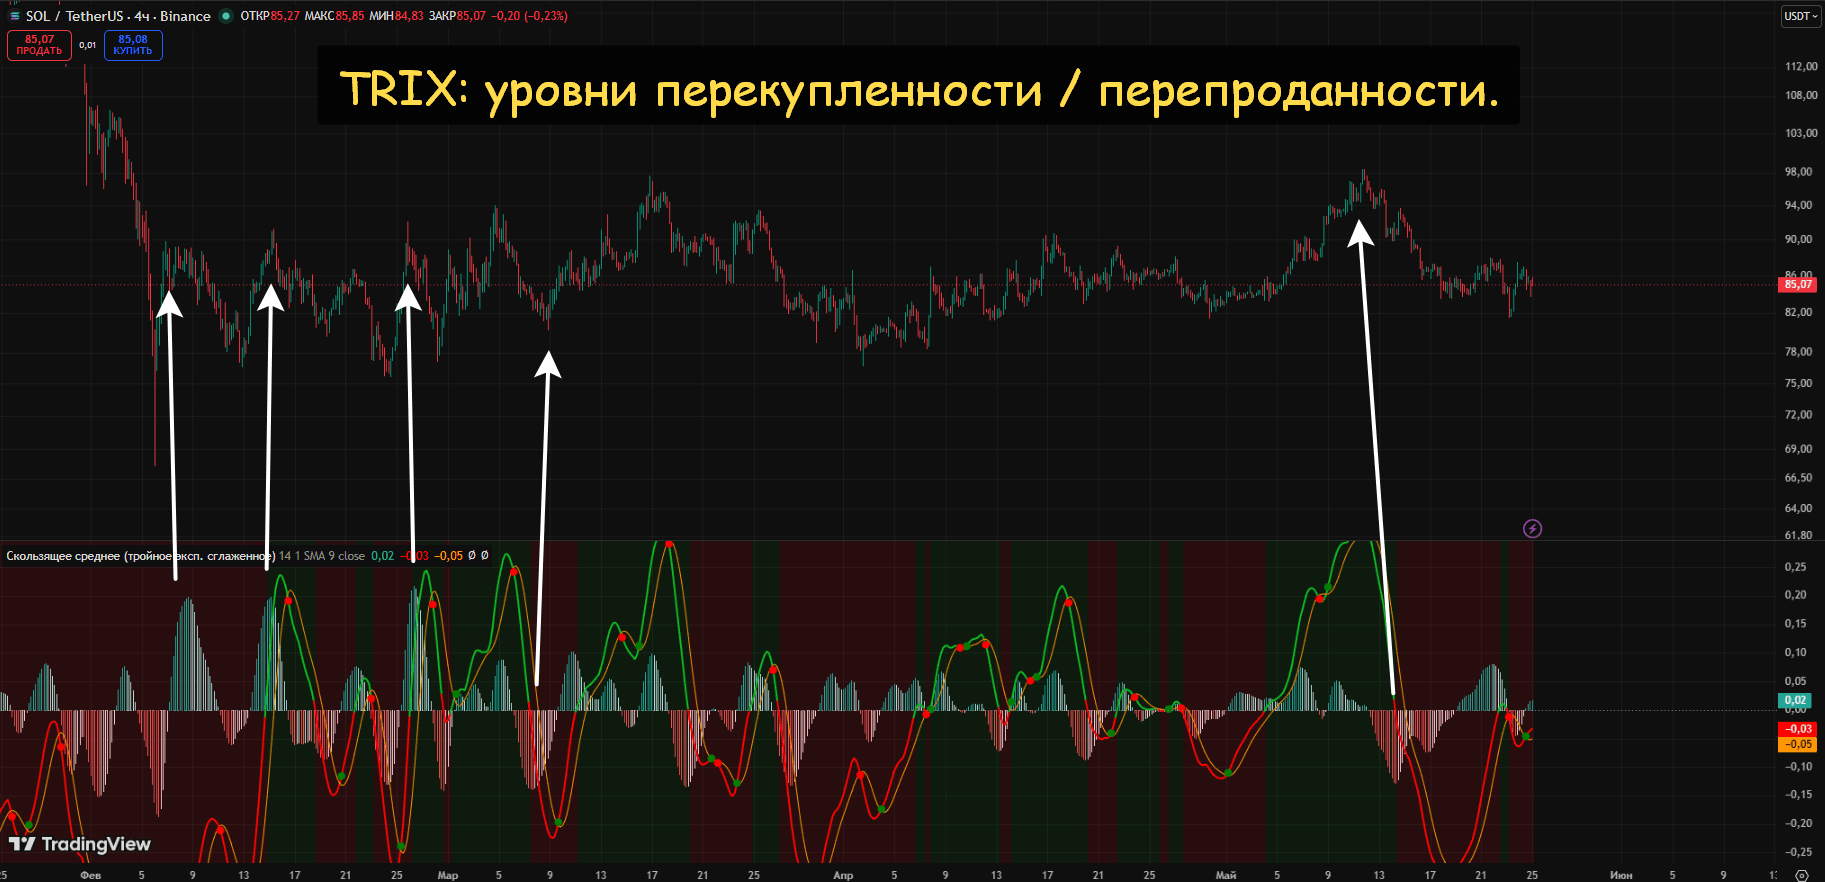
The fourth strategy is overbought / oversold levels. Working with overbought / oversold levels is perfectly suited for working in a sideways market.
Combination of TRIX with other indicators
To filter false signals and improve forecast accuracy, it is highly desirable to combine TRIX with other tools.
TRIX + RSI (Relative Strength Index)
RSI confirms the overbought/oversold conditions shown by TRIX.
A buy signal that appears when TRIX gives a bullish divergence and RSI exits the oversold zone will be significantly more reliable. This combination makes it possible to validate oscillator signals.
TRIX + MACD (Moving Average Convergence Divergence)
Despite the external similarity (both use a signal line), these indicators can complement each other.
MACD can be used to confirm TRIX signal line crossings, which usually reverses a little later.
Hence the practical logic: MACD can be kept as a more familiar reference point, and TRIX as a cleaner filter of momentum quality.
TRIX + Volume Indicators (for example, OBV)
A breakout of the zero line by the TRIX indicator, confirmed by a sharp increase in volume (for example, by On-Balance Volume), is a classic pattern used by professional traders. Volume confirms the strength of the momentum.