
Trend Trading Systems: What You Need to Know
 Trading in a strong trend has for more than two centuries been considered the most profitable way to operate in the financial markets, and trend trading systems should be part of every professional trader's toolkit. Trend trading usually does not receive enough attention in the training of beginners at most educational centers. That is because the ability to catch a trend is the key to profitable trading rather than a quick way to blow an account, and ultimately every one of us feels that in our own trading account.
If you compare many different trading systems with each other, it is easy to discover that behind all of them there are not so many basic ideas and principles. In one of the previous articles we discussed breakout trading systems. Today we will talk, as you already understood, about trend strategies. We will analyze the used entry and exit techniques, the indicators on which such trading systems are most often built, and also consider examples for each group of techniques.
Market inefficiencies at the core of strategies

Any idea that may eventually turn into a trading strategy must exploit some kind of market inefficiency. There are not many of them, and yet, despite everything, such inefficiencies do exist. Some of them are unstable and appear from time to time. A good, if somewhat hackneyed, example is night scalpers. Trend strategies, as the name suggests, use market inefficiencies such as trends to make a profit. You all probably know how to identify trends, because this is one of the first things beginners learn. Now we will get acquainted with various classes of trend trading systems and examine their features using real examples.
Entries and Exits for Trend Systems

Trend and breakout systems are similar in many ways. For example, just as with breakout systems, for trend systems it is correct to avoid fixed orders for take profit and instead rely on a well-thought-out trailing stop system. This may be trailing by fractals, the shadows of candles, or extremes when trading on higher periods; trailing with Parabolic SAR or moving averages for intraday work, for example on H1; or even trailing by ATR when scalping on periods from M15 and below. I also recommend placing stop losses depending on the timeframe you choose to trade.
Typically, the lower the timeframe, the more noise there is. That means you have to account for this noise somehow: either shorten the time spent in a trade by reducing your profit target, which is highly undesirable for trend systems, or increase the size of the stop loss. For daily charts, in most cases a stop loss of around 2 ATR is optimal, while for H1 it is already 4-6 ATR. The general rule here is simple: the more one-directional the instrument moves, the smaller the stop you need. That is why higher timeframes are preferable for trend systems.
Typical indicators used in trend trading systems are, of course, moving averages, moving average envelopes, the MACD indicator, Bollinger Bands, Bill Williams' Alligator indicator, Keltner channels, and Ichimoku. In addition, traders now have access to quite a few decent modern indicators such as Ozymandias or Ultra Filter, but as a rule they are all modifications of classic indicators.
In terms of entry technique, several different approaches can also be distinguished. First, there is the purely trend-following, classic entry, as in the figure below:
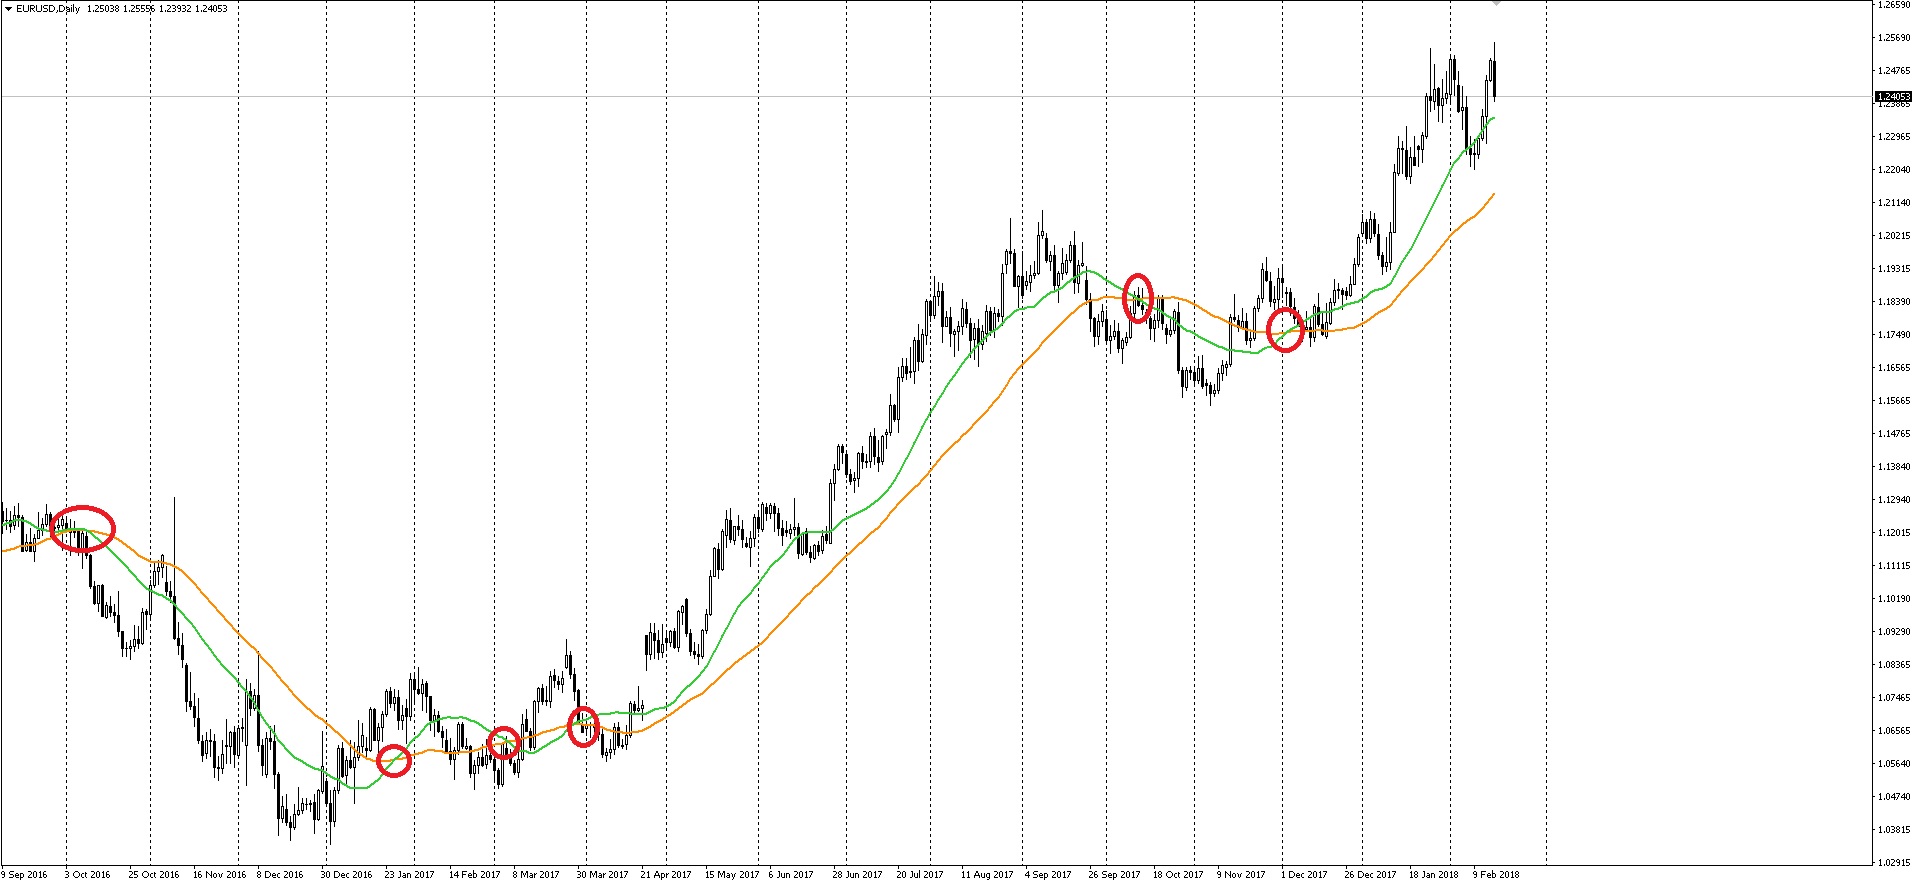 That is, we received a signal of the intersection of two moving averages, for example, and immediately enter a position. In markets where there are strong and long-lasting trends, this approach is fully justified. But the market Forex is very full of various events and factors influencing currencies, which may well throw the market in one direction or the other. As a result, established trends in Forex do not occur as often as we would like, and they are not long enough for such entry systems to work well enough.
That is why it is quite reasonable to combine elements from other types of strategies. One such element is a breakout entry. Instead of entering the market immediately on a signal, you can place a pending order and wait for the moment when price itself confirms its intention to continue the trend.
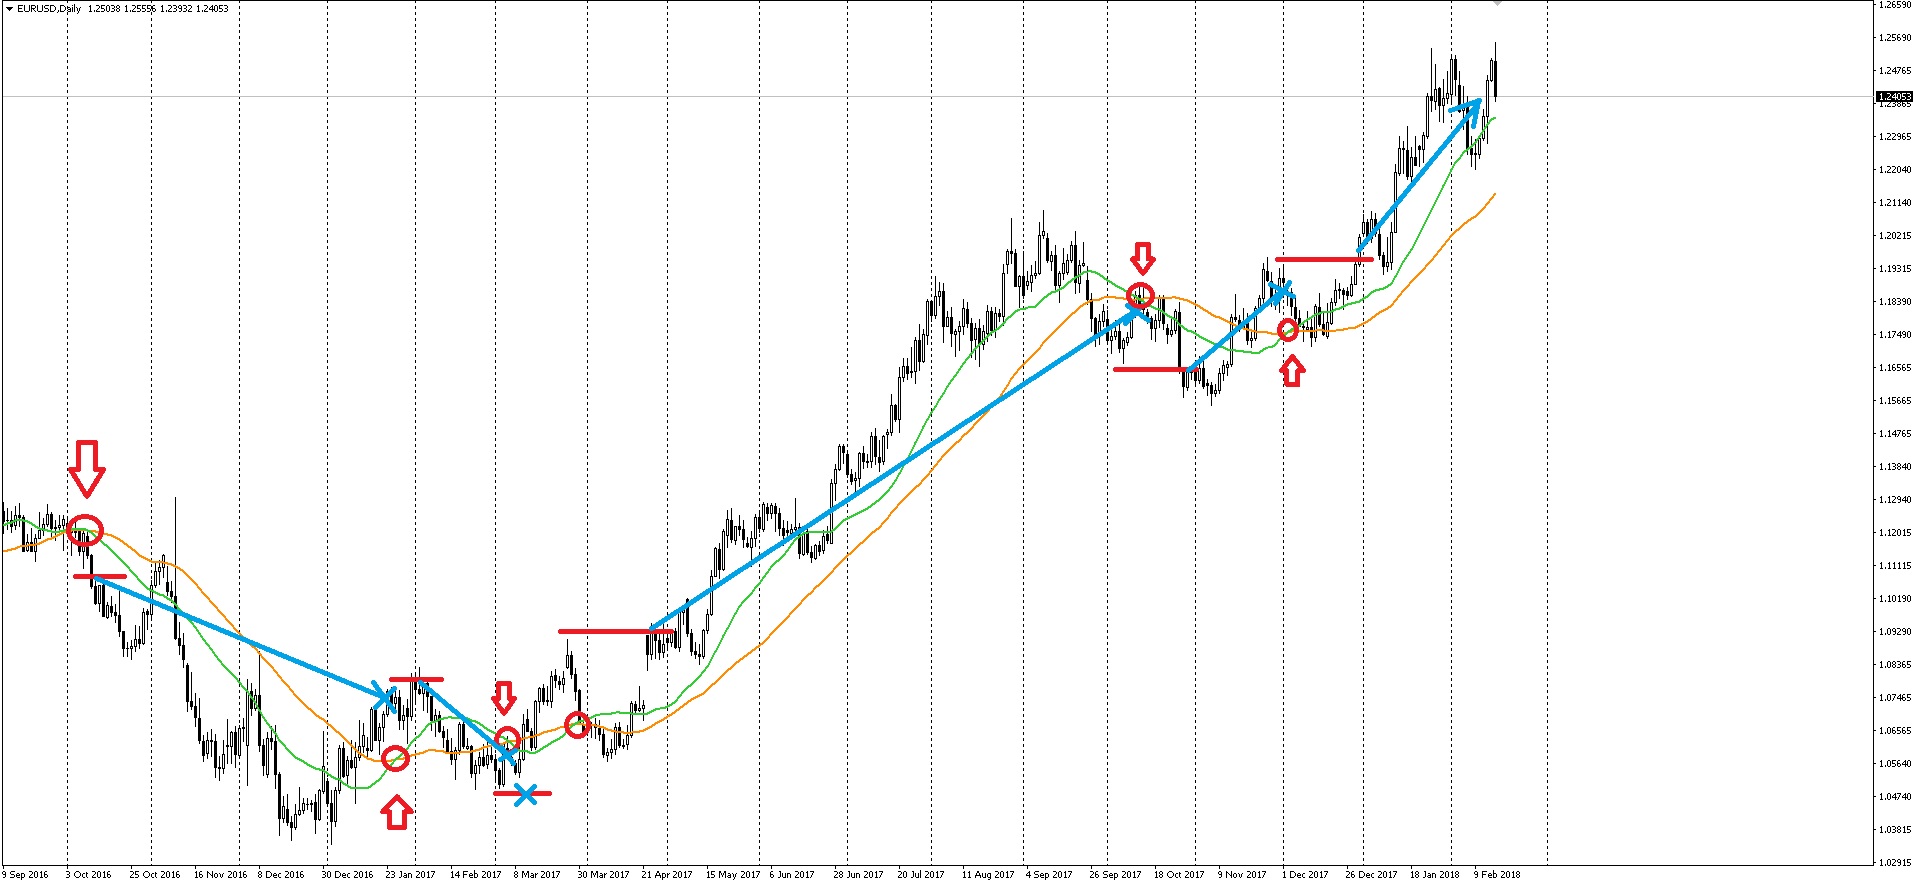 This tactic will eliminate at least some false signals without causing you to miss the ones that are truly worth taking. In addition, it is often recommended to watch the ADX readings so as not to enter during flat market conditions.
And one more option, the one most widely used by traders, is an entry on a pullback:
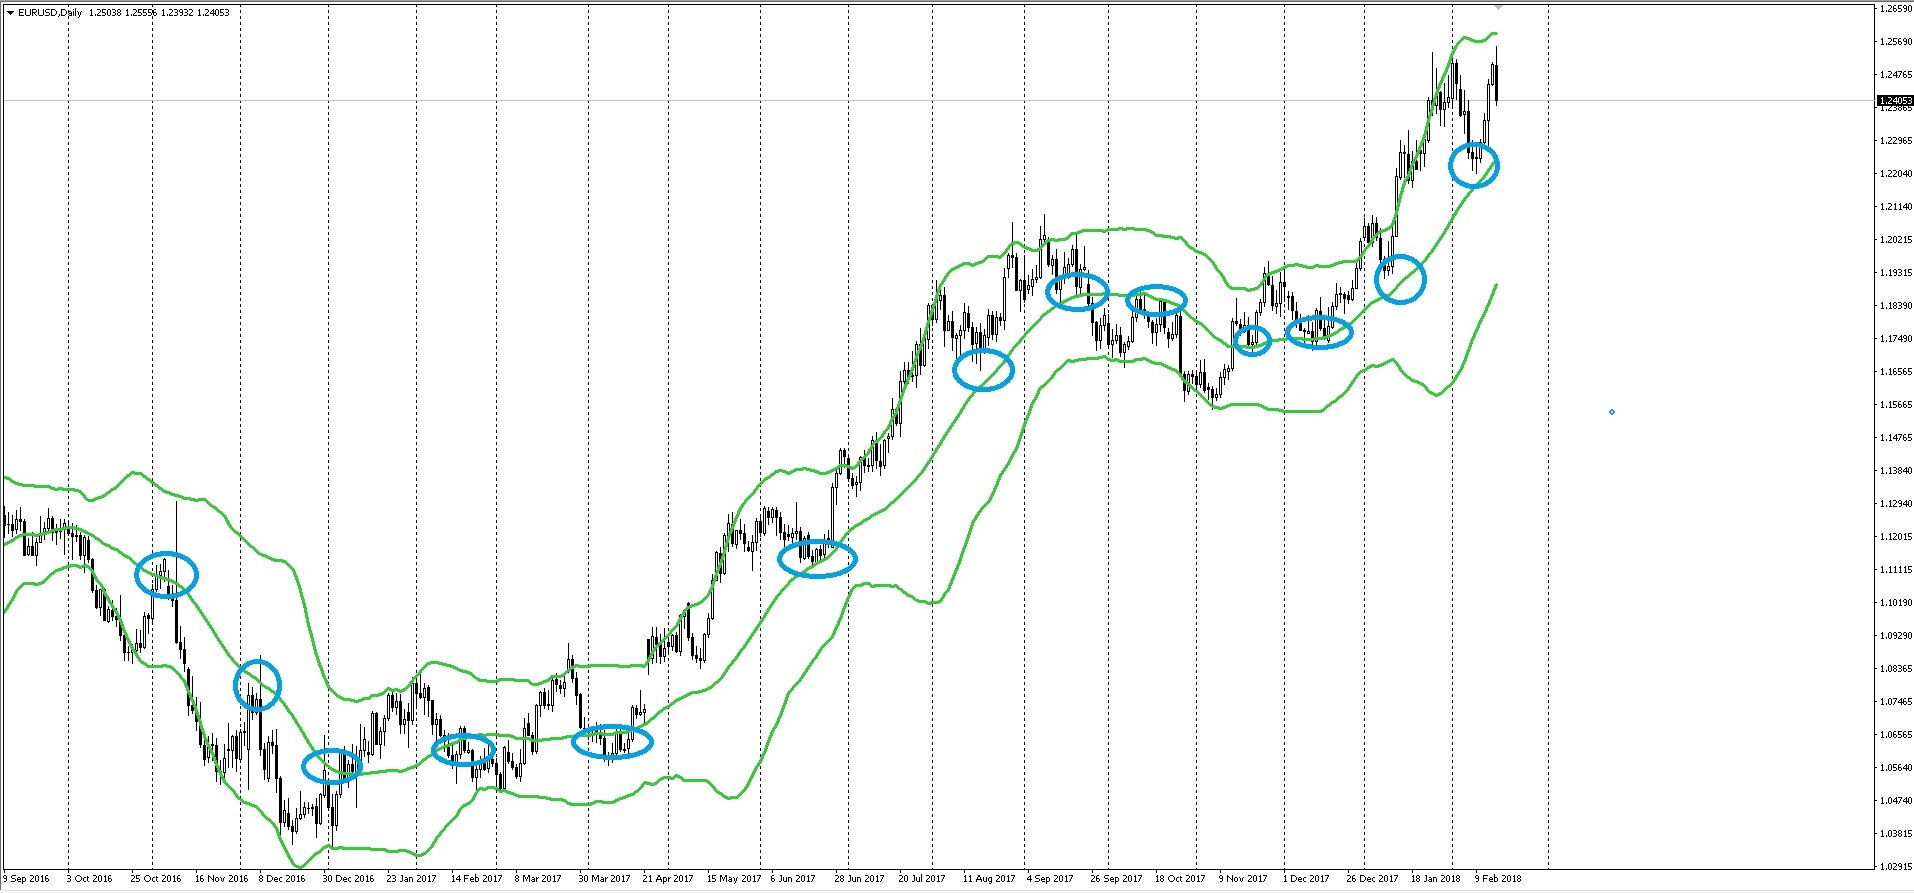 Instead of entering immediately as soon as a trend signal appears, it is sometimes useful to wait until price pulls back to a more favorable level. This will allow you to reduce drawdowns and the size of your stop losses. In this case, it is quite convenient to place limit orders at the expected pullback levels or simply enter at market.
But a pullback can always turn into a trend in the opposite direction. If you want additional confirmation that the signal is valid, you can also wait for the pullback and then enter with a pending order on a breakout of the range that usually forms when the pullback ends.
For this class of strategy, oscillators are often used to track when a pullback has ended, such as WPR, CCI, Stochastic, RSI, and others.
Trend lines

Trend lines are one of the oldest tools of technical analysis. At the same time, they have one feature that nullifies every attempt to automate trading based on them. The fact is that different traders see the market so individually that everyone draws these lines in completely different places. Numerous experiments confirm this: when various currency speculators were asked to draw trend lines on the same chart, not a single identical markup was found.
Therefore, drawing trend lines and trading along them is rather an art. And if one trader trades quite profitably this way, this does not mean at all that, following his advice, you will trade just as well. Moreover, you may not necessarily ever be able to trade trend lines profitably.
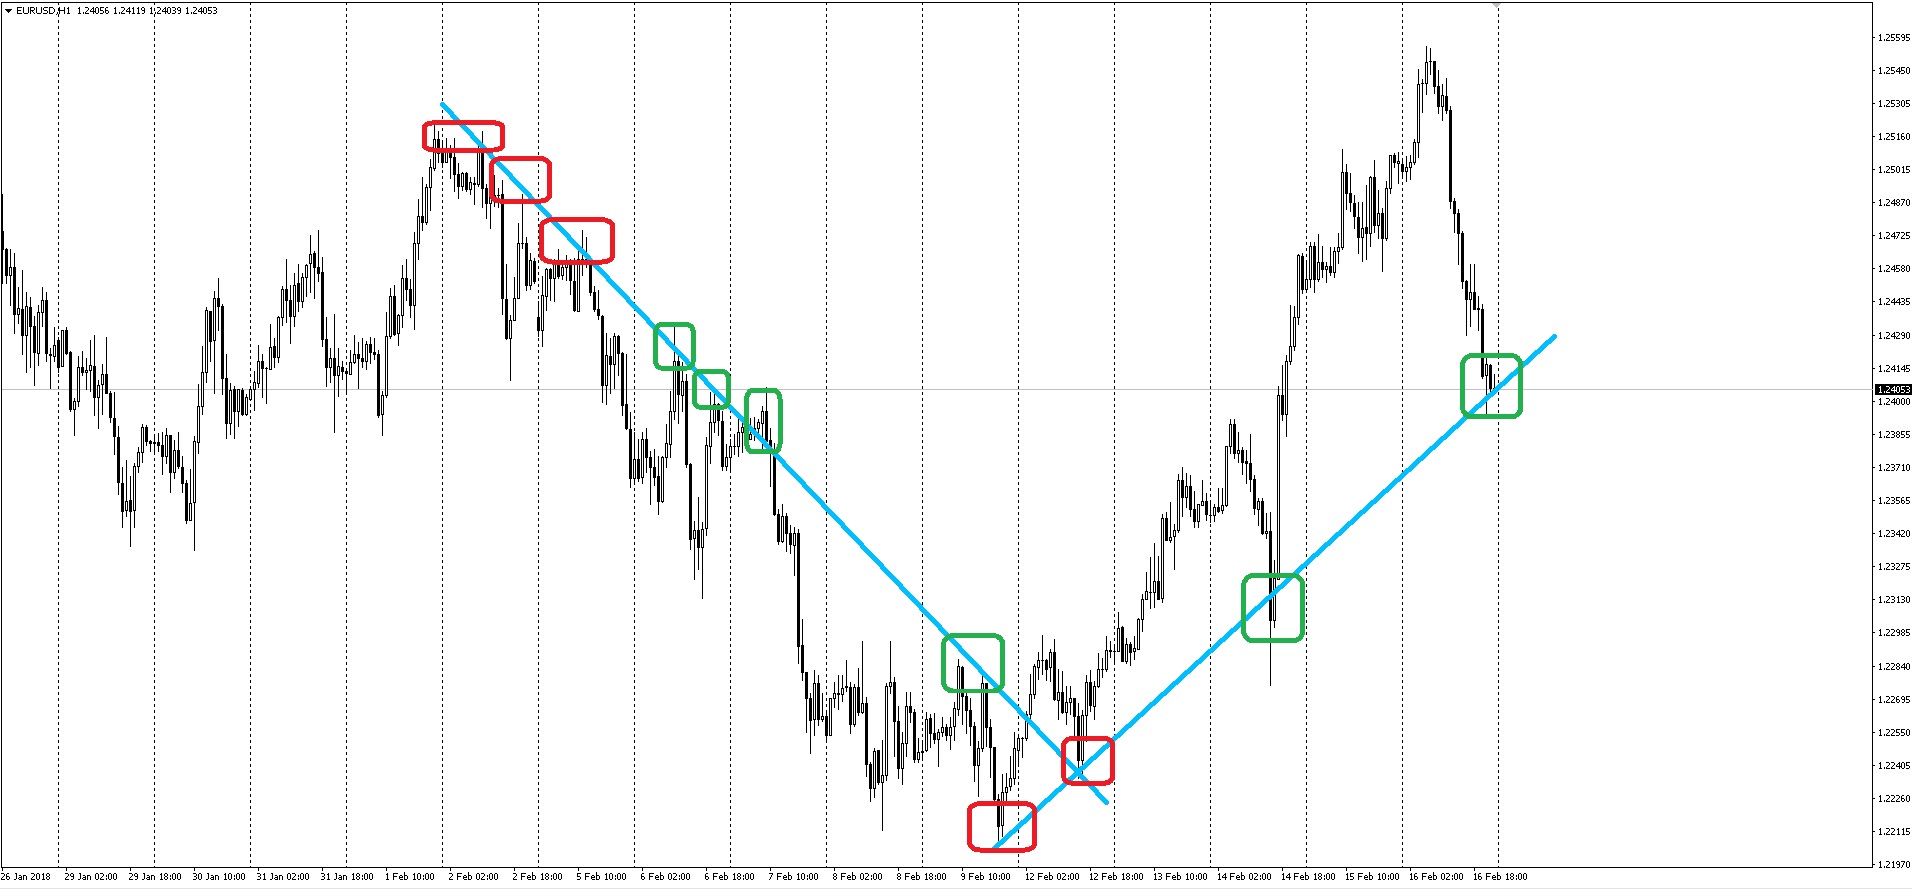 Within the scope of this article, entries are assumed on rebounds from trend lines. Quite often such entries occur in the direction of an already established trend, allowing you to capture a fairly large part of it. Naturally, no one can know for sure whether this rebound will be the last one or how profitable it will be. It is entirely possible that you will enter at the very bottom of a downtrend; the only protection here is the use of stop-loss orders and sound money management.
Moving averages

This is perhaps the most common class of trend trading systems. The figure below shows a simple moving average of closing prices with a period of 48:
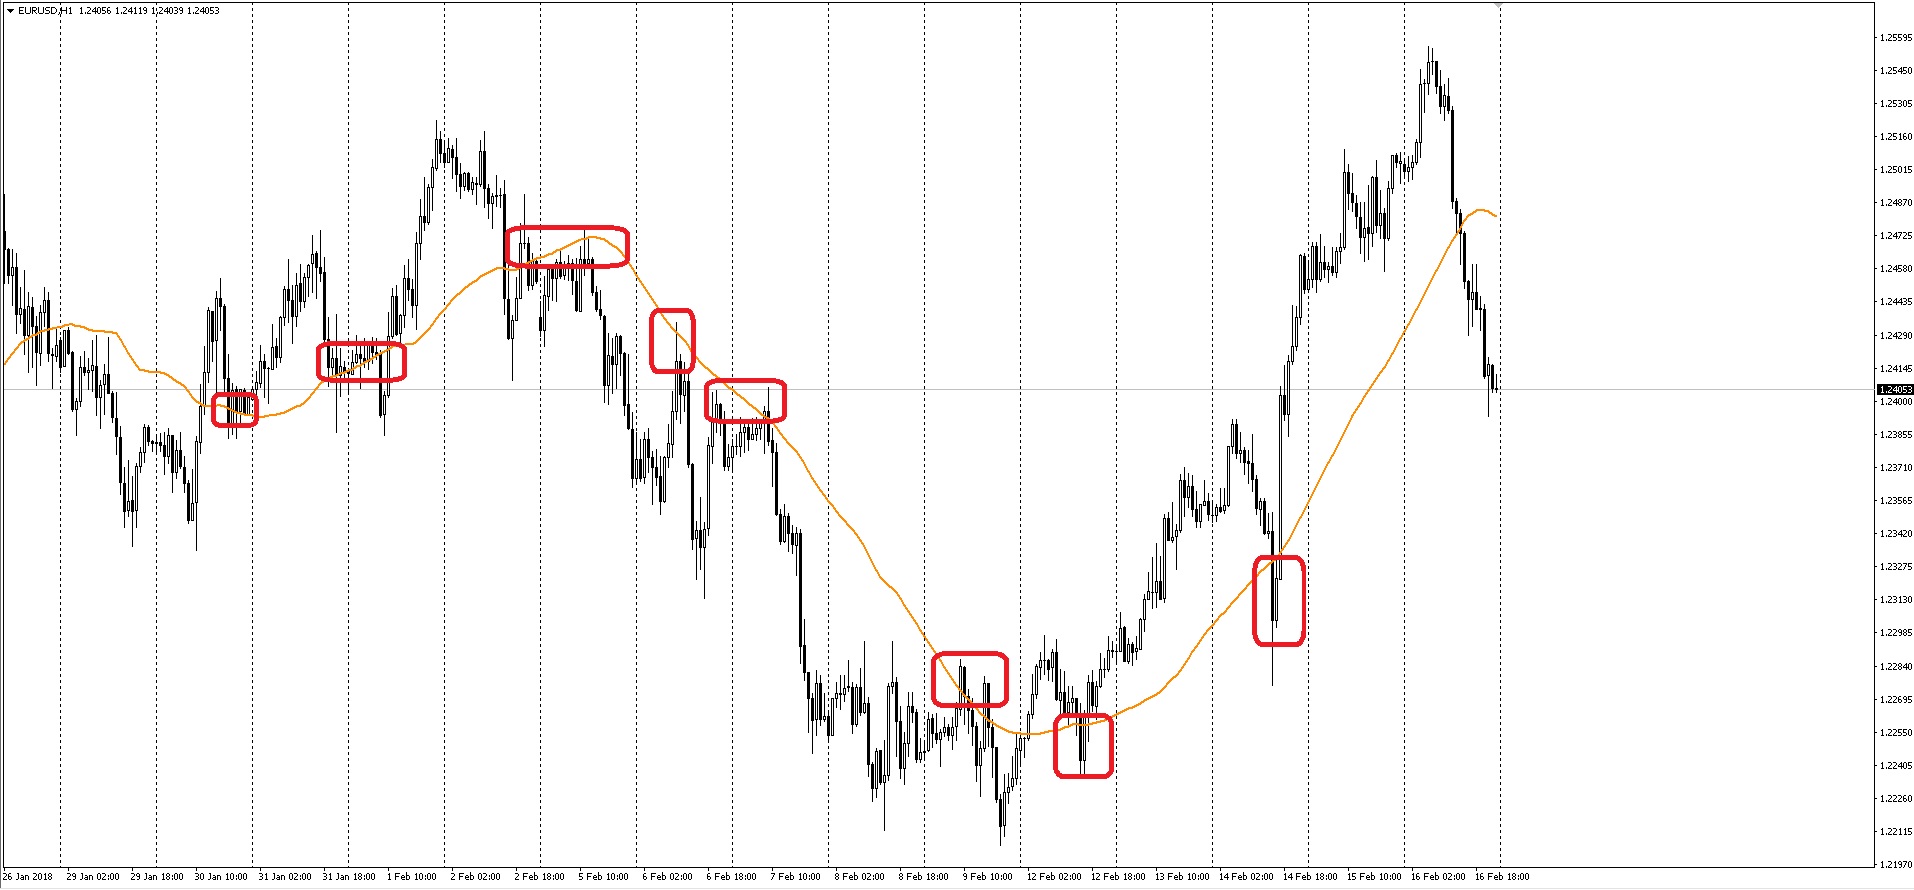 The principle here is the same as in the previous example: price rebounds from the moving average and that is when the entry is made. When trading this way, it is also convenient to use various channel indicators such as moving average envelopes, Bollinger Bands, or Keltner channels. They allow you to place stop-loss and take-profit orders along the channel boundaries. Narrow channels are also used as a kind of signal filter, much like in breakout systems, but only in the direction of the expected rebound. Until price breaks the boundary of such a narrow channel in the direction of the rebound, entry is forbidden. A simple example is Bollinger Bands with a deviation of 1 or even 0.5.
In addition, traders often wait for candlestick patterns that confirm the developing reversal. This makes it possible to filter false signals better. The same applies to the use of pending stop orders: of course you will give up part of the profit, but you will avoid entering when the moving average is being broken rather than reversed.
Entries based on trend-following moving averages are in essence similar to breakout entries. Such entries are intuitive, they will certainly get you into any major trend, and they are easy to execute even in Excel. But like most trend-following methods, these entries lag behind the market and enter any move late. Faster moving averages can reduce the lag, but they also make trading more choppy.
There are a very large number of strategies on the Internet, but most of them, as a rule, are quite straightforward and do not look at the market more deeply than is required by modern trading conditions.
Nevertheless, this class of trading system can be quite profitable. Examples of this type of strategy, which uses pullback entries based on a single moving average, are HA30 or Lindencourt. Another example, although not entirely exact, is the strategy Golden Boy. Not entirely, because it uses no classic indicators at all: both the moving average and the MACD are modified there.
In turn, pullback entries plus one of the channel indicators are used in the Gambit strategy. The strategy can be quite profitable, as shown by the results of the MilkyWay advisor, which traded for almost four years under the rules of this trading system.

Another option is to use the crossover of two moving averages, which we discussed above. Typical examples of such trading strategies are Surfing and Calm River.
Of course, two moving averages are not the limit. Using three moving averages is also quite common, as in Bill Williams' Alligator indicator. Based on this indicator, he built an entire trading system, "Trading Chaos", which is quite profitable on exchanges and can also be profitable in the Forex market after some modifications.
Perhaps some strategy authors believe that the more moving averages, the better. That is why sometimes you even see four moving averages in a trading system. But as a rule, they are divided into groups. For example, two averages are used to determine the trend, while the other two, faster ones, are used to identify specific entry points. Perhaps the authors of such strategies have never heard of the MACD indicator, or maybe they simply like the look created by many moving averages on a chart. After all, there are cases like this:
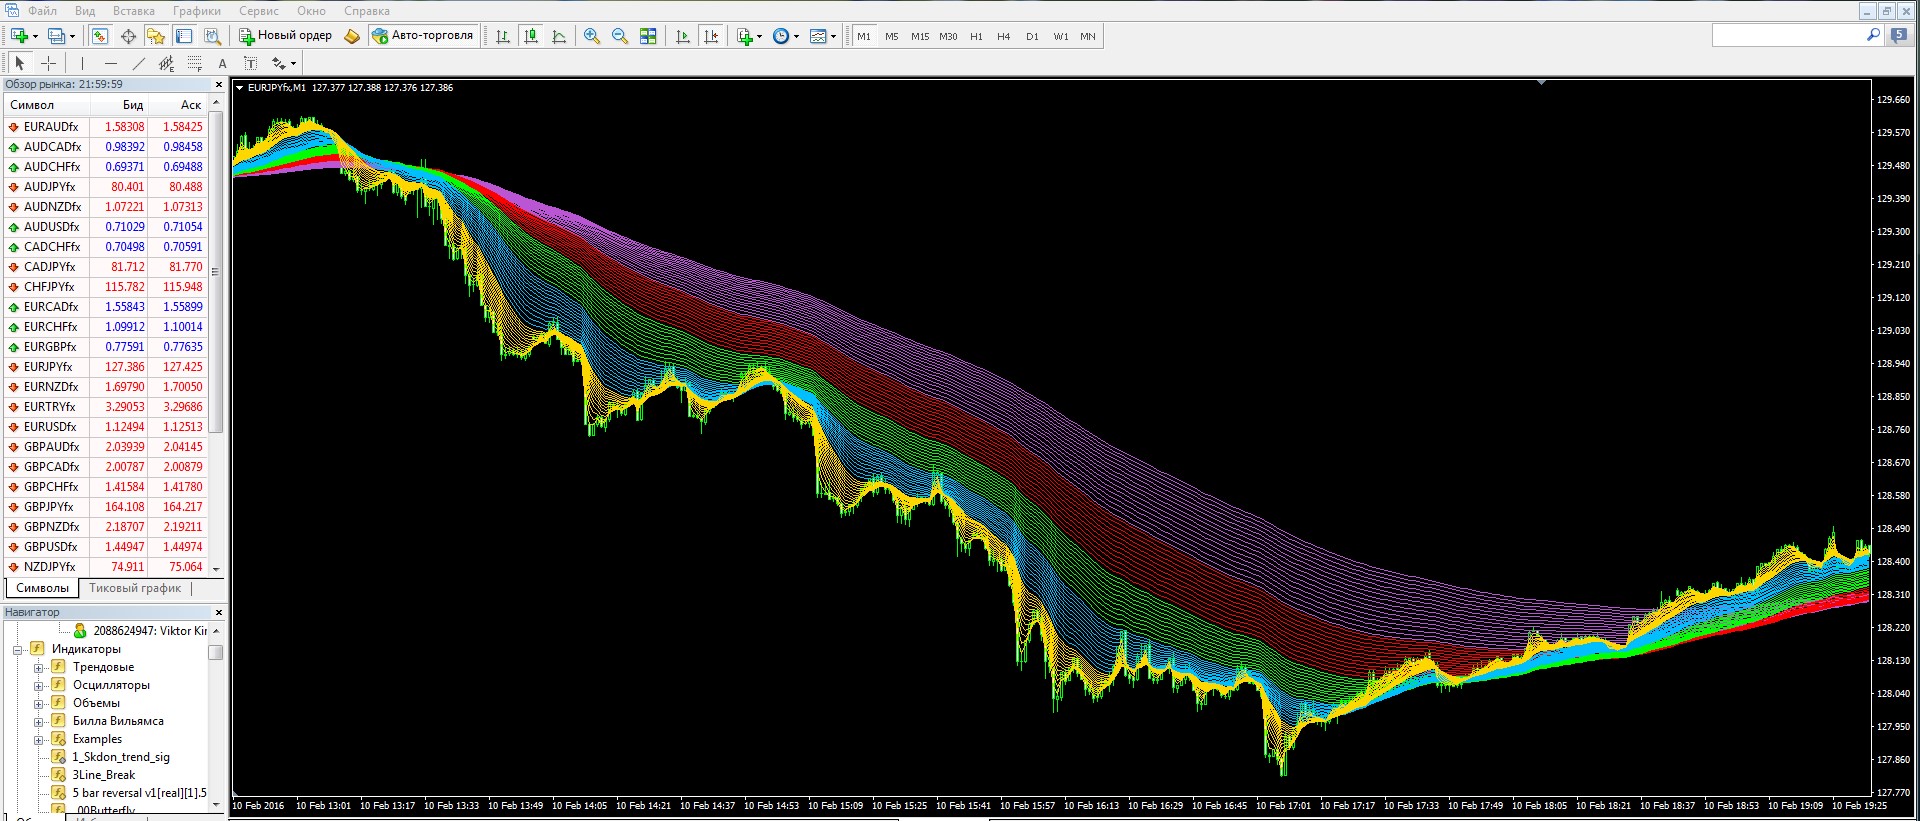 Beautiful, isn't it? The indicator is called Rainbow or something like that. There’s even a name for each color, and it’s not “Every hunter wants to know,” well, you understand. In fact, I don’t mind at all even a hundred moving averages, as long as it makes a profit.
Ichimoku Strategies

A whole article about this indicator was published recently. So we will not go deeper into its description.
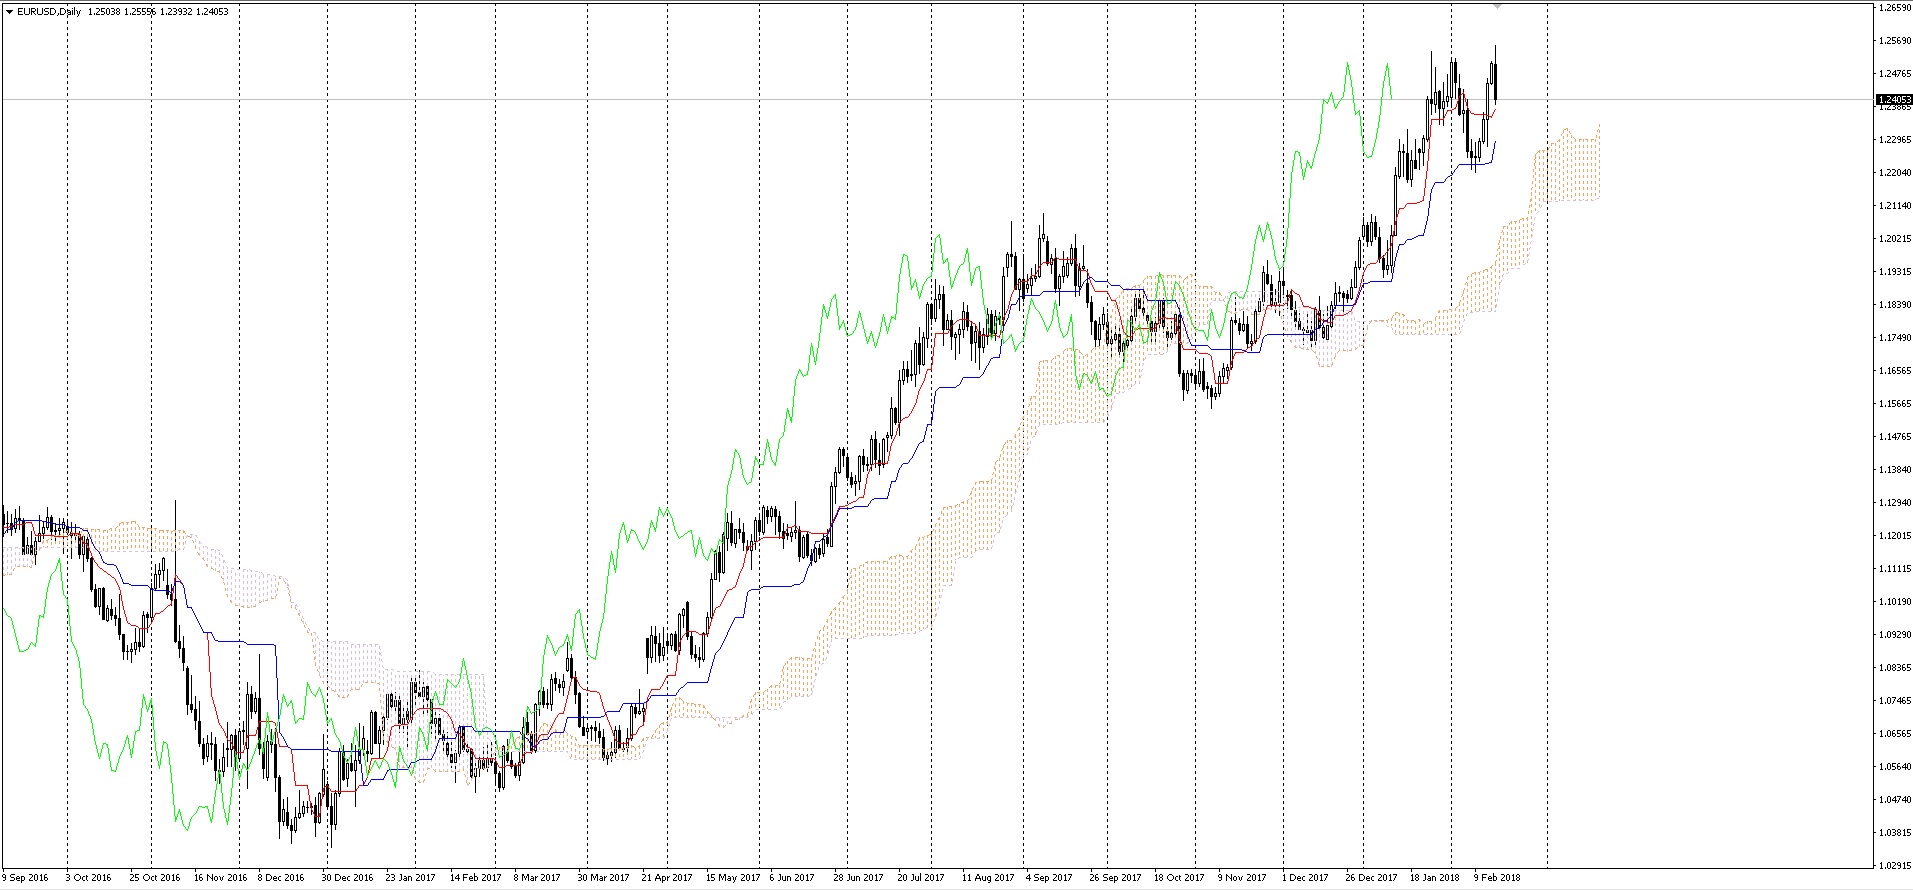 Let us simply say that this indicator is quite multifunctional and that, in addition to price breaking through the cloud, line crossings also produce excellent results. It uses an entire system, and if Ichimoku is applied correctly, there will be few entries, but they will be truly sniper-precise.
MACD indicator

The MACD indicator is also often used in trend trading systems. Despite the fact that many consider it an oscillator, the indicator is still trending in nature.
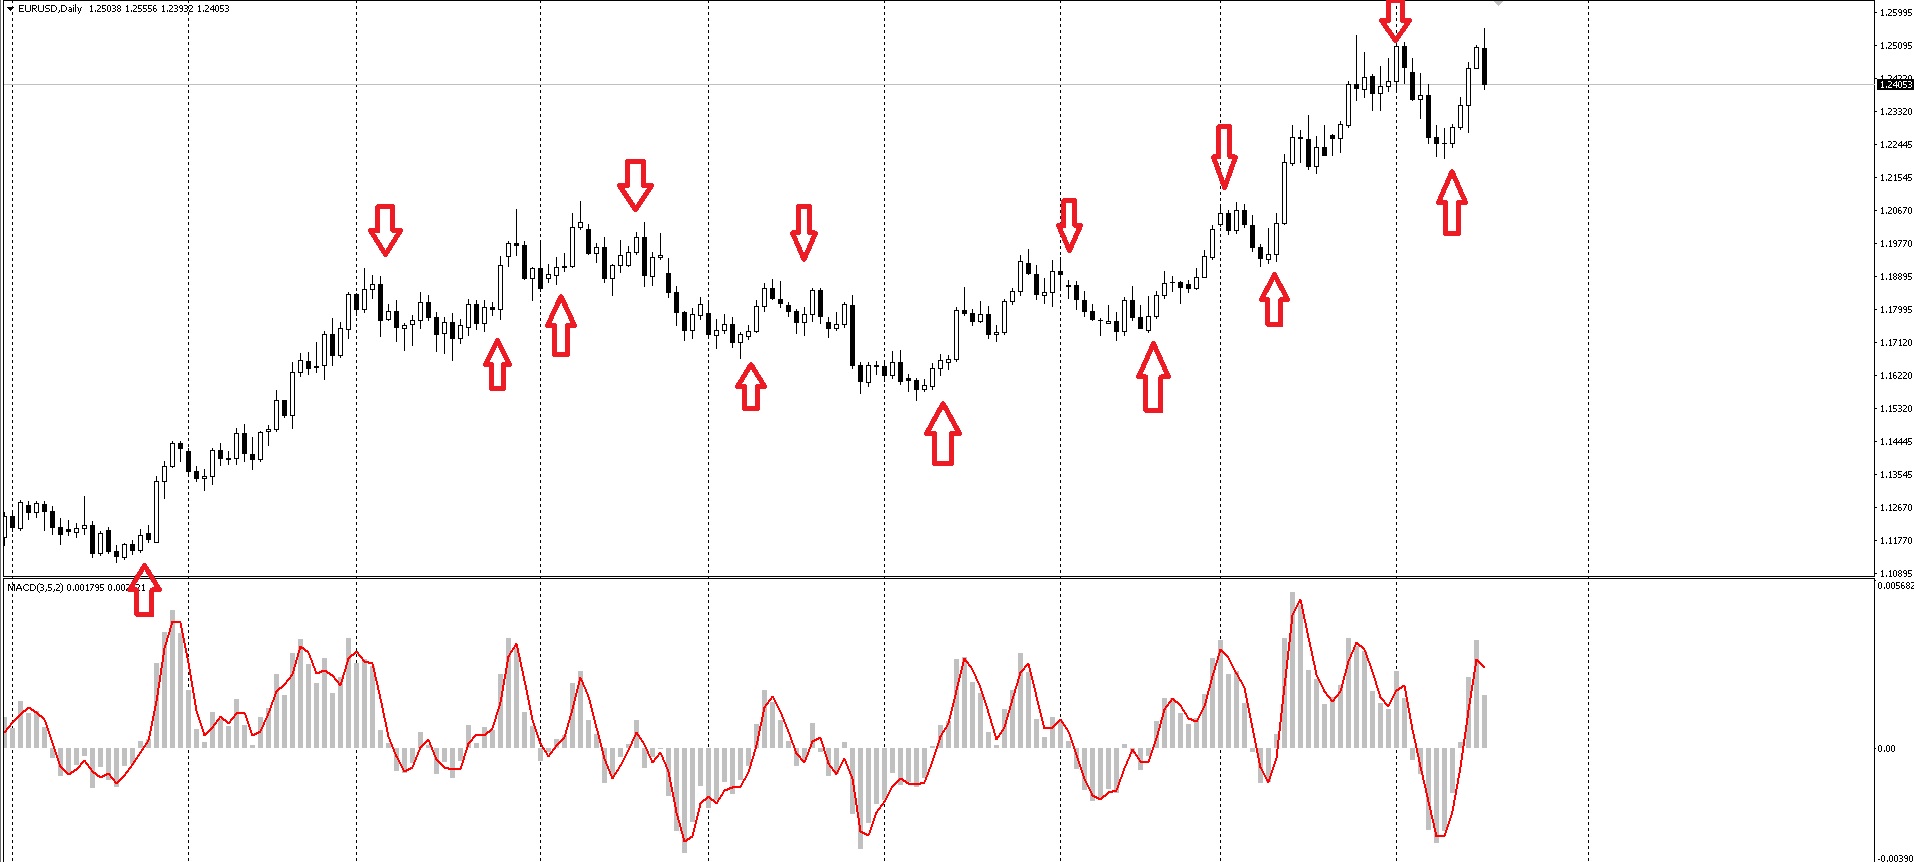 How to use the MACD indicator has already been covered more than once on the blog. While it is fairly difficult to cite a strategy example for Ichimoku, trend strategies using MACD are almost everywhere. Just take the previously mentioned Golden Boy.
Using oscillators in trend strategies

As you understand, a trend never follows a straight-line trajectory: there are always pullbacks, stagnation, slowdowns, and accelerations. The task of every trader has always boiled down to simple advice: buy low and sell high. Within the framework of trend strategies, that advice can be reformulated as follows: buy on pullbacks and sell when the trend is running out of steam.
Moving averages, Alligator, Ichimoku and other trend indicators are not capable of generating entry points at the best prices. They lag behind the market, but they perfectly signal the presence of an already existing trend. But there is a class of indicators that can be used to determine minor market fluctuations. And these are, of course, oscillators.
Many traders use trend trading strategies with entry precisely at the moment of pullbacks, since when you buy on a pullback, you are essentially buying at the best price. This approach often uses a trend indicator to determine the general direction of the market and one or more oscillators to determine the completion of a pullback.
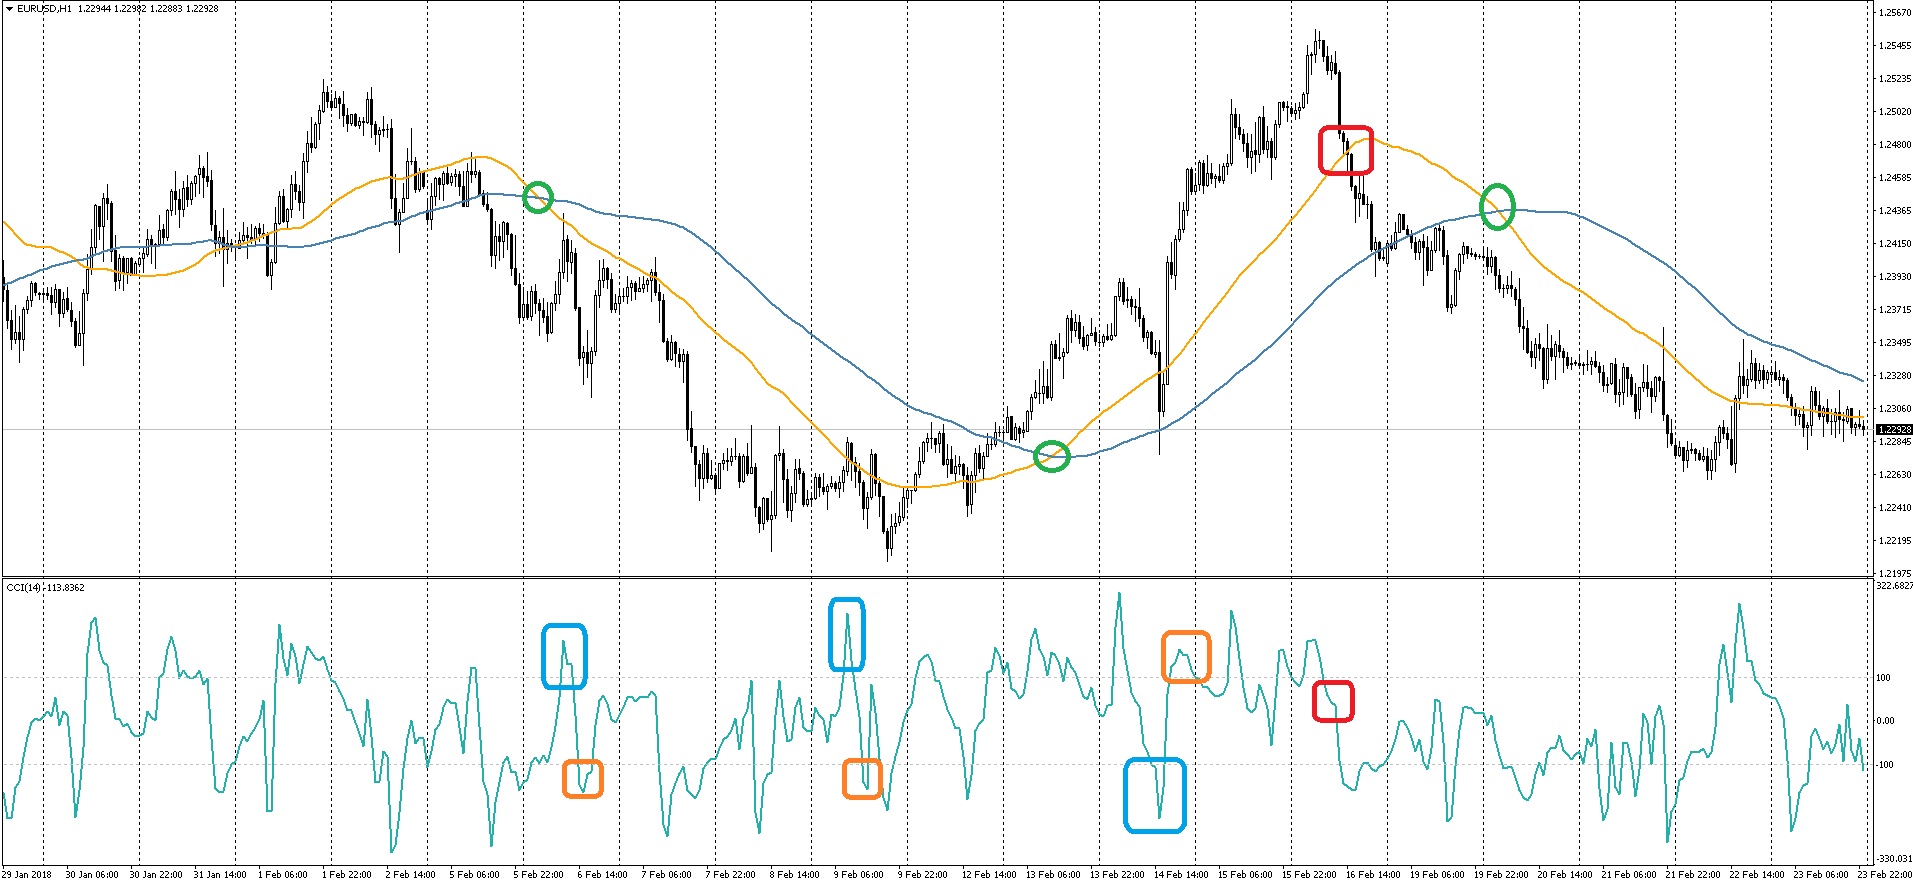 Here is a simple example of such a system: the trend is determined by the relative position of two simple moving averages with periods of 100 and 48. An entry is made when price approaches the moving average from the correct side (from below for sells and from above for buys) and the CCI indicator is beyond the 100 or -100 levels.
I marked the change of trend (the averages crossing) with green circles, potential entry points with blue rectangles, exit points with orange ones, and the red square marks a false signal filtered out by the CCI oscillator. As you can see, on trending currency pairs even such a simple trading system can be quite profitable.
You do not have to use indicators to determine when a pullback has ended. For this purpose, traders often use various levels such as Fibonacci, Murray, Camarilla, and others. Price Action patterns are also often used to confirm a signal.
In addition to the already mentioned "Gambit" system, the idea of entering with the trend on a pullback is used in such well-known trading systems as "Elder's Three Screens" or the legendary "Base 150." In the latter, the entry occurs after a moving-average breakout, but it is still highly recommended to wait for a pullback after that breakout. It is also worth getting acquainted with the modern version of the three screens, the Wildfire strategy.
Conclusion

Trend trading systems are the oldest type of strategy. Trends have always existed in markets, they still exist today, and they are unlikely to ever disappear. So the trend is one of the most stable and reliable market inefficiencies that is worth using to your advantage.
At present there are a great many trend trading systems, but in most cases they all boil down to the few classes that I tried to describe in this article. And no matter what happens to the markets or what changes they undergo, trends will always exist. That means trend trading systems will remain a reliable tool for traders to earn money for a long time to come.
Best regards, Dmitry aka Silentspec TradeLikeaPro.ru
