
How to Transfer Trades from Myfxbook Monitoring to a Chart

The easiest way to start trading profitably in the market is to analyze the work of successful traders. Myfxbook is the largest monitoring site, where thousands of accounts and strategies are analyzed every day, making it an almost ideal "source of inspiration". But an equity chart does not give complete information about how a trading strategy works. An important advantage of the service is the open trading history of accounts. By using the trade history, you can reconstruct the original strategy.
Naturally, the easiest way to do this is directly on the chart in the terminal, but manually transferring trades to the chart one by one is completely inefficient. That is why an automatic script for MT4/MT5 and our instruction will help here.
Transferring Trades
So, first go to the monitoring page of the account you are interested in on the MyfxBook.com service.
To download the trade report, you will need to register for the service. It is free.
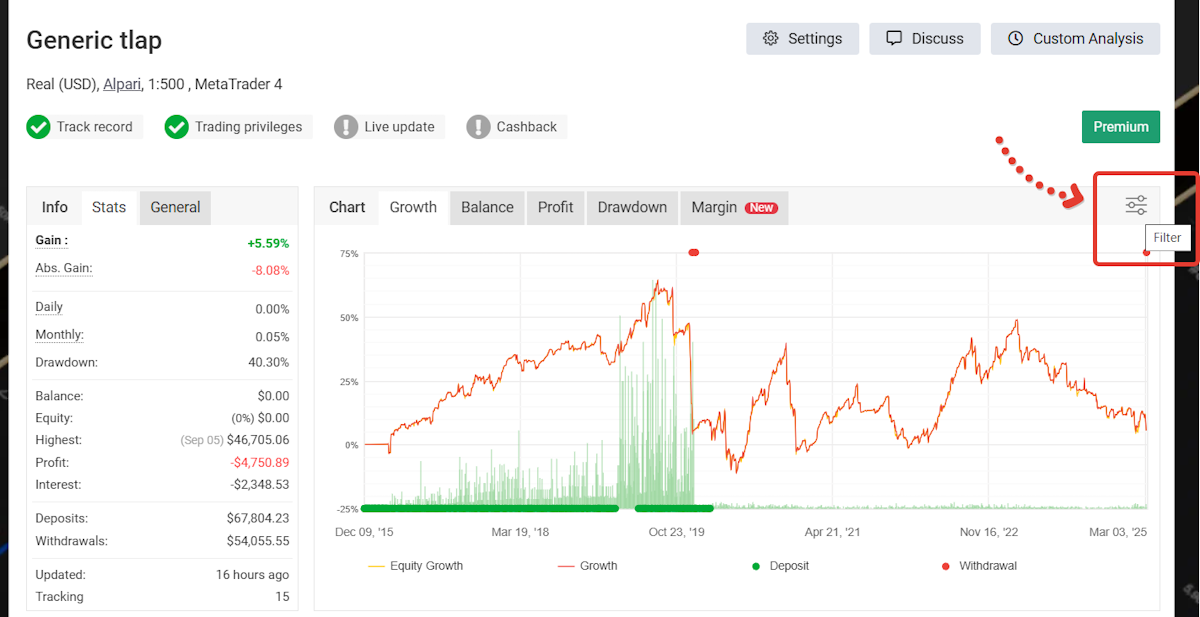
- In the upper-right corner of the equity chart, click the Filter icon:
Next, in the drop-down list select "Export" -> "CSV"
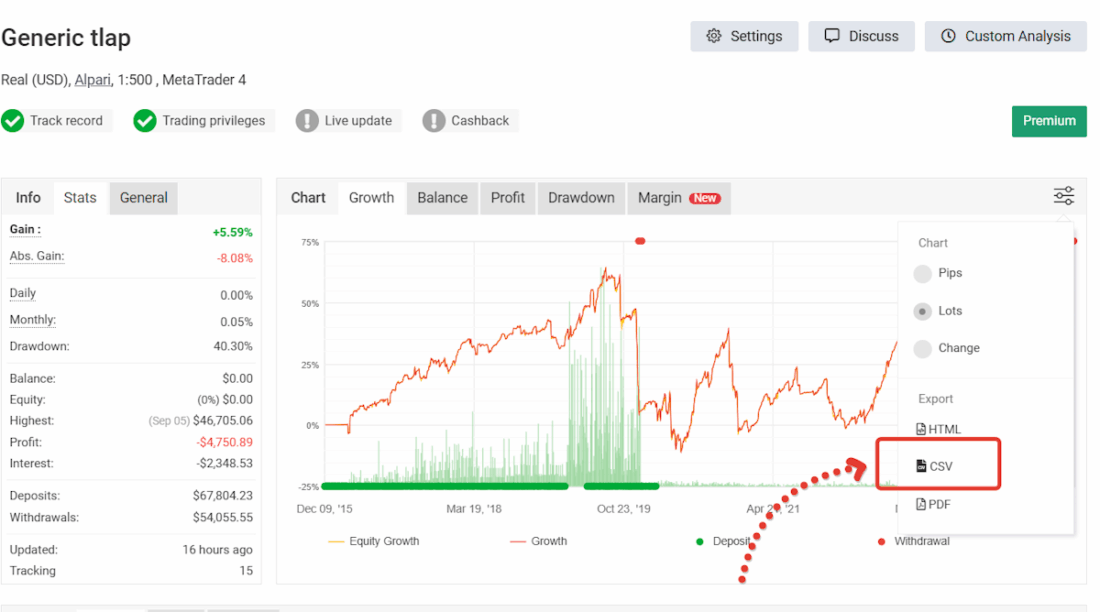
After that, the service will inform you that it has sent the report in CSV format to your email inbox.
This is the file with the history of all trades. The task now is to display the trades from the list on the chart of the trading platform.
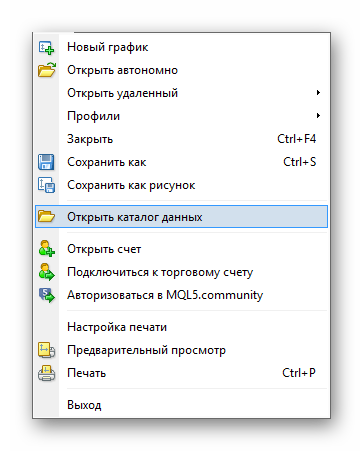
2. Open Metatrader 4 / Metatrader 5, then go to the "File" - "Open Data Folder" menu.
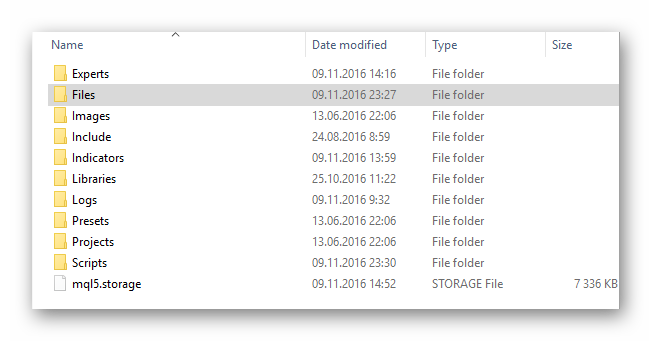
The terminal data folder will open. The file with a long name like "statement2f130e1946d75cf3d65a59f2c5955d70.csv", which arrived by email, must be moved to "MQL4/MQL5" - "Files". You can rename the file to any other name.
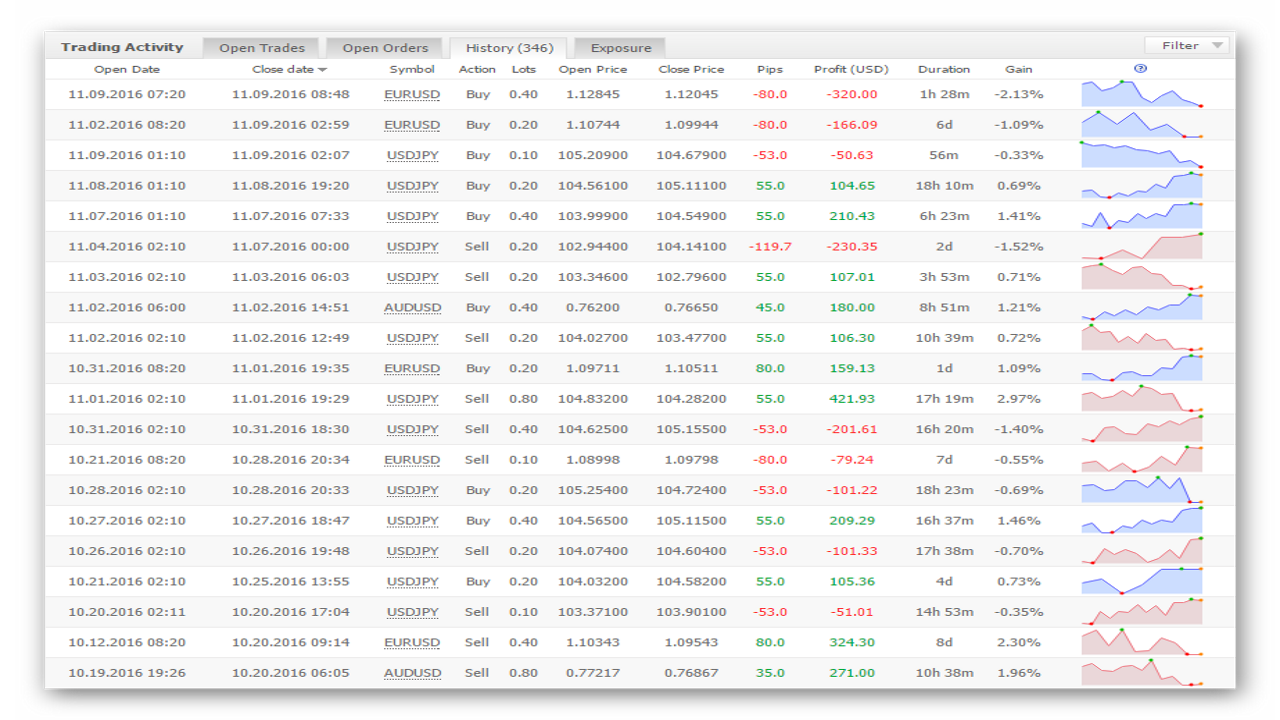
Then in the terminal open the symbol you are interested in, usually the symbol with the largest number of trades. You can see which instruments are traded most actively on the monitoring site in the "History" section:
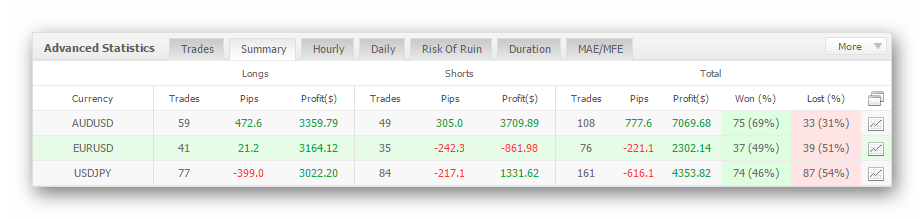
Or in the advanced statistics summaries (the "Trades" column shows the total number of trades for the instrument):
3. Next you will need a special script, which you will find at the end of the article. Its installation is standard.
After opening the required symbol, run the script, specify the name of the history file (this is important!) and, if required, the time shift (needed to adjust the time zone of your broker to the time zone of the quote source).
You can also set the date range for the history display if you need a specific segment, the time shift relative to the broker time on the monitoring, and ask the script to calculate the lots of all orders or the profit in points or in the deposit currency.
During the copying process, an information window will appear with the number of copied trades.
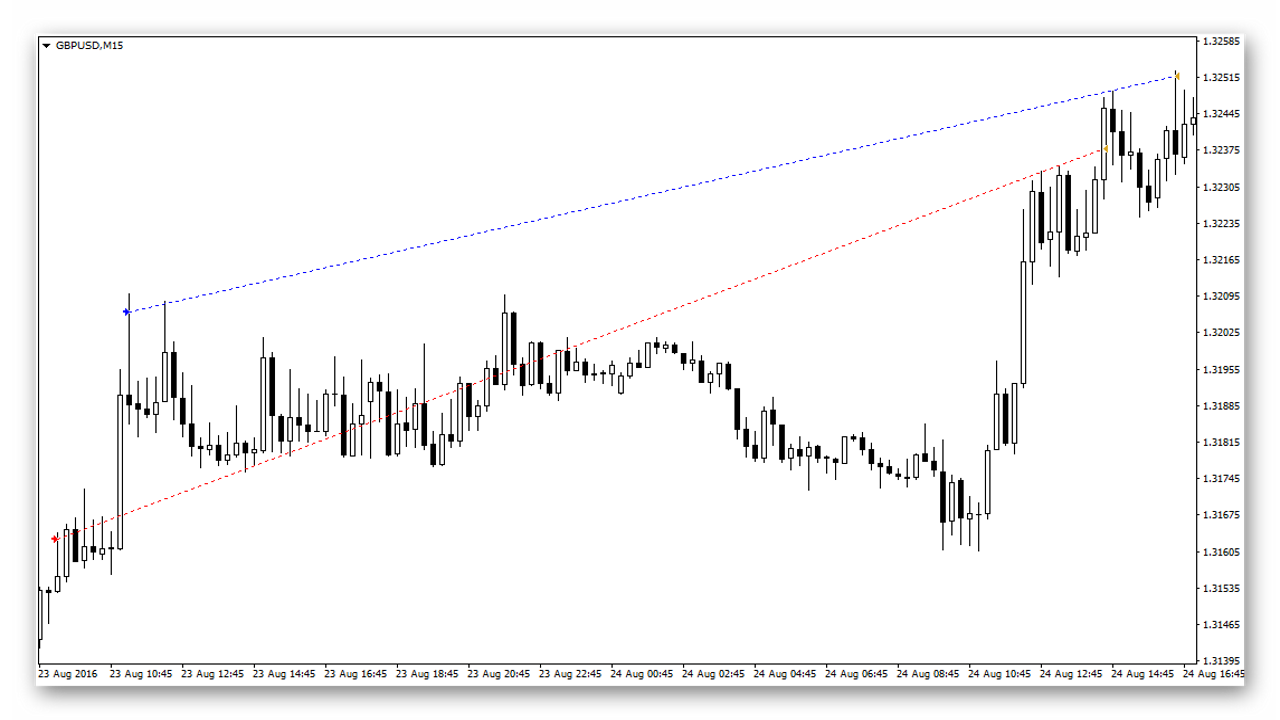
All trading deals will now be displayed on the chart, as if you had transferred them directly from the terminal history. When you hover the mouse over a trade, its sequence number and volume are displayed.
Analyzing the History
By the trading history, it is not difficult to determine what type of strategy the analyzed trade history belongs to: trend-following, channel-based, grid averaging, or martingale. At this stage, you can discard trades that do not deserve detailed study or show no signs of systematic trading.
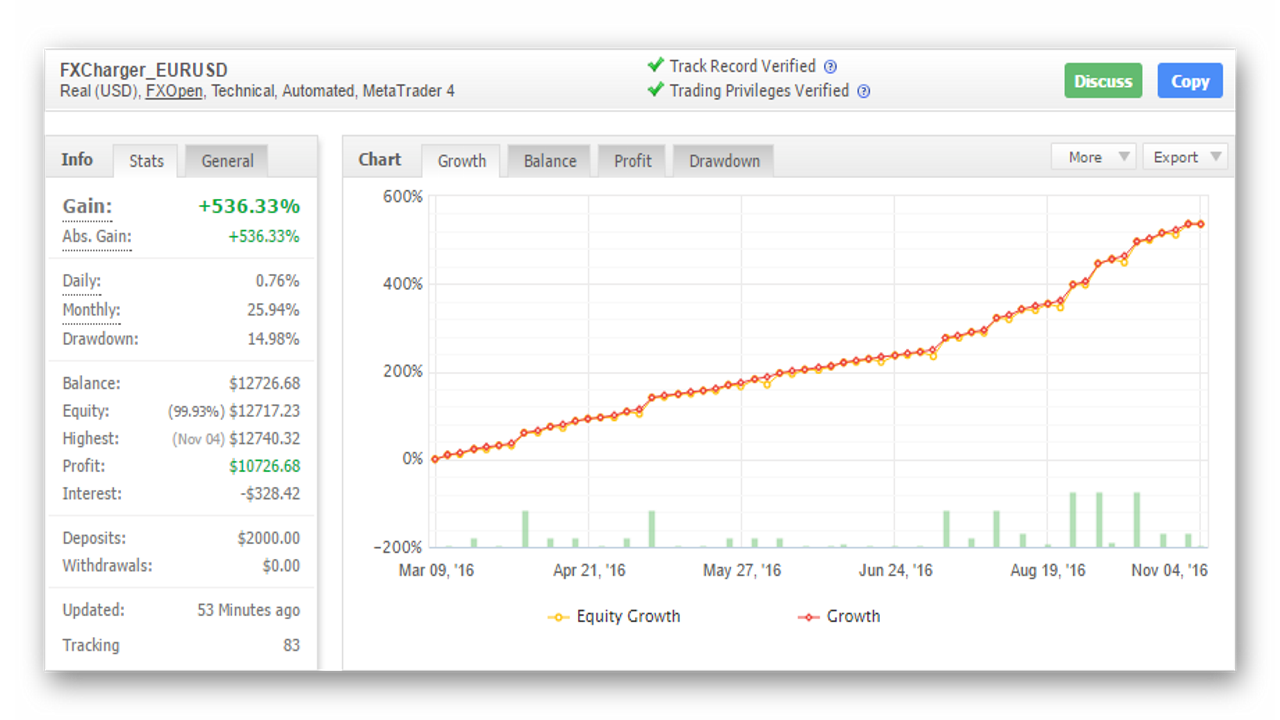
So, for example, let us try to analyze the first account we come across with a beautiful equity curve.
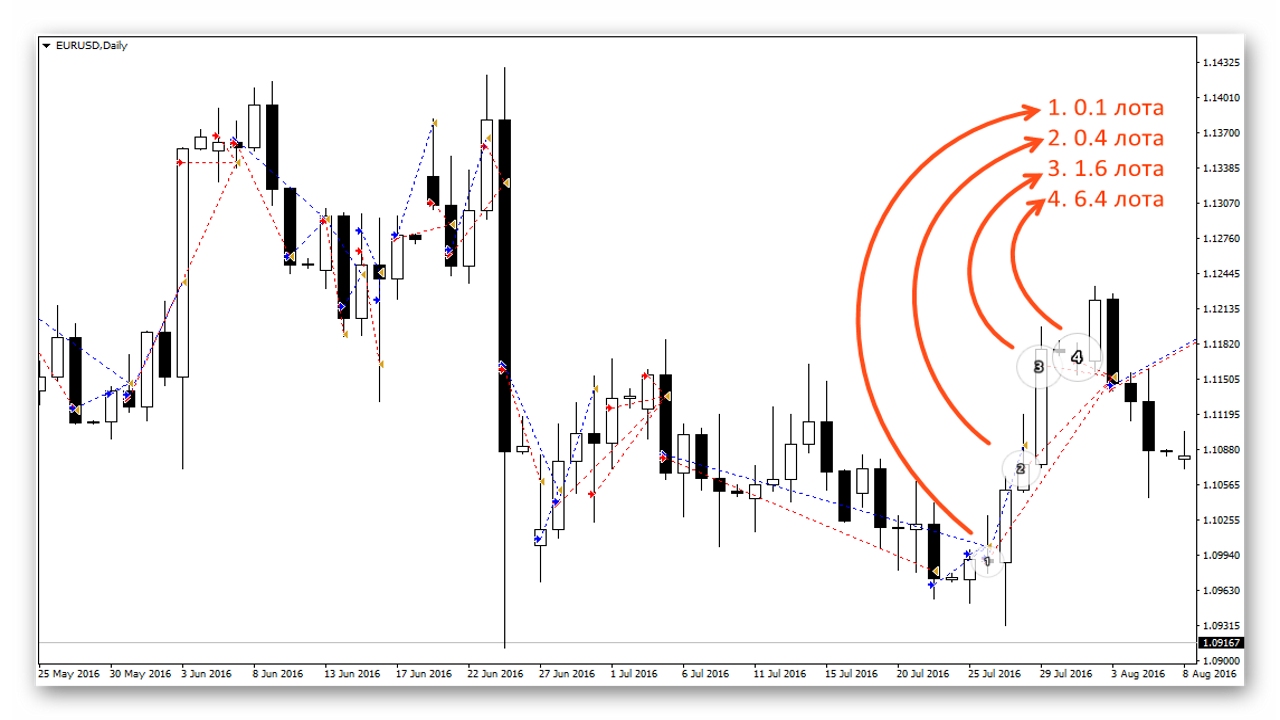
We transfer the history onto the chart. It is immediately clear that this is not a typical grid system: the frequency of trades varies greatly both in time and in price. Apparently, trades are opened based on a signal from some indicator. The fact of a fourfold lot increment is alarming. To bring a series of trades into profit, the lot increases from 0.1 to 6.4, that is, by 64 times. This may be sitting through losses with a hard martingale.
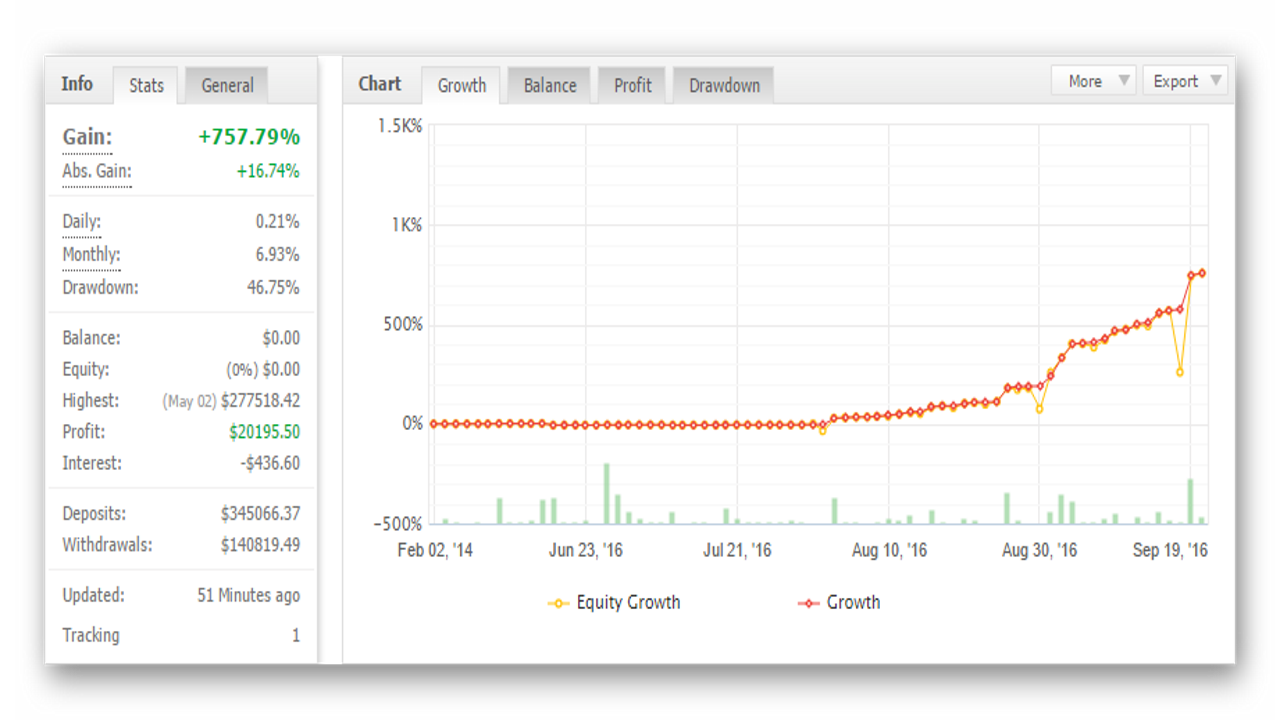
Another account with attractive profitability figures, but a fairly large drawdown. Let us try to transfer the trades onto the chart to determine what caused such a drawdown.
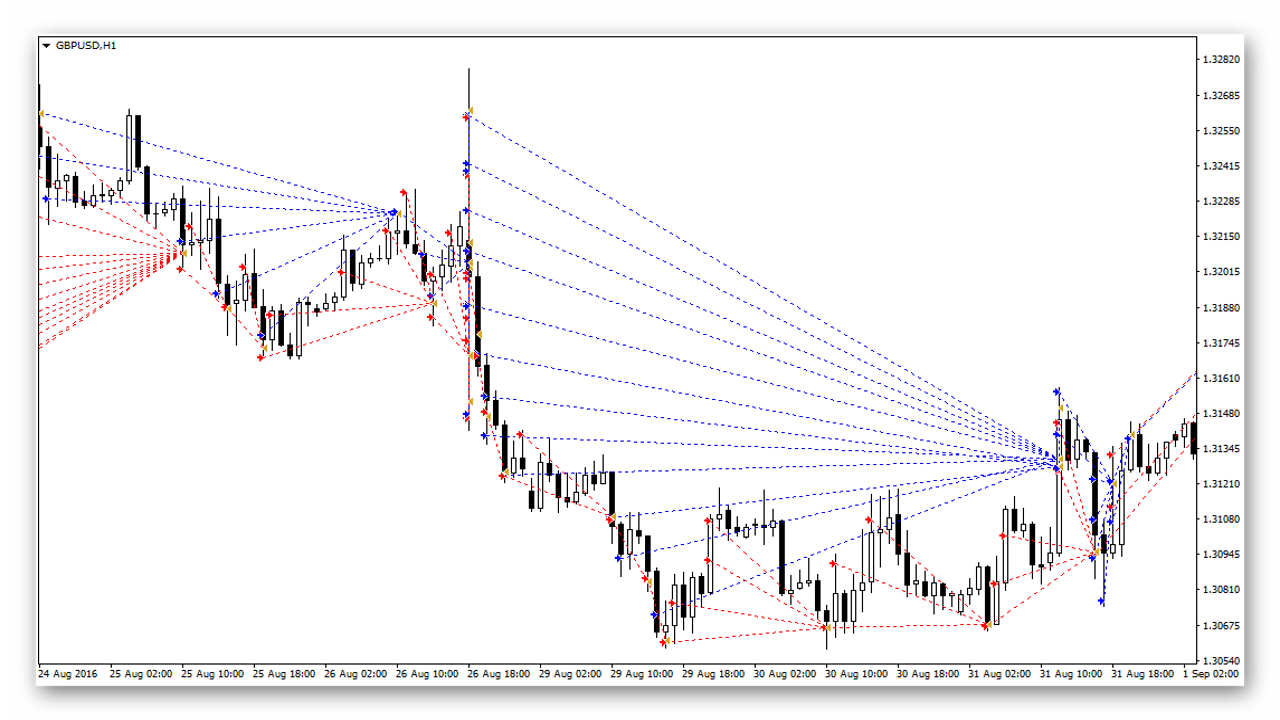
So, on the chart we see the order fan typical of a grid system. The grid step is fixed and amounts to 15 points. The lot increment is a sequence of Fibonacci numbers. Apparently, for partial risk hedging, trading is conducted simultaneously in two directions. The main task of such a strategy is to bring a series of trades into profit as quickly as possible. The opening of the first trade is not justified by any forecast and is purely random in nature.
Another beautiful chart with more modest profitability figures:
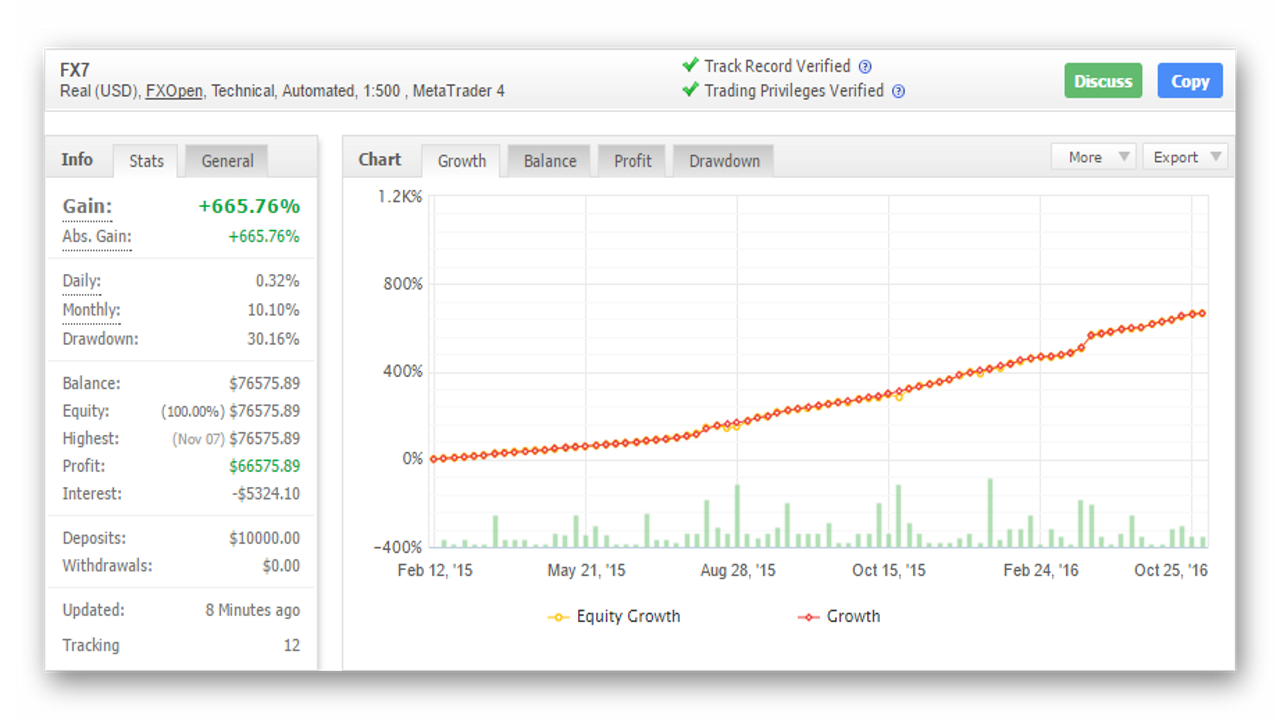
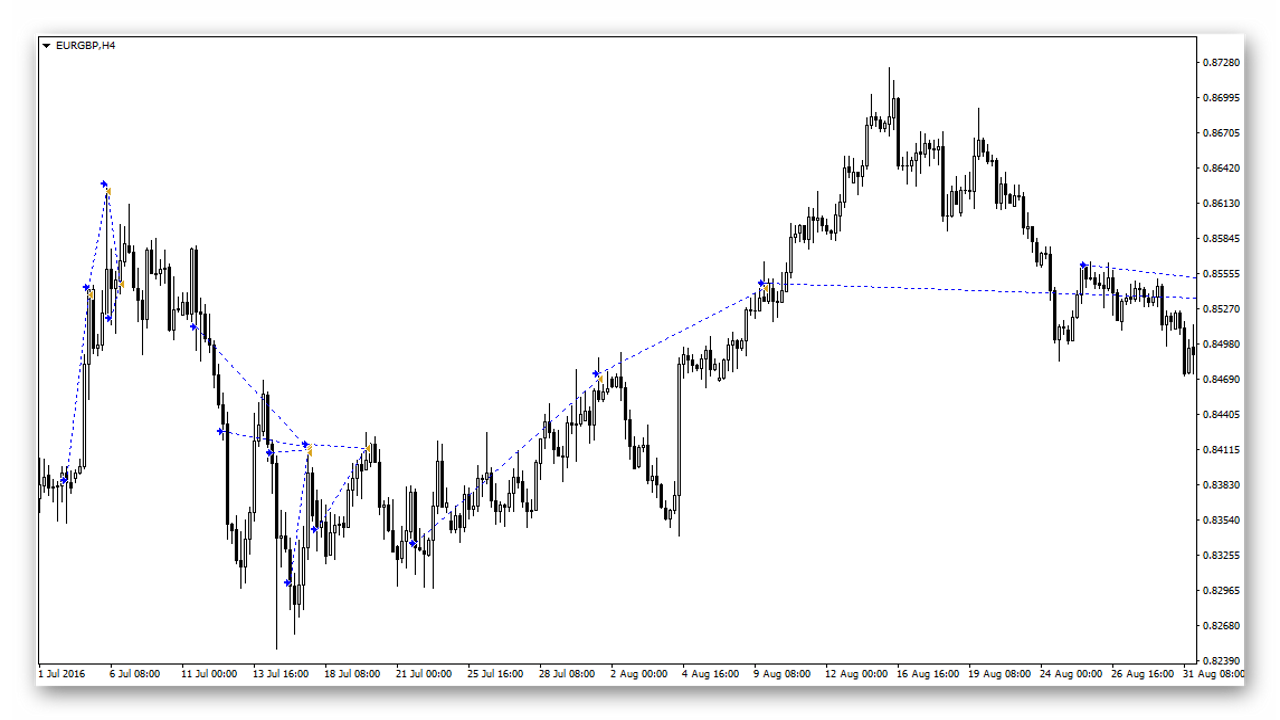
In the history, we see signs of trend trading: long position holding and large profits. To determine the entry point, most likely a technical indicator with a sufficiently large period is used, since positions are opened with some delay in the direction of the long-term trend.
Conclusions
By analyzing the trade history of profitable trading strategies, you can not only find ideas for your own trading system, but also get a working TS "for free". Displaying trades on a chart is much more visual than dry figures in reports, which do not always make it possible to identify primitive grid systems and other risky strategies. With the help of the script, you will be able to quickly obtain the history of a trading account and immediately transfer it onto a chart in MT4/MT5.