
TradingView Service Review - Become a Guru of Chart Analysis

Hello, fellow Forex traders! The MetaTrader terminal undoubtedly has truly unlimited possibilities for technical analysis, but the downside is that these possibilities are not always easy to put to use. To build the same Renko charts, you will have to sweat. And not every OS, including mobile ones, has the ability to use a full-fledged terminal.
The TradingView service comes to the rescue: it is an advanced chart provider offering a web platform for analytics, trading, and testing trading strategies. The platform's arsenal includes 10 chart display types, as well as a large set of tools for graphical and technical analysis.
The advanced capabilities of the service include building synthetic charts (for example, oil against the ruble), volume profile indicators, custom timeframes, and much more.
Working with Charts

The first thing you notice when entering the platform is the flexibility of chart setup and scaling. At the same time, that very scaling, unlike most other providers based on browser technology, happens smoothly and intuitively. But this is most likely thanks to the chosen technology, since all of the service's charts are built on HTML5, the most modern web standard. The platform also has some unique features. These include rather rare types of charts and graphical tools.
At first glance, the platform interface is minimalist. The controls do not get in your way and are spread along the edges of the screen. In the center is the chart, which probably occupies 90% of the entire workspace. Each menu has its own special purpose, so let us look at them in more detail.
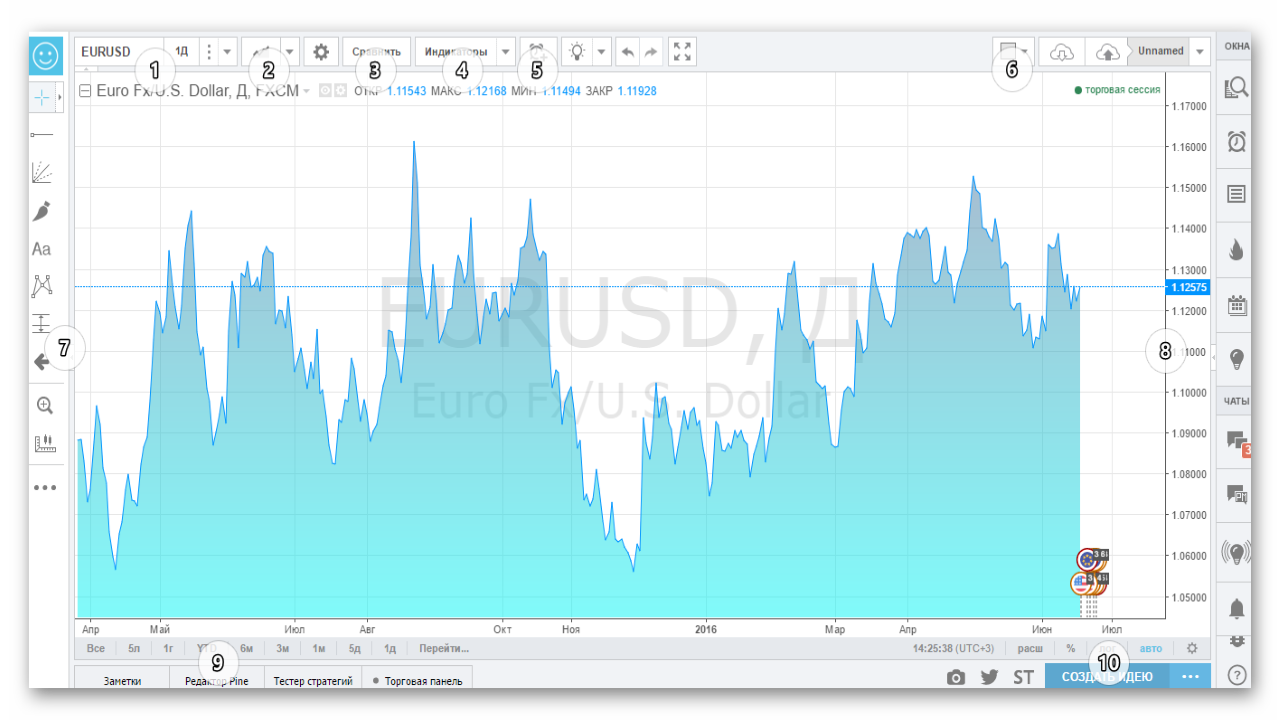
- The menu for selecting the working instrument and timeframe of the current chart. The instrument input field supports the full list of arithmetic operations: division, subtraction, addition, multiplication, and exponentiation. This makes it possible to build a spread chart of any complexity.
- Selecting the chart display type.
- Adding an additional instrument to the chart. The function can be used for pair trading or for trading the spread of a basket of instruments.
- Adding an indicator to the chart.
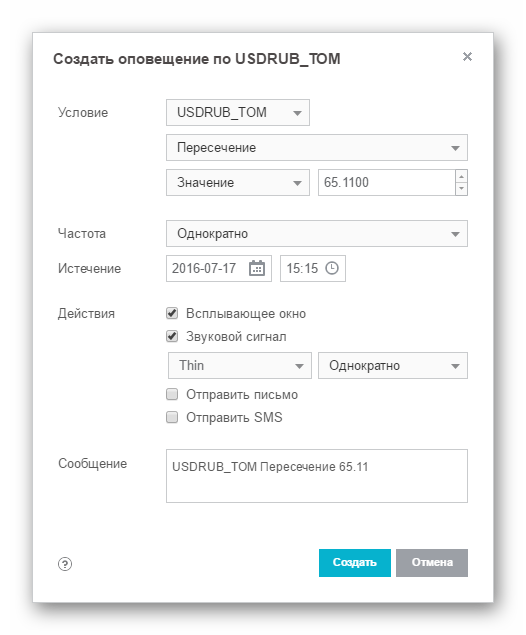
- Creating customizable alerts. Here you can specify the alert condition, its delivery method, and the message itself.
- Changing the arrangement of charts on the screen (you can open up to 8 charts in one window).
- Menu for selecting graphical tools.
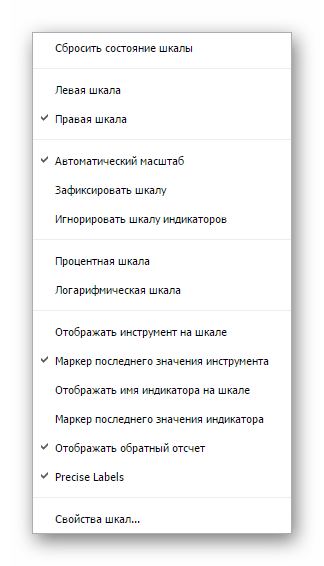
- A flexibly configurable price scale.
- Using the built-in Pine language, programmers can extend the platform's functionality with their own scripts.
- With the trading ideas service, you can share your own trade entries or use the methods of other traders in your trading.
Chart Types
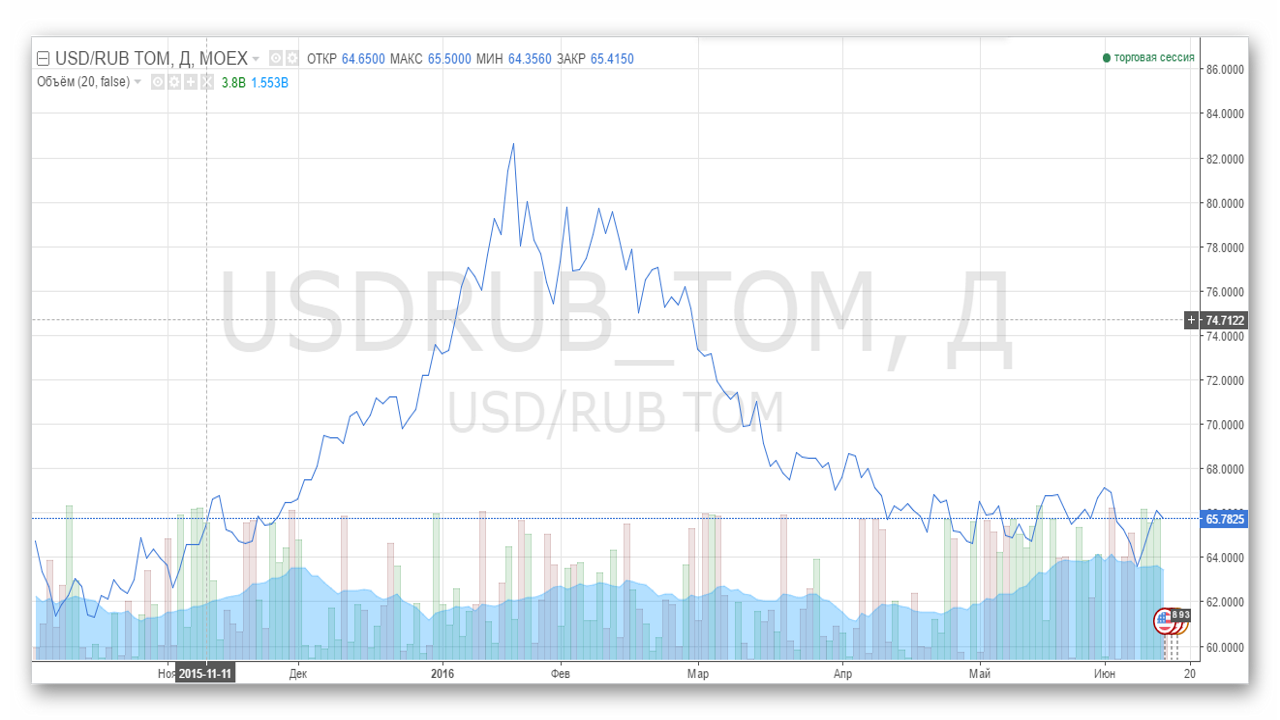
- Traditional line chart based on closing prices.
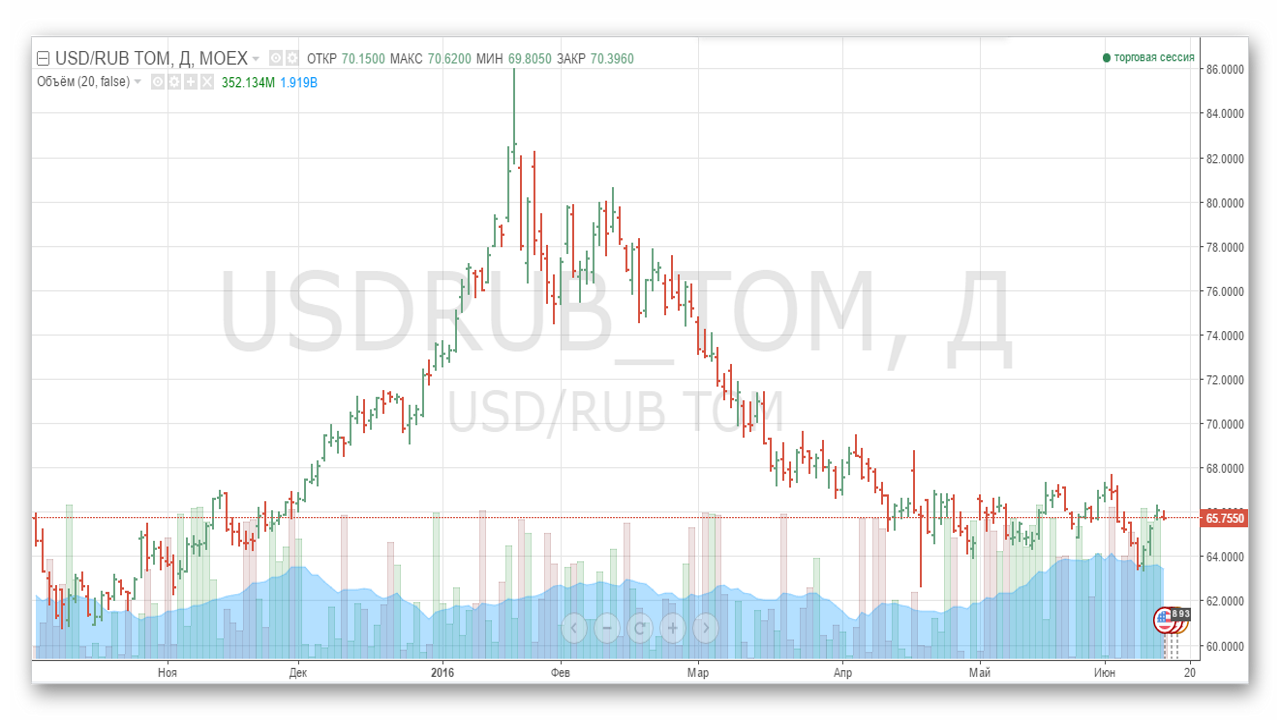
- Bars are one of the most popular methods of displaying price. A bar is a vertical line whose top marks the maximum price for the period, while the lower value marks the minimum. The stroke on the left shows the opening price, the stroke on the right shows the closing price. An ascending bar is drawn in green and means that by the end of the period the price was higher than at the opening. A descending bar is drawn in red and means that the closing price is below the opening price.
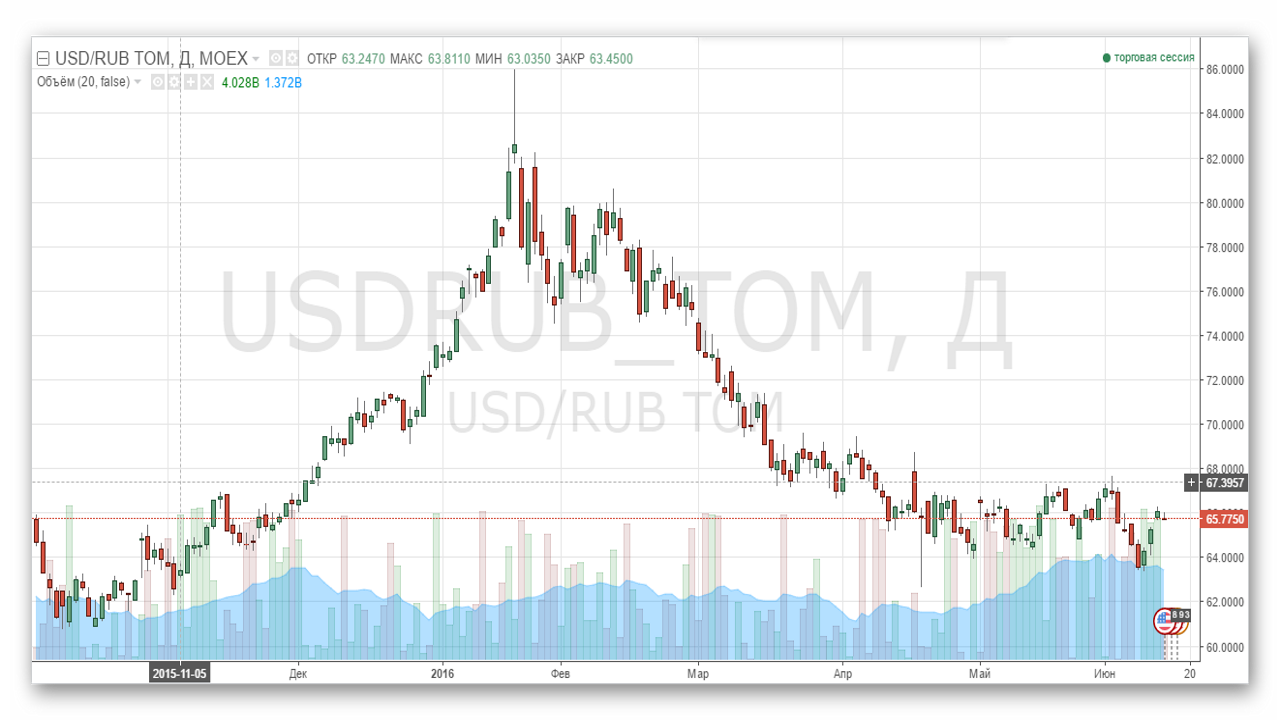
- A chart in the form of Japanese candlesticks is almost analogous to bars, with the only difference being that the candlestick itself has a clearly defined body, and the direction is determined solely by the color of the body.
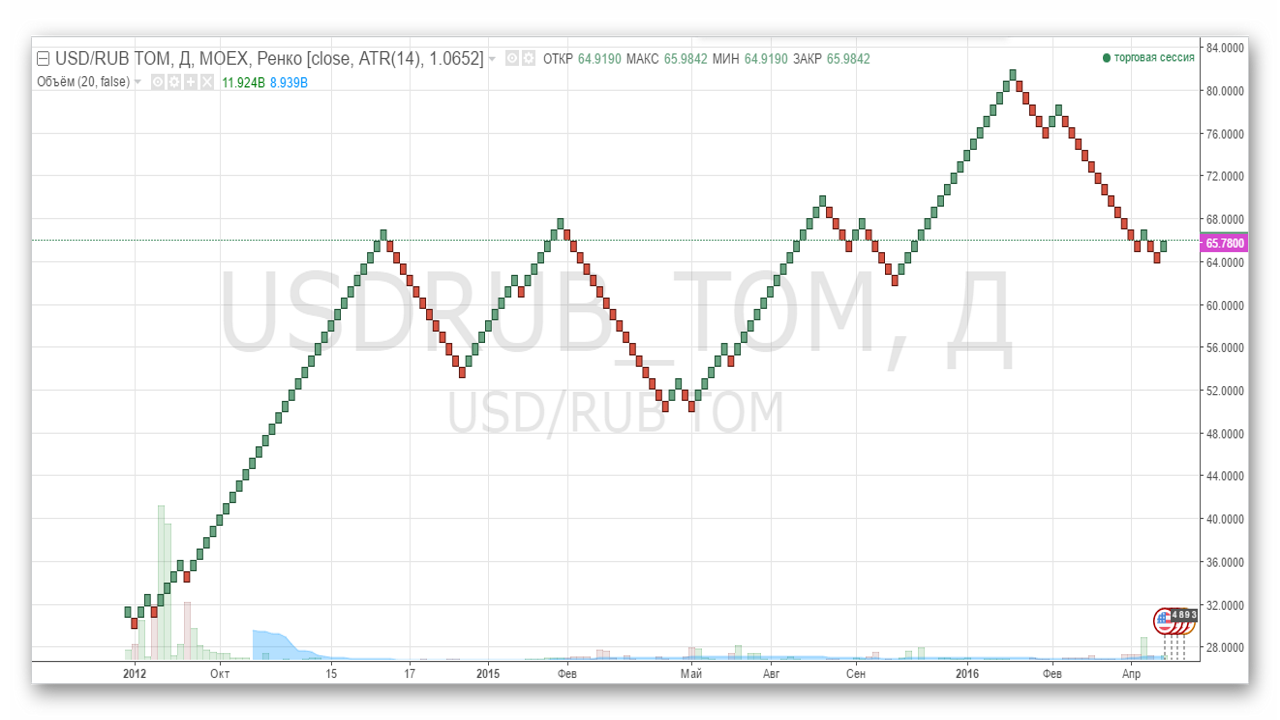
- Renko is also a development of Japanese traders. Renko belongs to the type of charts that take only the price scale into account in calculations. The chart consists of separate blocks ("bricks") of a fixed size. When the price rises relative to the maximum of the previous brick by a pre-set amount, a green brick is drawn on the chart. If the price drops by the size of a brick, a red block is drawn.
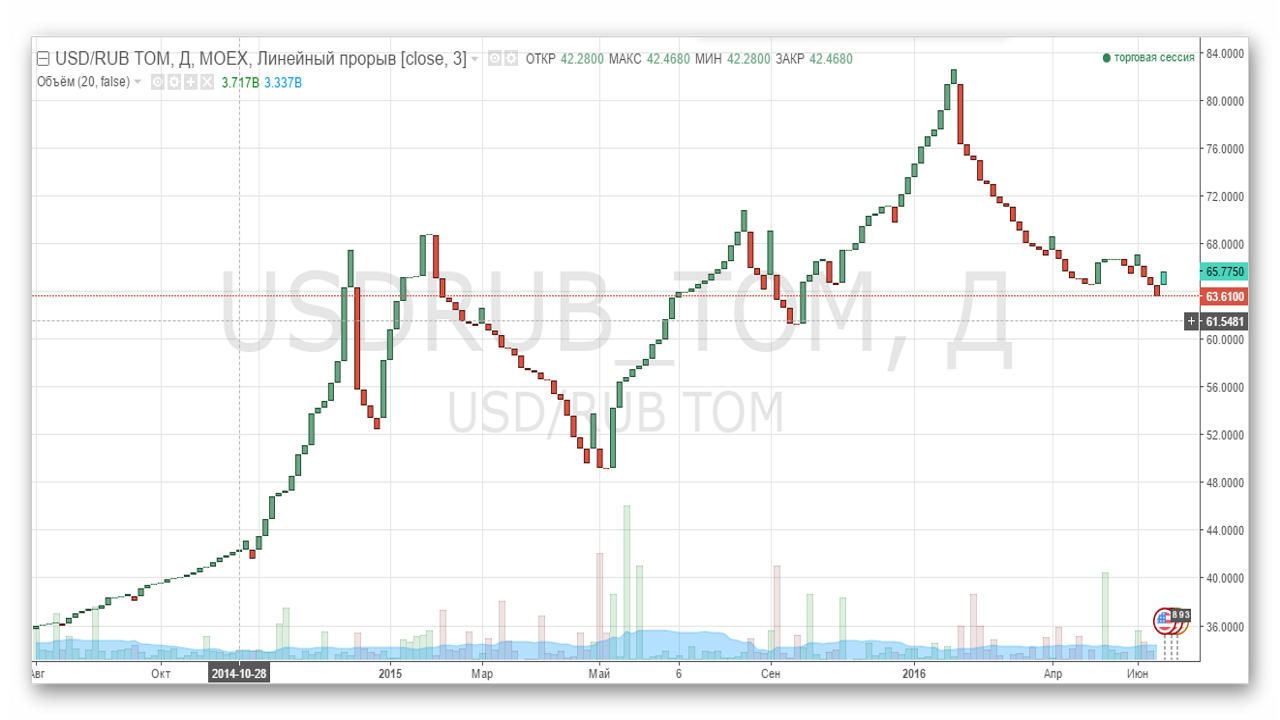
- On a line break chart, a new bar is drawn each time the price moves beyond the previous period. If the price has not changed during that time, the bar is not drawn.
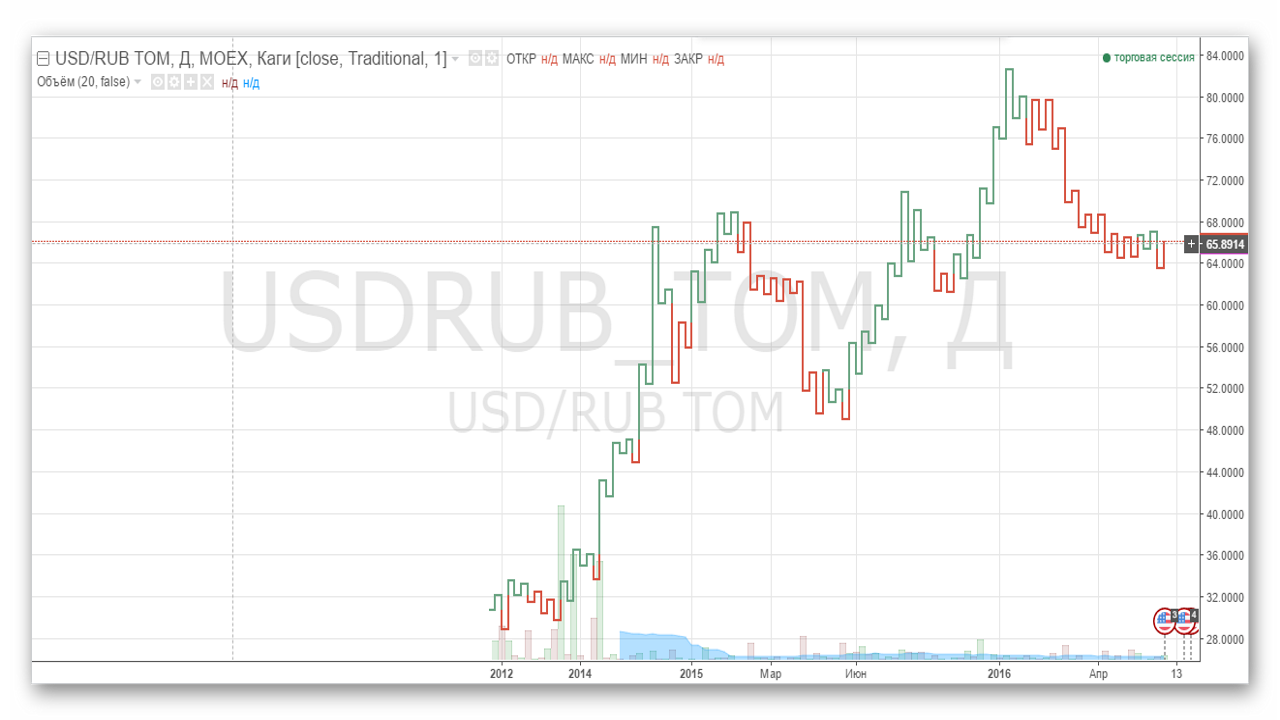
- Kagi is a sequence of vertical lines connected to each other by horizontal segments. The chart continues until the direction of the trend changes, that is, when the price moves a certain distance in the opposite direction. When the price exceeds the previous maximum or minimum, the line changes its color.
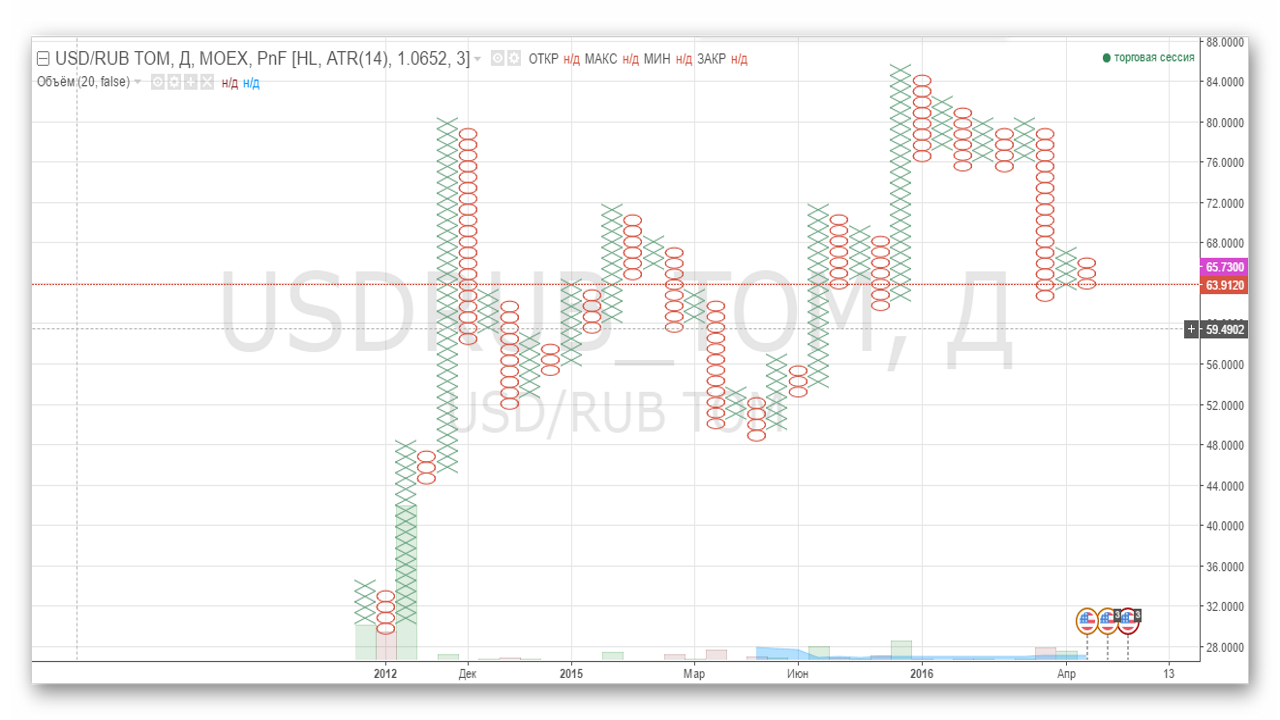
- The point-and-figure chart displays price movement as vertical sequences of X's and O's. If the price moves upward by a pre-set amount, an X is drawn on the chart. In the case of downward movement, an O is drawn on the chart.
Synthetic Instruments
 One of the most attractive strategies on the market is arbitrage. The TradingView platform allows you to build complex spread charts from groups of correlated instruments.
To do this, you need to enter the first symbol in the upper left corner, then a space, a multiplication or division sign, another space, and the second symbol.
For example, if you enter AAPL / XAUUSD, you will get a comparison of Apple stock prices and gold by dividing the stock prices by gold prices. We will find out how much 1 share costs in ounces of gold.
For example, let us try to build a spread chart of Brent oil against the USD/RUB pair. To do this, multiply oil by dollar/ruble:
One of the most attractive strategies on the market is arbitrage. The TradingView platform allows you to build complex spread charts from groups of correlated instruments.
To do this, you need to enter the first symbol in the upper left corner, then a space, a multiplication or division sign, another space, and the second symbol.
For example, if you enter AAPL / XAUUSD, you will get a comparison of Apple stock prices and gold by dividing the stock prices by gold prices. We will find out how much 1 share costs in ounces of gold.
For example, let us try to build a spread chart of Brent oil against the USD/RUB pair. To do this, multiply oil by dollar/ruble:
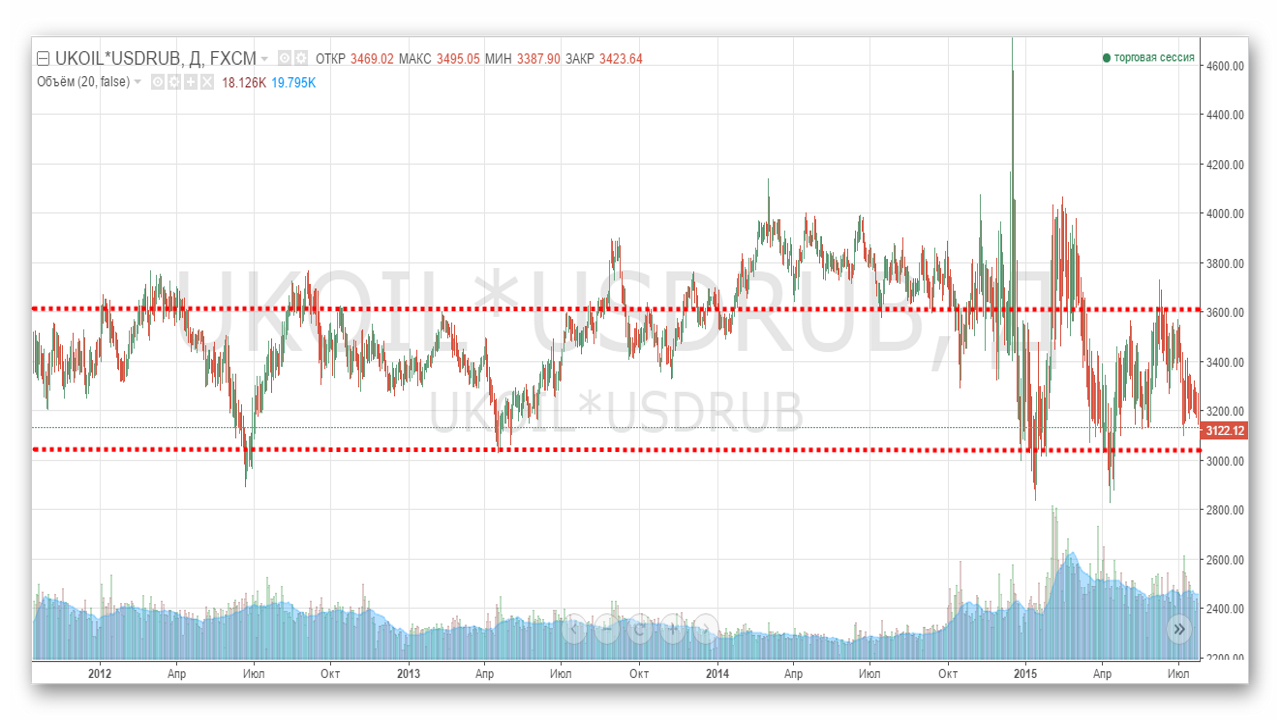 As we can see, the instruments have a strong dependence. As soon as the ruble begins to get cheaper, oil rushes to the rescue that very hour (or vice versa). The main idea of the strategy is to trade upward from the lower edge of the channel, and downward from the upper one.
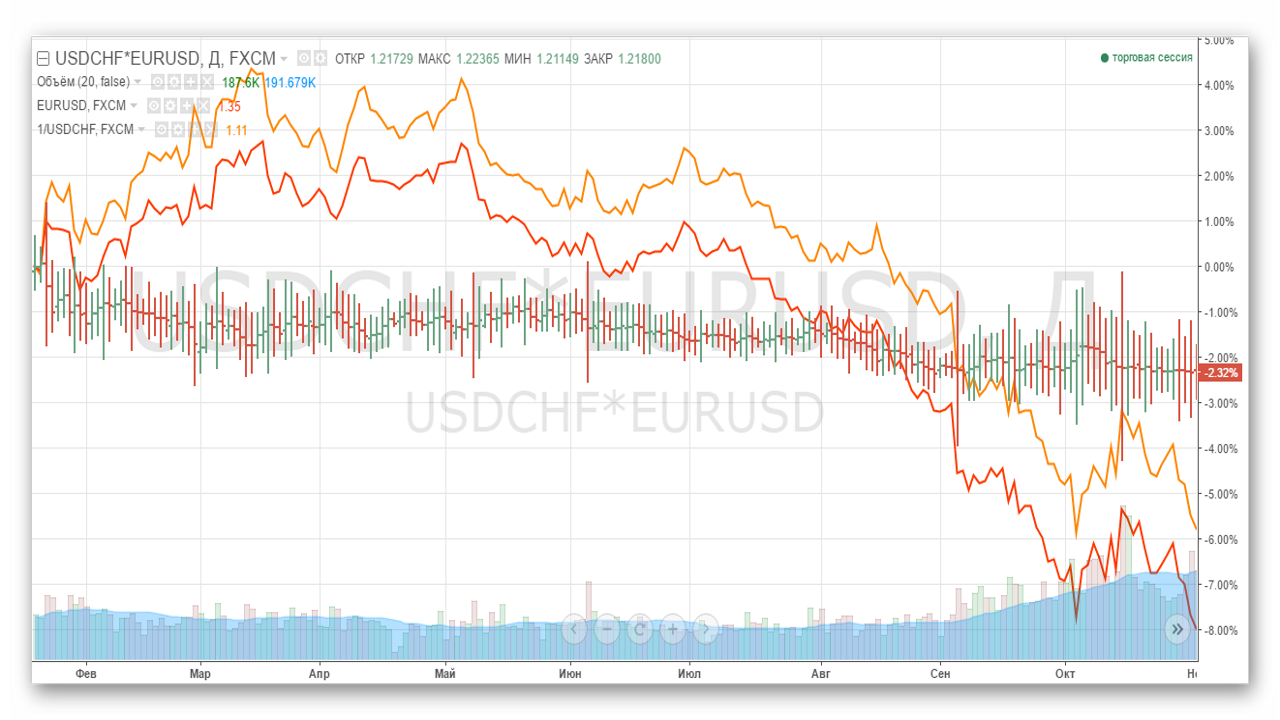
Another example is the USDCHF pair and EURUSD, whose dependence is also quite strong, although not constant. The result of their interaction can also be observed through the cross rate. When the spread diverges, the EURCHF pair shows a trend. Accordingly, when the pair is in the overbought zone, we sell the spread, and when it becomes significantly cheaper, we buy. You can buy the spread with a contract to buy EURCHF, and sell it with a contract to sell EURCHF.
As we can see, the instruments have a strong dependence. As soon as the ruble begins to get cheaper, oil rushes to the rescue that very hour (or vice versa). The main idea of the strategy is to trade upward from the lower edge of the channel, and downward from the upper one.
Another example is the USDCHF pair and EURUSD, whose dependence is also quite strong, although not constant. The result of their interaction can also be observed through the cross rate. When the spread diverges, the EURCHF pair shows a trend. Accordingly, when the pair is in the overbought zone, we sell the spread, and when it becomes significantly cheaper, we buy. You can buy the spread with a contract to buy EURCHF, and sell it with a contract to sell EURCHF.
Graphical Analysis
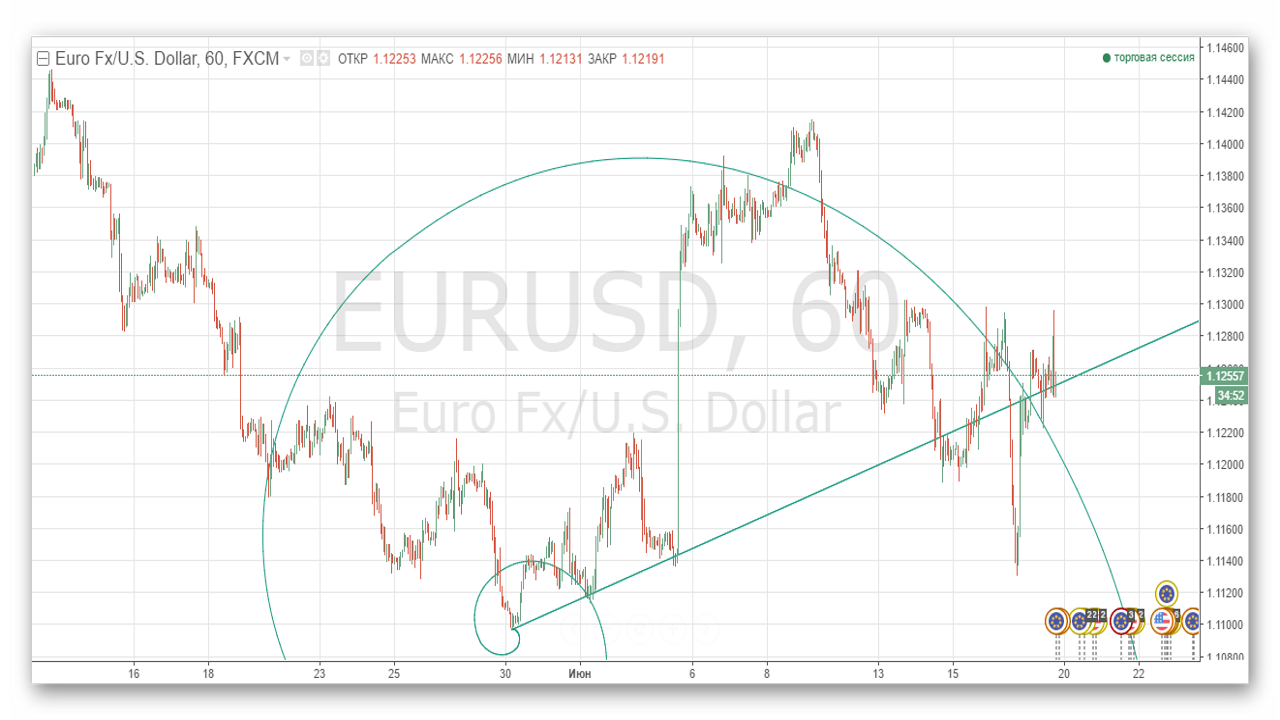
 An important part of the platform is the tools of graphical analysis. The list of different templates is breathtaking for a seasoned technician. In addition to the long list of the most common ones, there are many exotic tools, such as the Fibonacci spiral and sinusoidal cycles. The former, by the way, is an approximation of a logarithmic spiral, the so-called "Golden Spiral."
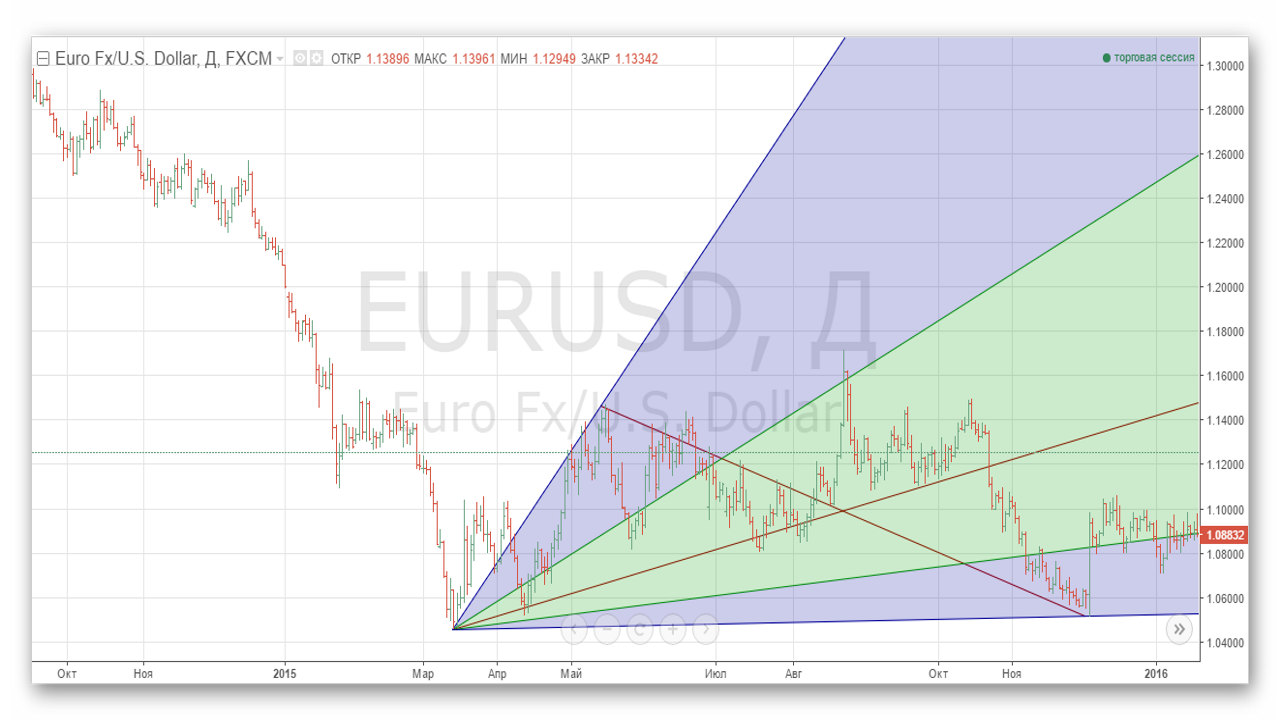
 Fans of Gann have not been neglected either; the following tools are available: fan, Gann box, and Gann square.
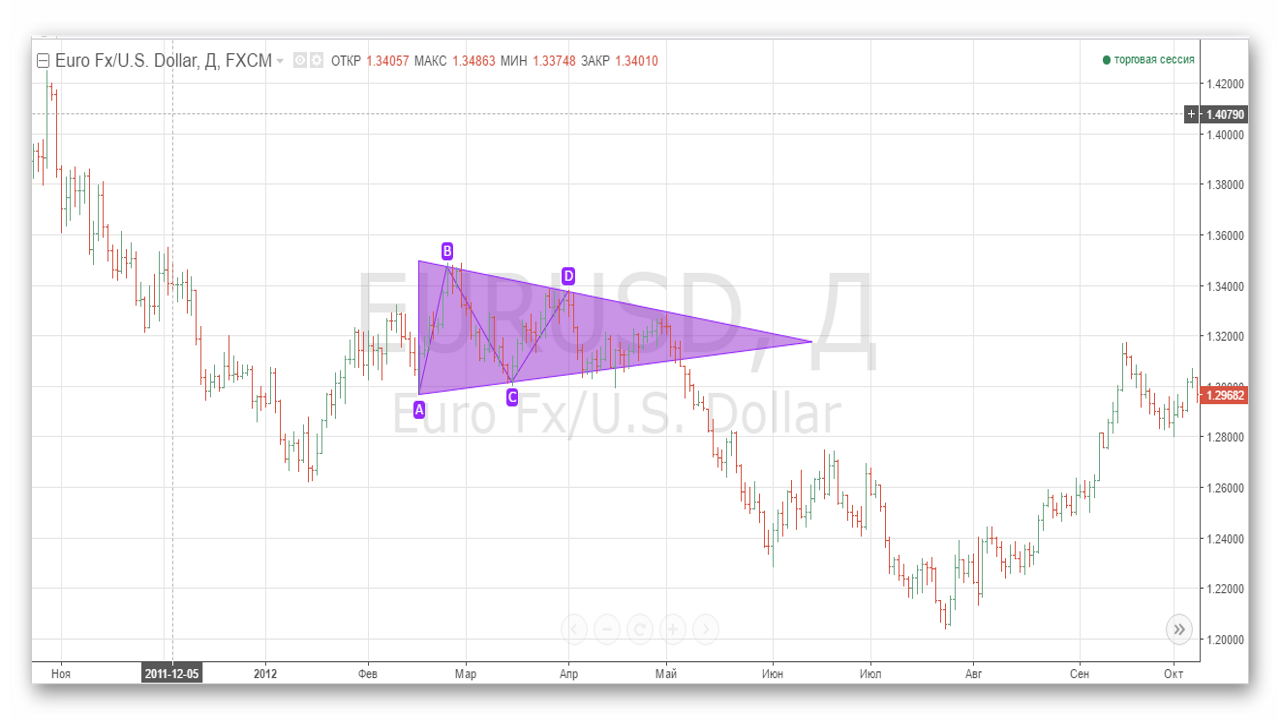
 Traditional patterns are very easy to use. Each of the key points is labeled, and even for people suffering from one common ailment it will be extremely difficult to confuse right and left.
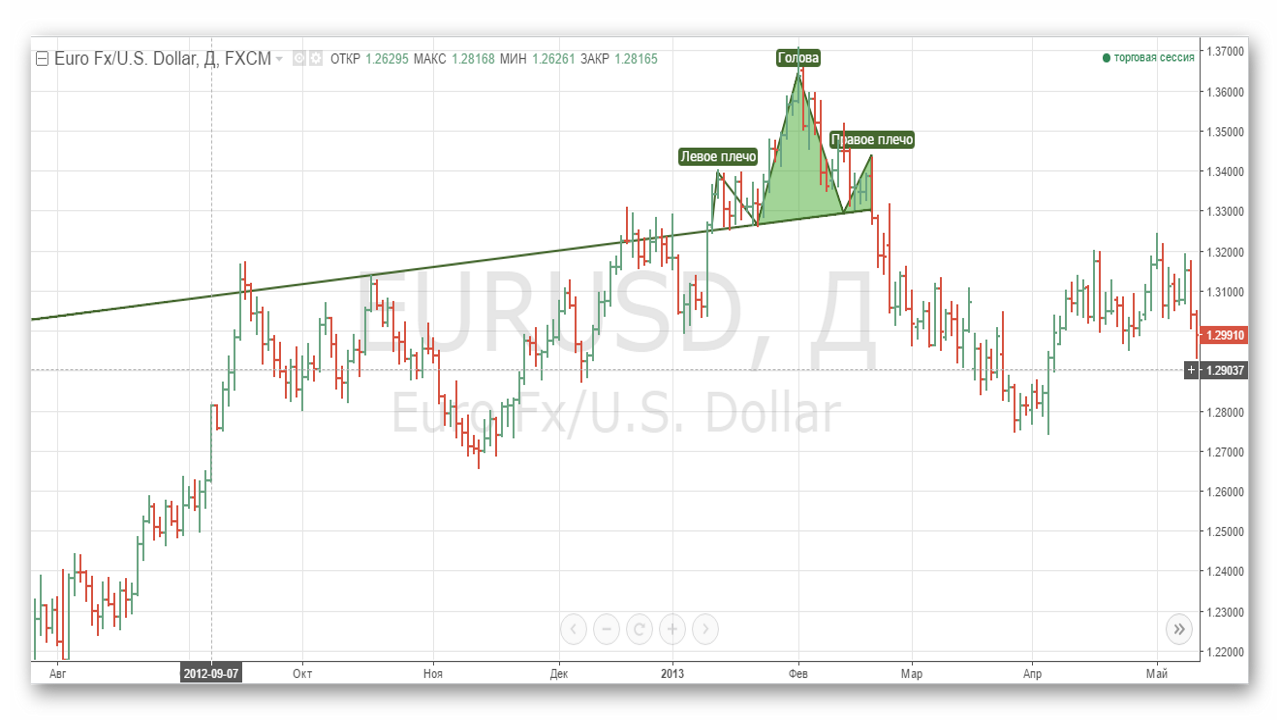 In fact, the whole emphasis is on ease of use. The number of clicks required to place a pattern on the chart never exceeds the number of points in the figure itself.
Conclusion
 Compared with other chart providers, TradingView has some obviously strong sides. The TradingView service is an excellent choice for Elliott wave traders and traders who are fond of graphical analysis. There are both a truly large number of templates and a genuinely simple way to place them on the chart. The chart itself is as flexible as possible and scales easily in both the horizontal and vertical dimensions. It is precisely the presence of templates, even for rare figures, and the large selection of chart types that allow the platform to stand out from the competition.
There are also drawbacks: the service is conditionally free, but some functions are available only with a paid subscription. The free version practically does not limit you in tools, but it will show ads. Starting from the PRO version, you get the ability to open up to 8 charts in one window. Spread charts, as well as Renko, Kagi, line break, and point-and-figure charts, are available only in the PRO+ and PREMIUM versions. There is a 30-day trial period.
Compared with other chart providers, TradingView has some obviously strong sides. The TradingView service is an excellent choice for Elliott wave traders and traders who are fond of graphical analysis. There are both a truly large number of templates and a genuinely simple way to place them on the chart. The chart itself is as flexible as possible and scales easily in both the horizontal and vertical dimensions. It is precisely the presence of templates, even for rare figures, and the large selection of chart types that allow the platform to stand out from the competition.
There are also drawbacks: the service is conditionally free, but some functions are available only with a paid subscription. The free version practically does not limit you in tools, but it will show ads. Starting from the PRO version, you get the ability to open up to 8 charts in one window. Spread charts, as well as Renko, Kagi, line break, and point-and-figure charts, are available only in the PRO+ and PREMIUM versions. There is a 30-day trial period.
Best regards, Alexey Vergunov Tlap.io