
Trading Chaos: The Profitunity Strategy

Hello, fellow forex traders! Today we will talk about the classic Profitunity strategy from Bill Williams's book "Trading Chaos." This strategy has mixed reviews: some have traded it for 8 years, while others blow their accounts with it (although, as we know, trolls blow accounts on everything). Why did this system become so famous? Does it still remain relevant today? What are its weak and strong sides? About all this, as well as a brief summary of the book, in our review today.
Characteristics of the Profitunity Strategy
Platform: Any
Currency pairs: Any
Timeframe: Any (D1 recommended)
Trading time: Around the clock
Recommended Brokers: Alpari, Roboforex
Bill Williams

Bill Williams, the author of this strategy, was born in 1928 and started trading at 59. At the time he was working as an instructor at a business school in Florida, and he got trade ideas from a professor in the accounting department, essentially copying his actions completely in his own account. After trading like this for nearly 21 years, the former instructor decided to take up professional trading. But unfortunately, independent trading did not bring a positive result. Only after losing a pile of money trading other people's newsletters (signals) did Bill begin to study the market on his own, eventually arriving at the Profitunity strategy, which we will examine below.
The Market Is the Sum of Opinions

The market, according to Bill Williams, is actually very simple. In essence, the market is the sum of the opinions of all investors. Traders trade on different timeframes and use different goals: for some it is important to make a profit, while others simply hedge risks. In the case of forex, this may be a simple need for currency. And all these players see a different picture of the market, which is what forms individual movements, trends, and so on.
If you remove the timeframe display from the chart, you are unlikely to guess which time period this chart belongs to. Our perception of reality is very relative and depends on which point of view we are using at the moment. One of the author's conclusions states: all market trends change direction accompanied by a higher fractal number than the bars leading to the trend change. In other words, this suggests that all timeframes in the market are connected: first the trend changes on the lower timeframe, and then on the higher one.
Principles of Market Energy

1. Market energy always moves along the path of least resistance. A comparison can be made with a river that makes its way through natural obstacles.
2. Usually, this path is determined by a structure invisible to the eye. Just as the behavior of a river depends on the underlying structure of the riverbed. The formation of the path is influenced by your own vision of the market.
3. The underlying structure can be changed. Sometimes it seems as if most traders are trying to scoop all the water out of the river with buckets just to change the direction of its flow. Many simply forget that it is easy to change the direction of the current by moving a stone at the source of the river. That is, our views on the market can always be reconsidered.
Since the market is the product of many minds, understanding what leads to price change gives a significant advantage in trading. Therefore, the Holy Grail consists in wanting what the market wants.
Types of People
* Traders feel best in the role of Columbus (conquerors). They tend toward independent thinking and actions against the generally accepted opinion. Usually they are bold leaders who attract other investors.
* Investors feel comfortable following in the footsteps of traders. The success of investors usually depends on the success of the leader trader.
* Accumulators are people who are afraid to take on extra risk and obligations, so they put money into deposits and pension plans (a common scheme in the USA). Such people will not change the current state of affairs, even despite an unsatisfactory result.
The Stairway to Profit

- Level: novice trader. The goal is to take money while gaining new experience at the same time. During this stage, the basics are learned: how to place a trade, how to calculate margin correctly, and so on.
- Level: advanced beginner. The goal is to make money gradually using a small account.
- Level: knowledgeable trader. The goal is to maximize the overall return on investment. The trader already knows how to feel the "rhythm" of the market and determine which strategy is the most suitable for the current state.
- Level: seasoned trader. The goal is trading in harmony with one's own belief systems. Stability comes to the forefront, and winning becomes the primary task.
- Level: expert trader. The goal of the expert trader is to trade using a state of mind. At this stage, complete understanding of oneself and the market occurs. The concept of randomness no longer exists, and any chaos has a certain order.
Strategy Rules

Any trading platform will suit this trading system, since Bill Williams's indicators have long since become a standard and are available in any terminal. The strategy can be applied on any timeframe, but the author of the strategy recommends the daily chart specifically.
The Profitunity system consists of the indicators: Alligator, Awesome Oscillator (AO), and Fractals. The "Bullish/Bearish Reversal Bar" pattern is also used. There are 3 entry signals, each of which Bill Williams calls a "wise man."
You can enter using any of the 3 types of signals; however, the most weighty are the signals from the bullish/bearish reversal bar and from the AO oscillator. Signals for entry by fractals are more expedient to use only for adding to a position.
Alligator

In essence, the alligator is 3 MAs (moving averages).
- Blue line - a 13-bar MA, with an 8-bar shift. In essence, it shows where the price would be in the absence of chaos. The size of the range between the jaws and the real price speaks to the interpretation of this new incoming data by the players.
- Red line - an 8-bar MA, with a 5-bar shift. This line also shows equilibrium, but for a smaller timeframe. This timeframe is approximately equal to one fifth of the chart's time period. That is, if you trade on the daily chart, the line will roughly show the situation on the four-hour chart.
- Green line - a 5-bar MA, with a 3-bar shift into the future. Again, the green line corresponds to approximately one fifth of the time structure of the teeth (the red line). That is, it is closest to the H1 or M30 period.
Together, all three lines - the jaws, teeth, and lips - form the alligator's mouth.
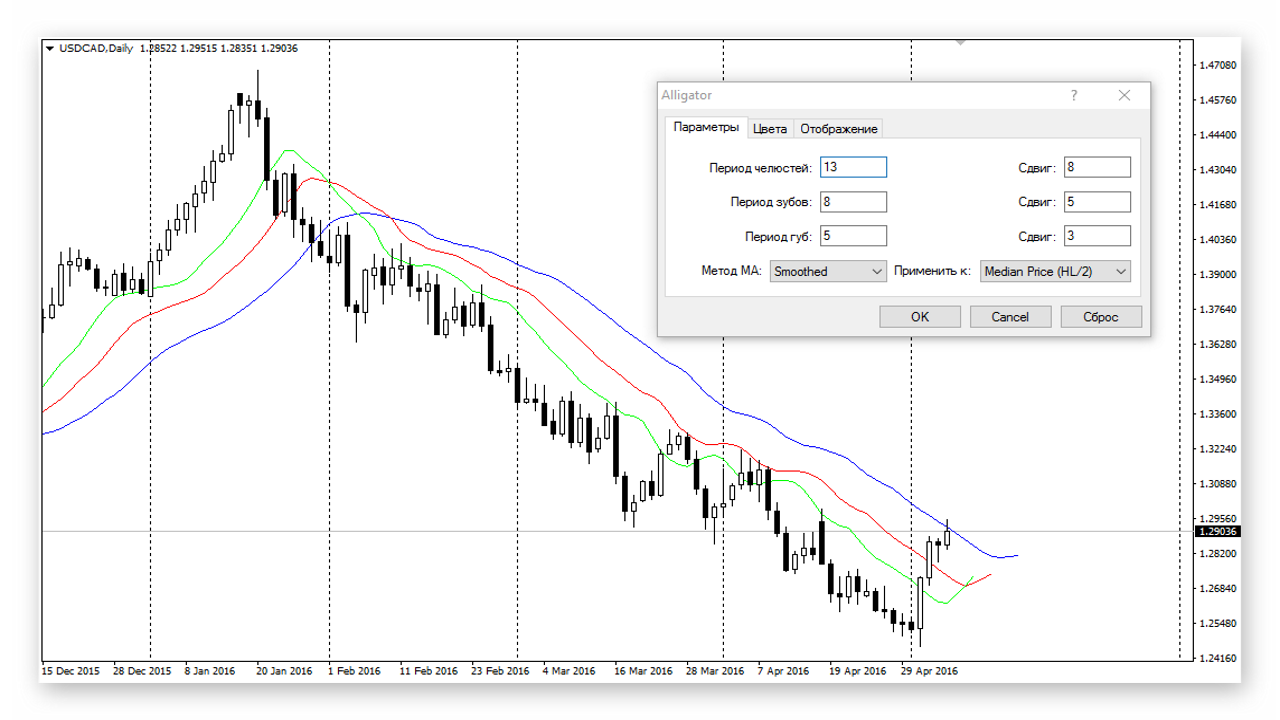
The alligator is an advanced trend indicator. Obviously, more information is needed to shift the blue line than to shift the red or green one. The system uses the indicator's default settings.
First Wise Man - Bullish/Bearish Reversal Bar

The next part of the system is the bullish or bearish reversal bar. This is the first signal to enter a trade. Today, in order to achieve success in the market, it is not enough to simply "buy and hold"; quoting the book, one must also take into account the market's short-term desires. Therefore, we will look for the earliest indication of a trend reversal.
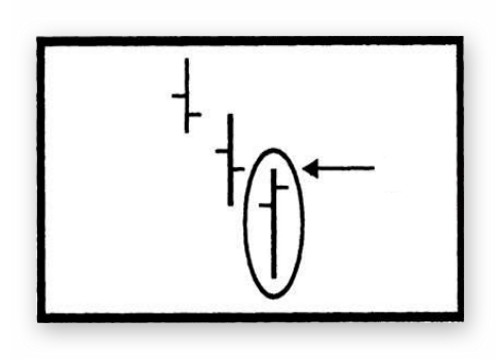
A bullish reversal bar shows a lower low relative to the previous bar and closes above its midpoint. This indicates that at the beginning of the bar's formation the forces were on the bears' side, but then power passed to the bulls.
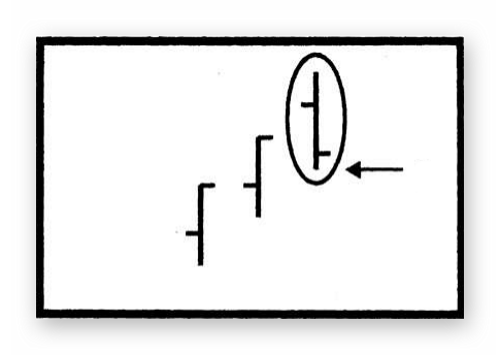
In contrast to the bullish bar, there is also a bearish reversal bar. This bar shows a new high and closes in its lower half. That is, at first the bulls ruled, but in the end the bears won the victory.
Both the bullish and bearish reversal bar must be located at a substantial distance from the Alligator lines. Also, the angle formed by the price must be greater than the angle formed by the alligator's mouth. We enter a sell slightly below the low of the bearish reversal bar, and place the stop slightly above its high.
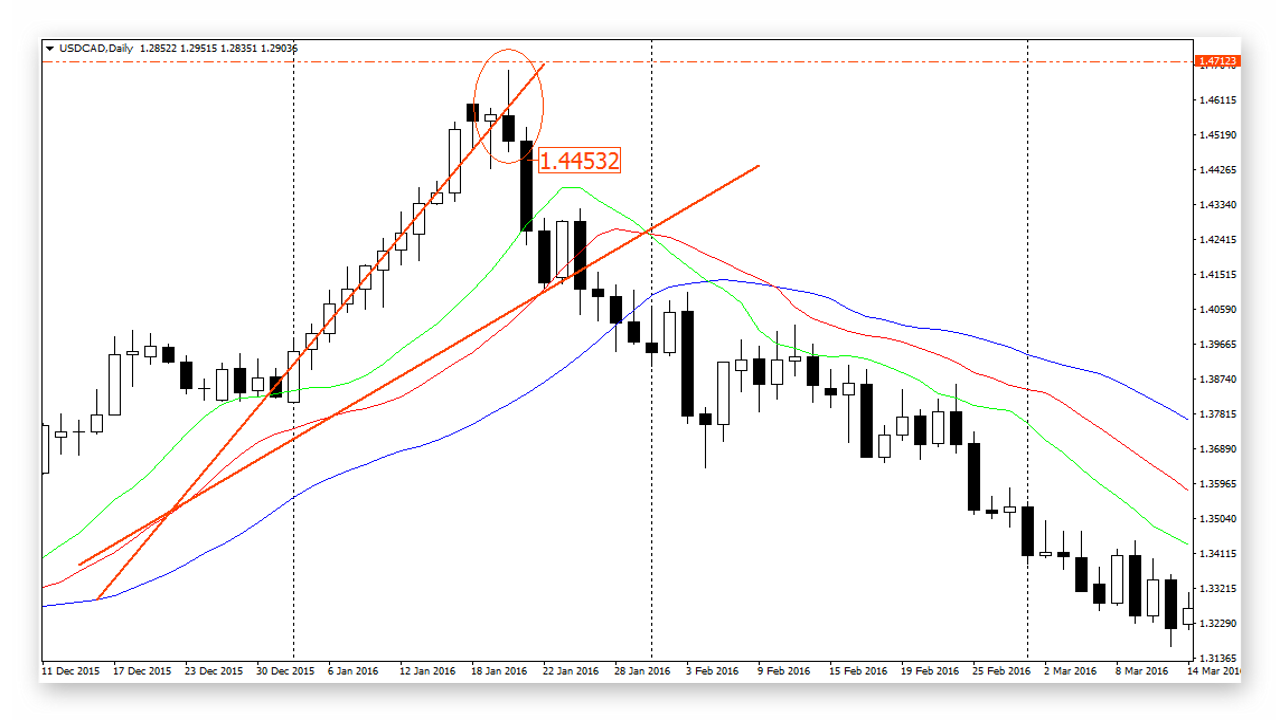
The same thing, only the opposite way around, is true for a bullish market. We enter a buy slightly above the high of the bearish reversal, and place the stop at some distance below the low.
Second Wise Man - Awesome Oscillator

The next stage of the system is the AO oscillator. The indicator measures momentum over the last 5 bars and compares this value with the last 34 bars. That is, the indicator shows the current strength of momentum.
The signal for adding to an open position is three consecutive bars of the same color on the AO histogram. At the close of the third bar, we place a pending order slightly below the low of the candle, and set the stop-loss, by analogy with the first signal in the system, near the high of that same candle.
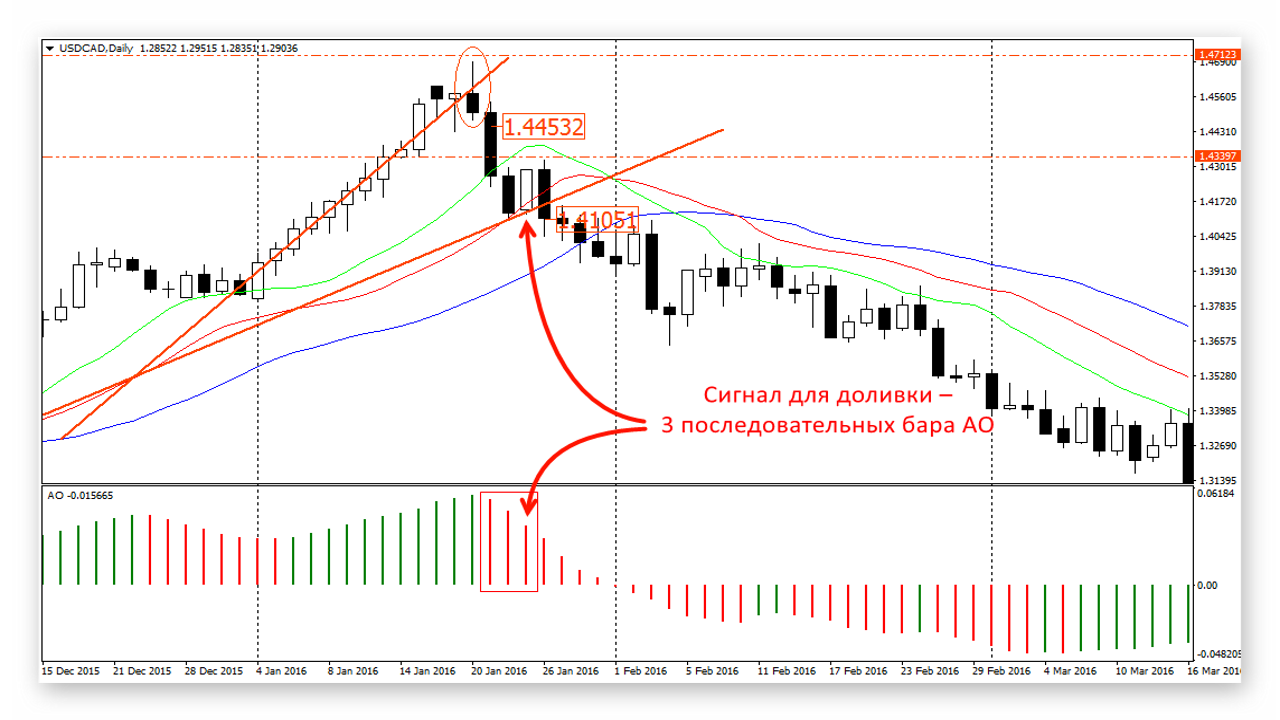
In the book "Trading Chaos," the author advises using this signal as an additional one, that is, for scaling in. Nevertheless, if there was no reversal bar, we can quite well enter a trade based on the AO indicator, but with a smaller lot size.
The Third Sage - Fractals

For the third signal, the classic strategy uses fractals. Ideally, an upward fractal is at least five consecutive candles where the highest high is flanked on both sides by two lower highs. The same is true for a downward fractal, where the lowest low is accompanied by four bars with higher lows. In the case of upward fractals, we are interested only in the highs of the bars; in the case of downward fractals, only in the lows. A fractal does not necessarily have to consist of 5 candles; the shapes can be quite different:
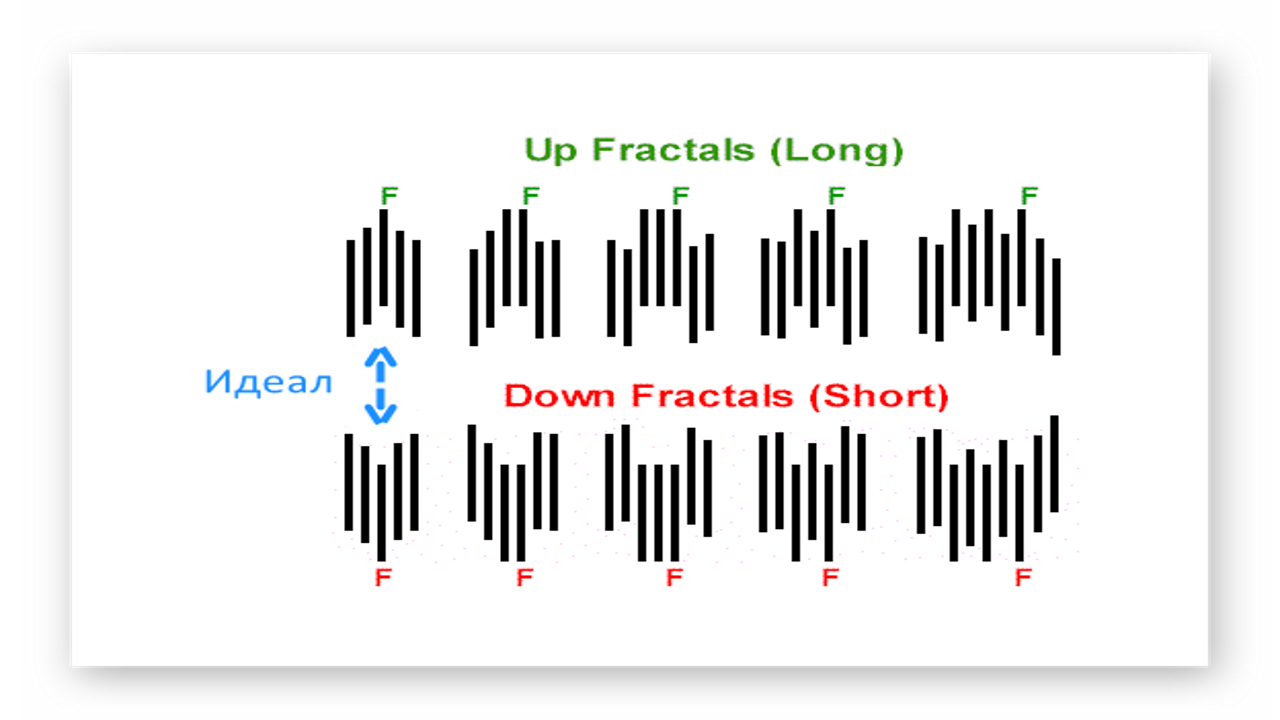
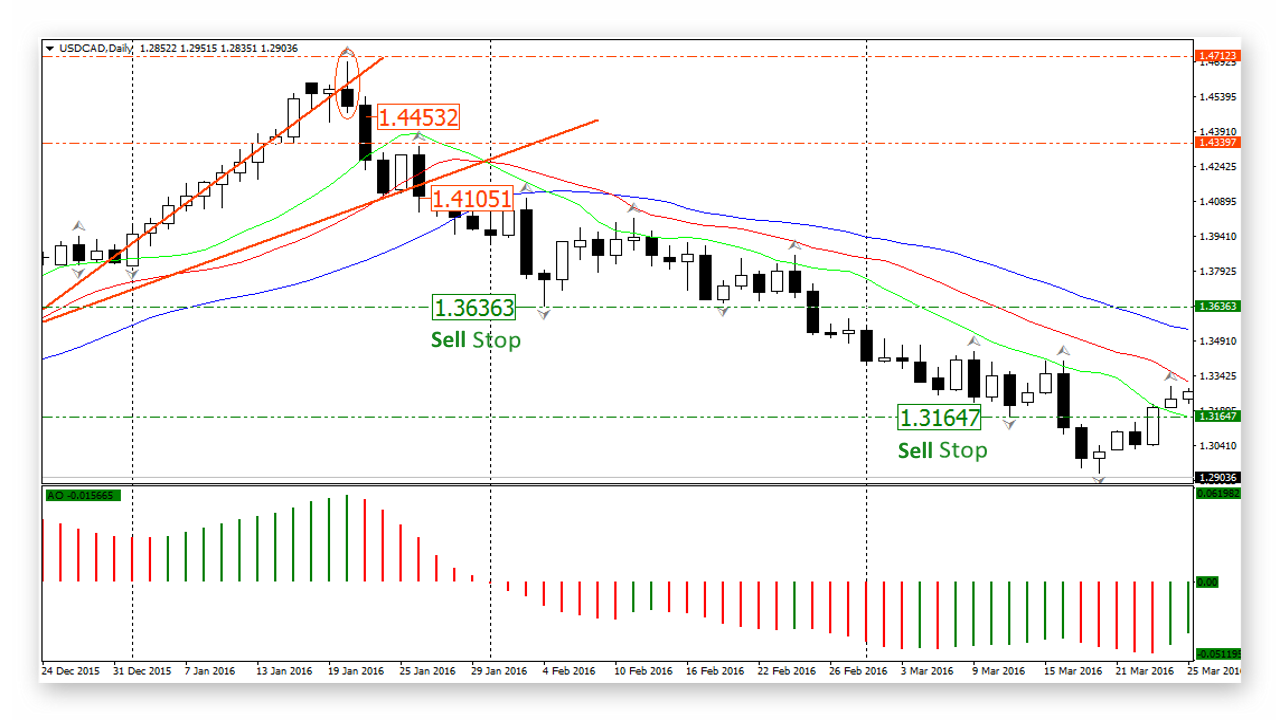
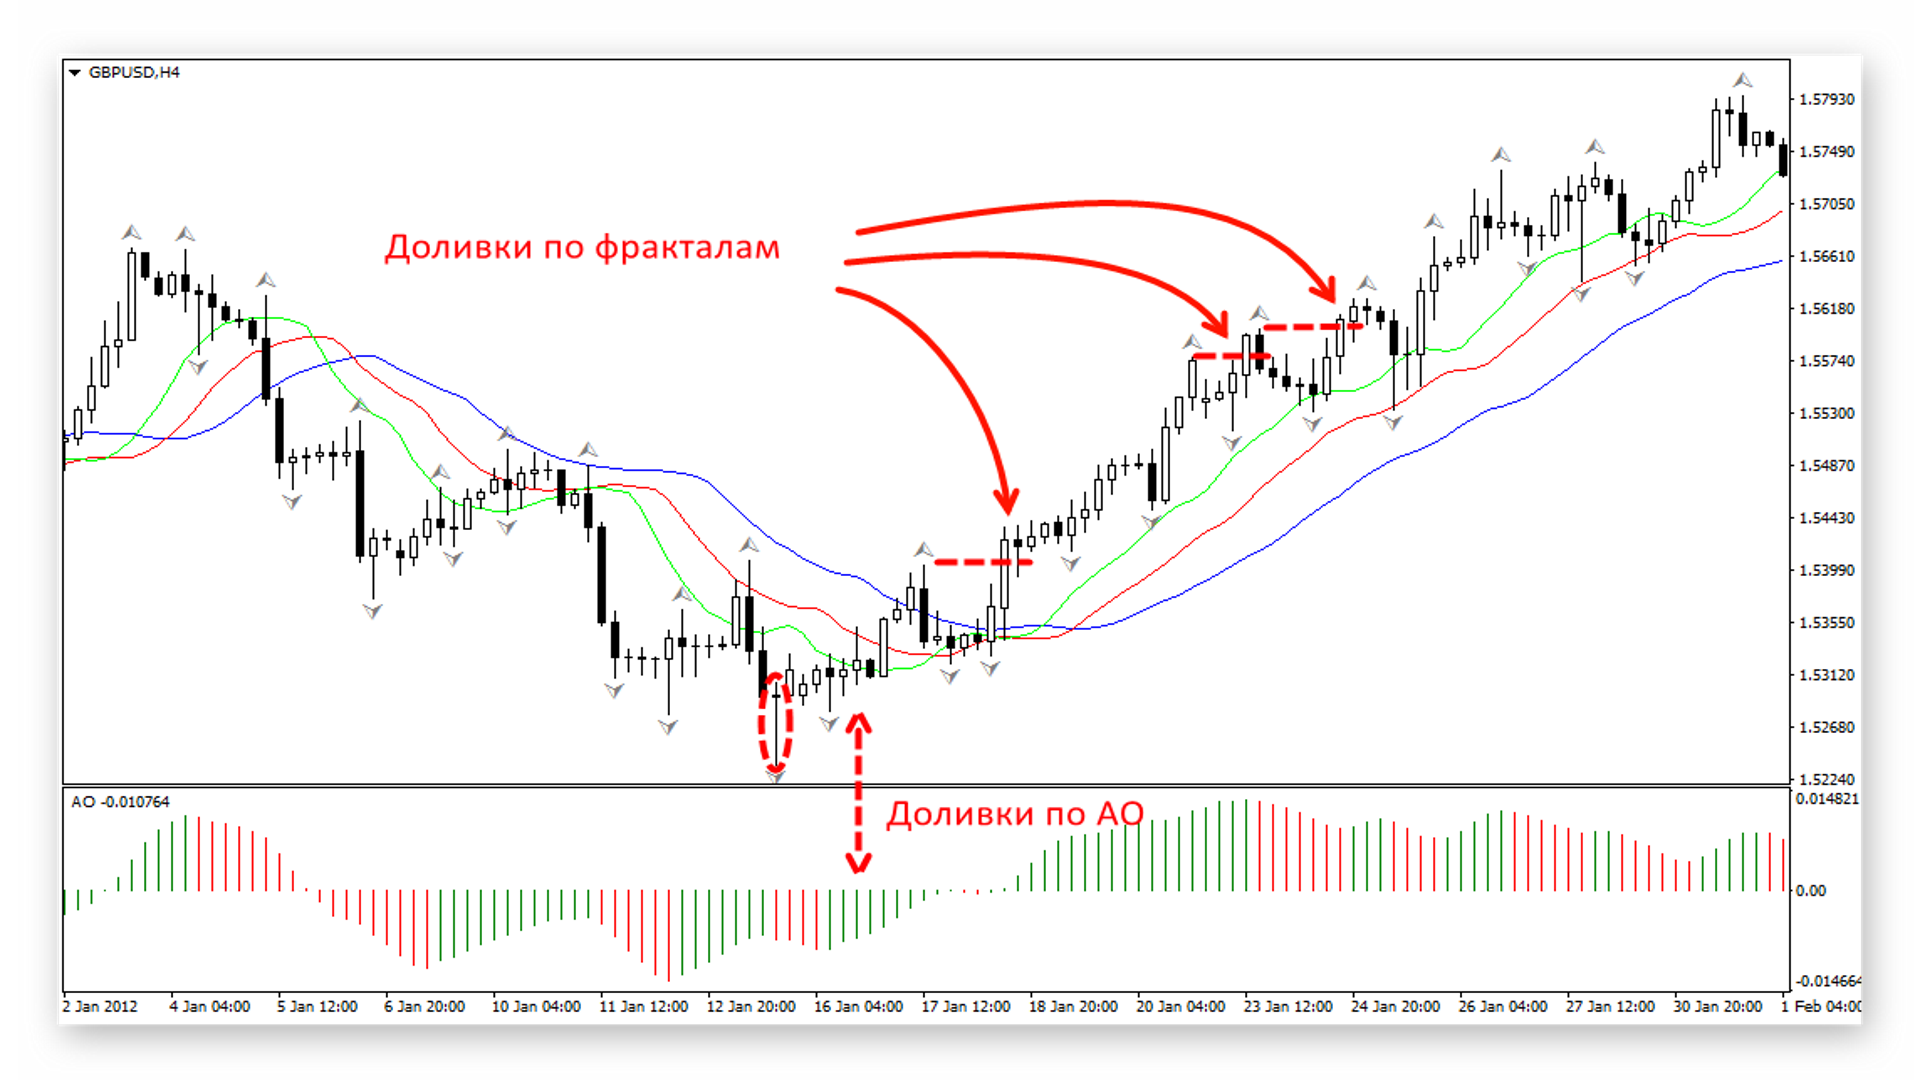
We place the next pending order on the opposite side of the alligator's "mouth." When a fractal appears, we place a pending buy order. It is important that at the moment of execution, the order is beyond the red line of the alligator. If the fractal triggers, we also enter on subsequent fractals until we have a total of 5 orders. We place the stop-loss at the low of the fractal candle bar, or at the high of the last 3-5 candles. A fractal can also be the first signal in the system if there were no signals from the reversal bar or the AO indicator. If this is the first signal, we enter with the minimum lot.
When the Sages Gather Together
Now that we understand what the signals of all three sages represent, it is time to gather them all together:
- The signal of the first sage is formed at a sufficiently large distance from the alligator. We wait for the appearance of a bullish or bearish reversal bar. The purpose of the first signal is to enter the market at the most favorable price with a minimal level of losses. Particular attention should be paid here to the presence of a steeper slope of price relative to the alligator lines (good angulation), especially with respect to the blue line, the jaws;
- After entering the market, we look for a suitable place to add on. If the market continues moving in our direction, we begin counting the bars on the AO histogram. After three consecutive bars of the same color appear (green for buy, red for sell), we add to the main position in accordance with the MM system;
- After the second signal triggers, we begin looking for a point for the third entry, that is, we wait for the condition for a fractal to form: two bars with lower highs or higher lows. The purpose of the third sage is simply to follow the trend while it moves in our direction. When a fractal appears, we place a stop order immediately beyond the extremum and a stop-loss at the lowest low or highest high of the last 3 or 5 bars;
- We continue to monitor the arrival of new signals until the position size reaches its maximum in accordance with MM (according to the book, 5 orders in total);
- If the position was not closed by the stop, we exit when an opposite signal appears (or reverse the position).
Exiting the Position

You need to exit the position when an opposite signal appears. That is, we wait for the appearance of a reversal bar or three consecutive bars of the same color on the AO histogram.
Also, we move the stop-loss behind the price, beyond the high/low of the last 3-5 candles.
Money Management and the Reverse Pyramid

To calculate position size, Bill Williams recommends the following approach, resembling a reverse pyramid:
- Order - lot X
- Order - 5X
- Order - 4X
- Order - 3X
- Order - 2X
The position size should preferably be set at no more than 0.5% of the deposit for 1X. To calculate the lot size, you can use the lot calculator.
Examples

Let us consider an example on GBPUSD, H4 period. As expected, when a bullish reversal bar appears, we place a pending buy order slightly above its high. As can be seen on the chart shown, signals numbered 1 and 2 turned out to be false, and the orders were closed by stop-loss.
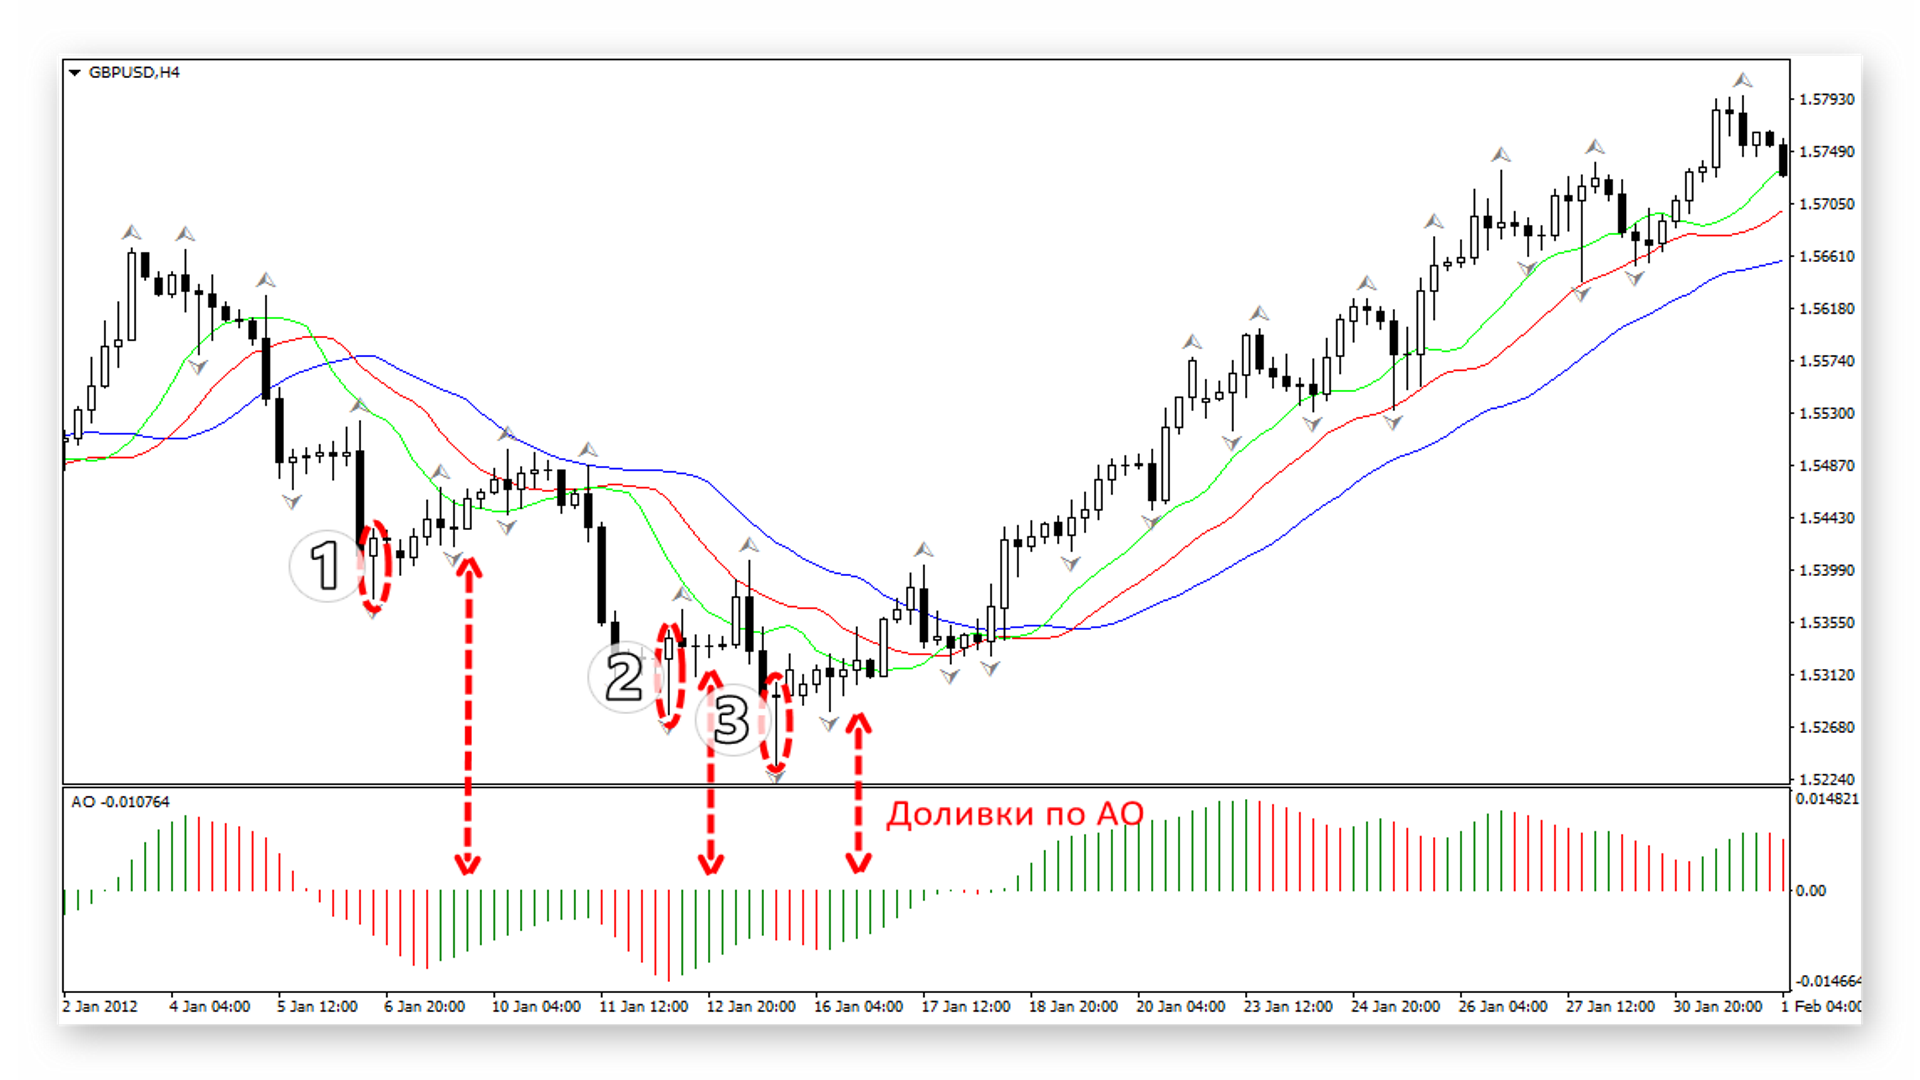
After the position is opened, we wait for three green bars on the AO and place a pending buy order slightly above the high of the current candle. After the trend reverses, we add on when fractals are broken until we have a total of 5 orders.
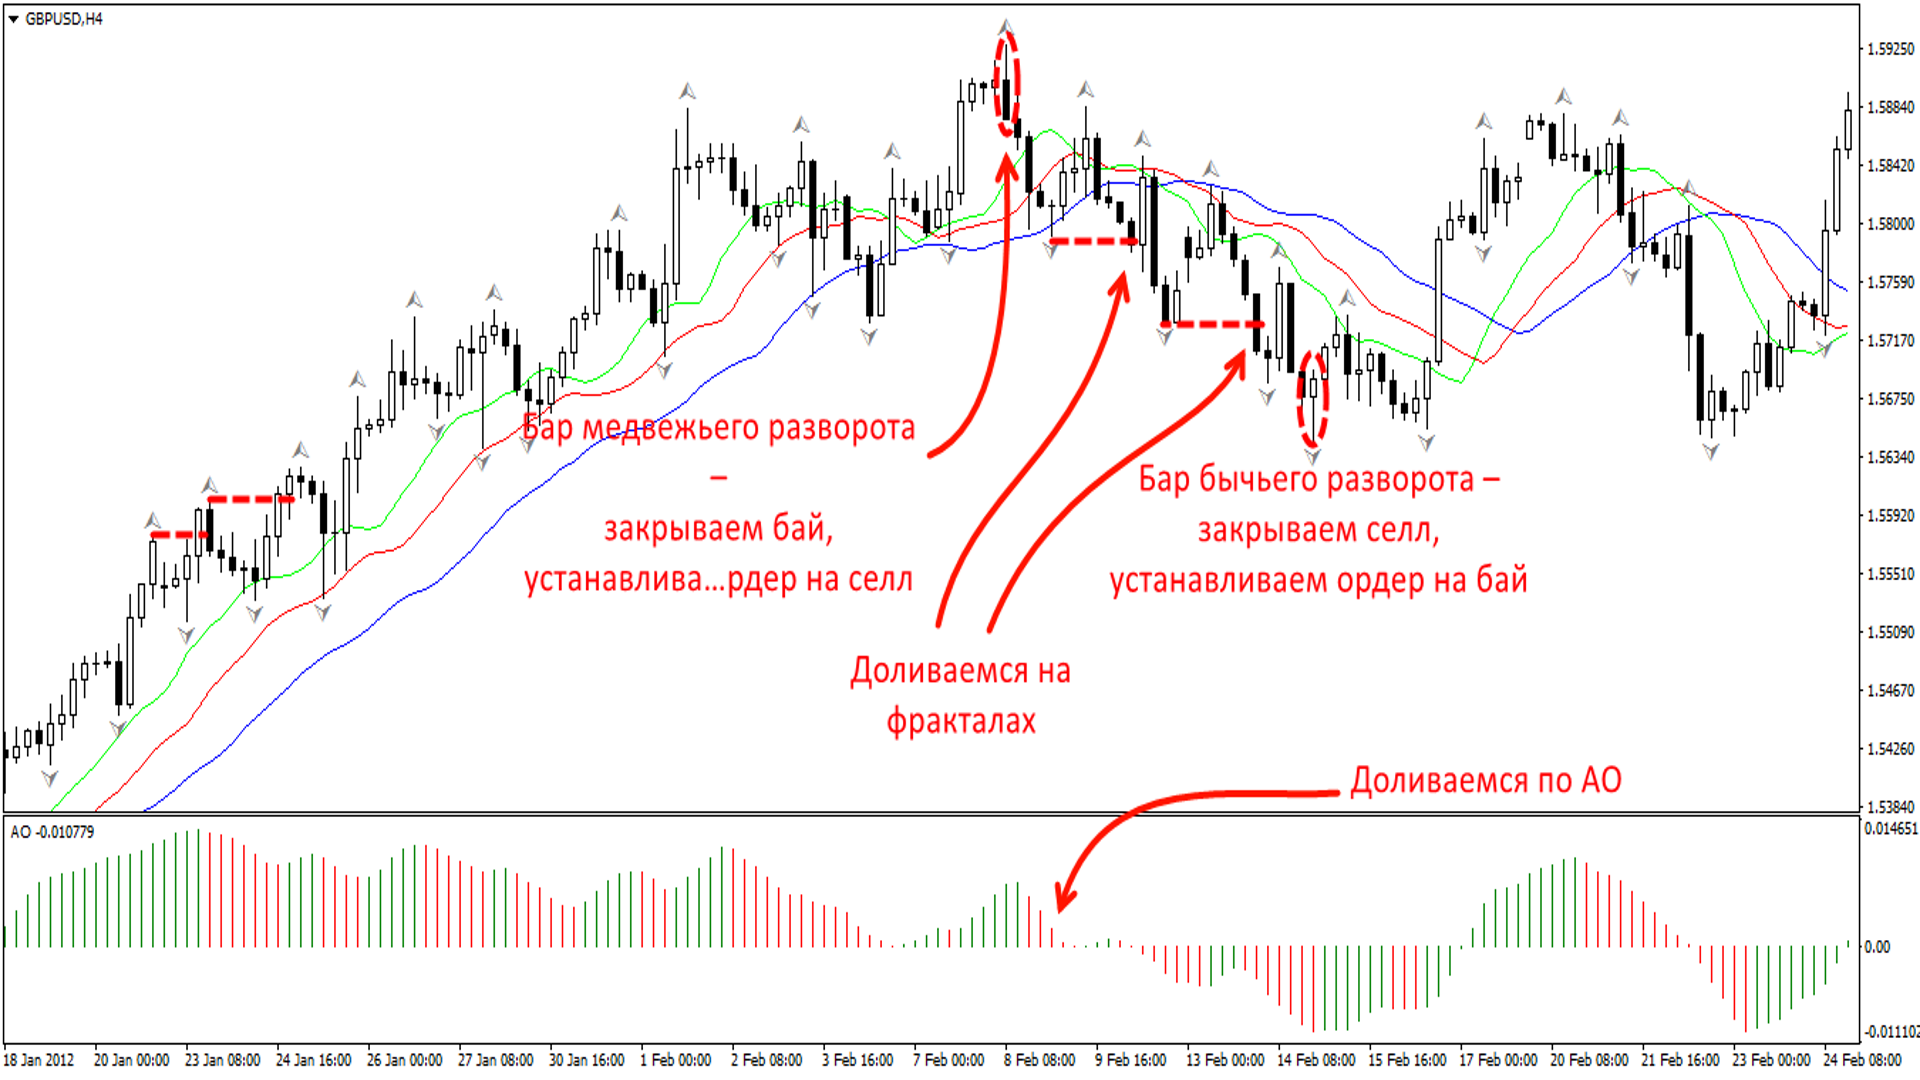
When a bearish reversal bar appears, we close the buy position and immediately open a sell order at the low of the reversal bar. As we can see, despite the fact that it was only possible to enter the position on the third attempt, the profit from the captured move covered the losses of the two previous trades.
Next, using Sell Stop orders, we add to the position when an AO signal appears and when the fractal low is broken. We exit in the same way, upon the appearance of an opposite signal (in this case, a bullish reversal bar).
Conclusion

Although the strategy originally centered on trend-following, entries later became much earlier, literally at the first signs of a reversal. According to the author, these changes are related to the fact that markets today have become much more dynamic and therefore require a more aggressive approach.
At the same time, one of the main advantages of the strategy is that even after catching several stops in a row, the loss is more than compensated by the much larger profit from the trend movement.
The system's only weakness, in my personal opinion, is its entry. But in this case, the use of additional filters may help. Also, when entering, do not forget to take support and resistance levels into account; it is foolish to enter directly toward a level. In essence, markets are an exchange of emotional energy, and energy takes its final form as money. Therefore, psychology still plays the leading role, while system-based and technical/fundamental analysis move to the background.
Strategy Thread on the Forum
Respectfully, Pavel Vlasov TradeLikeaPro.ru
