
Trading Against the Trend
 Hello, ladies and gentlemen, Forex traders. We all know the saying, "The trend is your friend." But sometimes you really want to enter against the move... After all, pullbacks can be very strong and seem like easy profit.
This impression is deceptive: trading against the trend is much harder than trading with the trend; it requires extreme attentiveness and the ability to enter a trade on time, preferably with a short stop loss. In the new lesson on the Price Action method, we will talk about what to pay attention to when entering, what targets and stops to set, and also about a secret tactic for choosing an entry point.
Can you trade against the trend? And if so, how do you do it correctly?
Hello, ladies and gentlemen. In this lesson we will talk about trading against the trend. Trading against the trend is dangerous; very often it leads to losses. But there are situations when you really want to enter a trade, even though it is against the trend.
In general, I will not recommend trading against the prevailing move. But if a situation arises where you really want to enter a trade, then at least do it correctly.
And we will talk further about how to do this correctly.
Why is trading against the trend so dangerous?
The thing is that when we look at the history on a chart that has already happened, that has already been "drawn", and not at prices that exist in real time, we pay attention to the extremes, but we do not pay attention to what preceded them.
And we see that there was a setup at the top, and it would have been possible to enter and take quite a good profit.
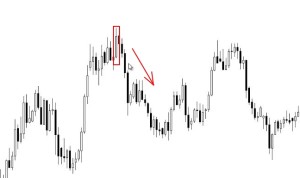
It seems that an entry against the trend would be very, very profitable. But the fact is that we lose sight of the moments when the price had already been moving upward for some time, was drawing some setup, but as a result continued moving in the same direction. And if we had entered against the trend, we would have lost a lot of points. And, accordingly, real money.
Let's look at how this happens.
Before us is the chart of the USDCAD currency pair. What do we see? For quite a long time there was an upward trend. It would seem that the price had already risen strongly. There were long candles, after which a pullback most often occurs. And a pin bar appears. It would seem that it is worth entering a trade and opening sells.
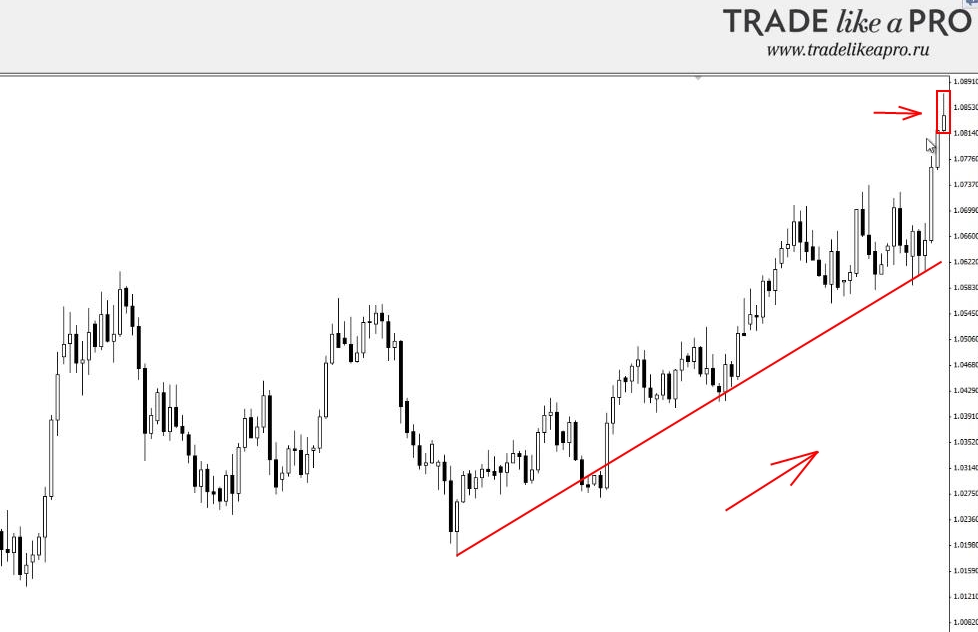
What would have happened if we had entered sells?
So... Another strong up bar is drawn. Let's measure it: 100 points of possible loss. That is what would have happened if you had entered sells here. Let's see what happens next. We get another bar. Then another up bar, quite long. And a pin bar appears. Most traders will decide that now it is definitely time to sell!
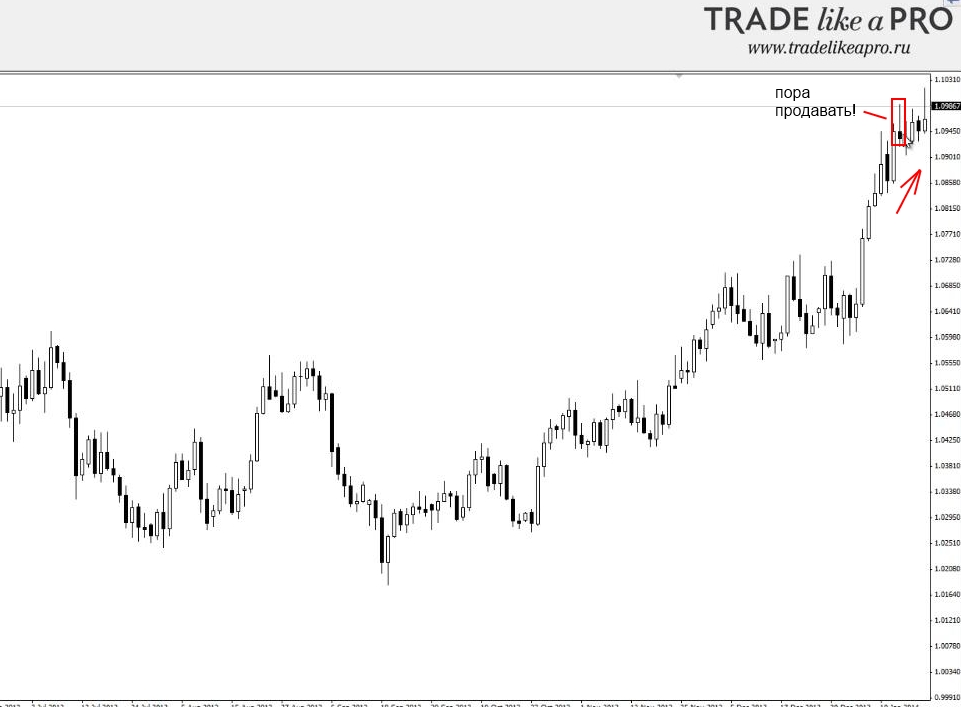
Why do you need to be very careful here?
Many traders lose their deposit precisely in such situations. Because what happens next is not at all the move they were counting on... We got a downward doji. If you had entered using a pending order, that is, placed a pending sell order slightly below the low point of our pin bar, then the sells would have been activated. So, you are in the market. But what awaits you: profit or loss? The price went up a little. But the stop loss, which as we remember, according to the rules of the pin bar should be placed above its tail, in this case the upper one, has not yet been hit. We wait. Another neutral candle appeared. And after it, another pin bar. It hit our stop loss.
And what could have happened if we had entered on the previous pin bar?
What would have happened if we had decided: now that is definitely it, you can enter 100%. Some increase the lot, confident that now there will definitely be a strong downward move. After all, the price cannot rise endlessly, right? And yet another pin bar. The next day, a bullish candle. The price rises another 120 points. Then yet another pin bar is drawn. Well, now that is definitely it, with a 1000% probability the price will go down! Because how many pin bars can it draw, surely now there will definitely be a powerful pullback! That's it, the price is obliged to collapse. Suppose that right now you enter sells. The price went down just a little. If we had entered with a pending order, it would have been activated now. Next comes a neutral bar. And...
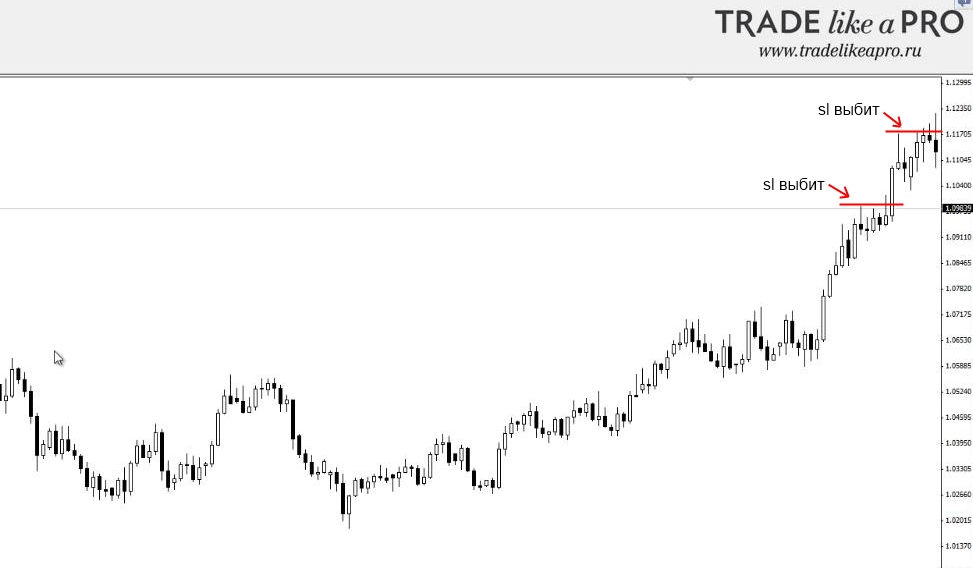
Our stop loss is hit again! And a doji is drawn.
Now do you understand why entries against the trend are very dangerous?
Because when we look at chart history that has already passed, we pay attention only to the extremes. Only to them. And on them all setups, since they are extremes, naturally turn out to be profitable.
After the doji, the price did indeed go down. It is still unclear whether it will continue lower or reverse and continue the upward trend. But the point is that price can rise for a very, very long time. And even without pullbacks.
Also, one should distinguish trading against the trend, when there is a clear trend and you trade against it, trying to enter the market against the trend, from trading in a range. That is, when there is no clear movement, no overall trend up or down, but there are zigzag movements. Well, like here, for example:
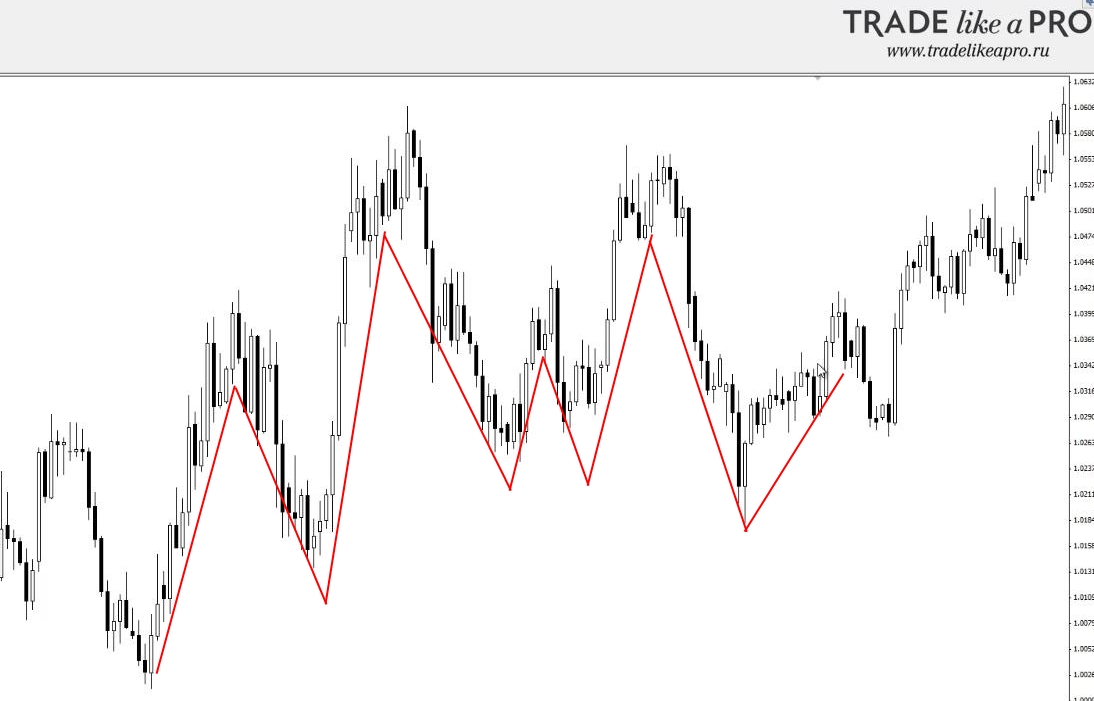
In a situation when the trend is unclear, when it is not clear whether bulls or bears are prevailing now, we trade as usual, as if we were trading with the trend, but we set more modest targets. That is, we trade from level to level, since in the case of a range it is unknown where the price will go. Whether it will bounce off the level or move further, forming a new trend, we do not know.
Therefore, acting under conditions of uncertainty, we set small targets: entered a trade, target - the nearest level. We trade from level to level as carefully as possible, and do not hold the position for a long time.
Trading in a range is more dangerous than trading with the trend, but less dangerous than trading against the trend.
So what are the signs of a good counter-trend setup?
First, our entry should be preceded by a strong move, as in the analyzed USDCAD example. That is, there should be a prolonged and strong trend either upward or downward.
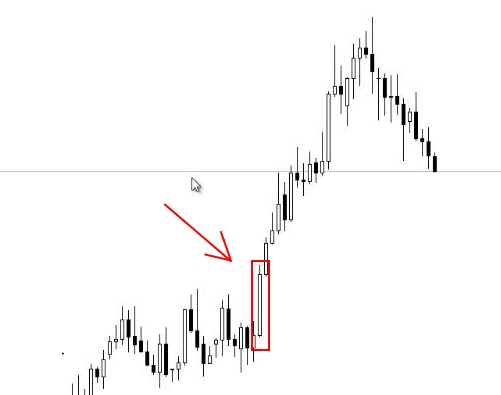
At the same time, the candles should be large, big in size compared to the previous ones. Compared to the average candle size of this chart, this time frame, and this currency pair. That is, the candles should stand out on the chart. For example, like this candle here:
Second, there should be space to the left. What does that mean?
If there is some movement that you consider trending, and you are going to enter it, but on the left you see other candles, then most likely it is not a trend but a range. But if these candles are far enough from your potential entry, then the trend here is not very strong and the entry is not justified. So it turns out to be neither a range nor counter-trend, but something unclear. As they say, the market decides where it wants to go. In such situations, it is better to refrain from entering and wait until the move reveals itself.
Third, you can consider entering a trade if there is a double top. If the previous top was not too far away, or if it was far away, but in that case it will no longer be a double top, but a push into a level.
For the double top, see the separate lesson, we covered this pattern not so long ago.
Also, if the price has run far away somewhere, and at the same time it is hanging in the air, and there is no support from a level, that is, when you zoom out the chart - this top has not occurred before, or it did occur, but a very, very long time ago.
For example, as in the illustration. I scrolled the daily chart back to 2009, and this top had not occurred.
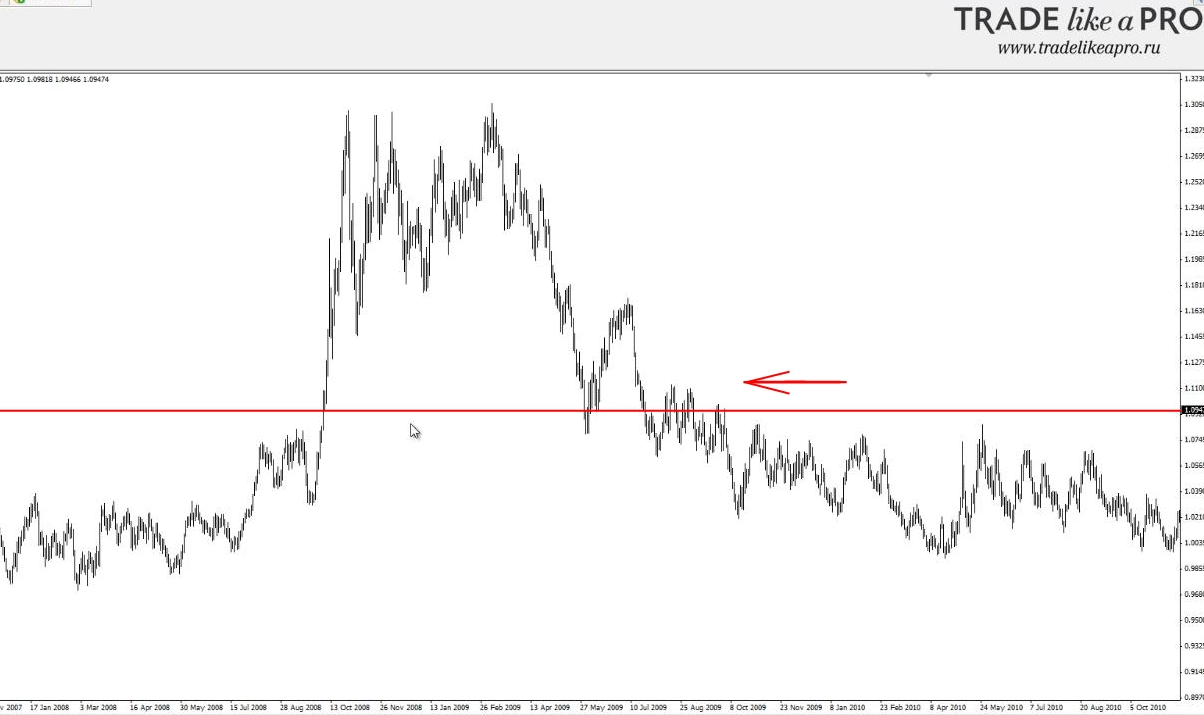
This price had been seen before for this currency pair, but this price did not form any extremes anywhere nearby. Therefore, there is no support from a level here. And if there is no support from a level, then entering is dangerous.
Are there such moments when the entry is more justified?
Yes. If the price is pushing into some level. Quite often, especially for those who trade intraday, it is useful to move to a higher time frame and see what is happening there. Here we have daily charts. Let us mark our top with a level.
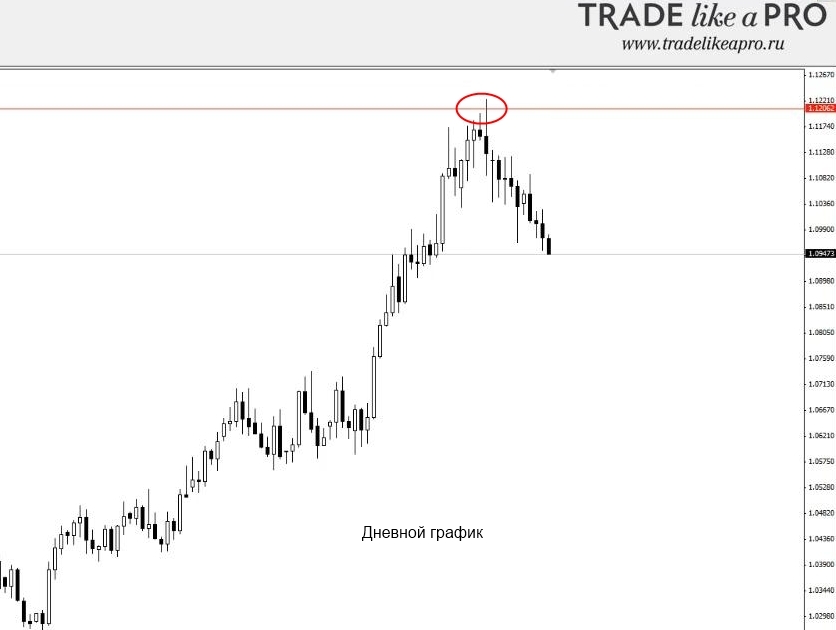
Suppose we are going to enter here, and now let us move to the weekly chart. Let us see what kind of level this is and what is happening on the weekly charts at all. On the weekly charts we have long candles, there is space on the left, a clear upward trend, and a pin bar. If we zoom out our chart a little, what will we see? Had this top occurred before?
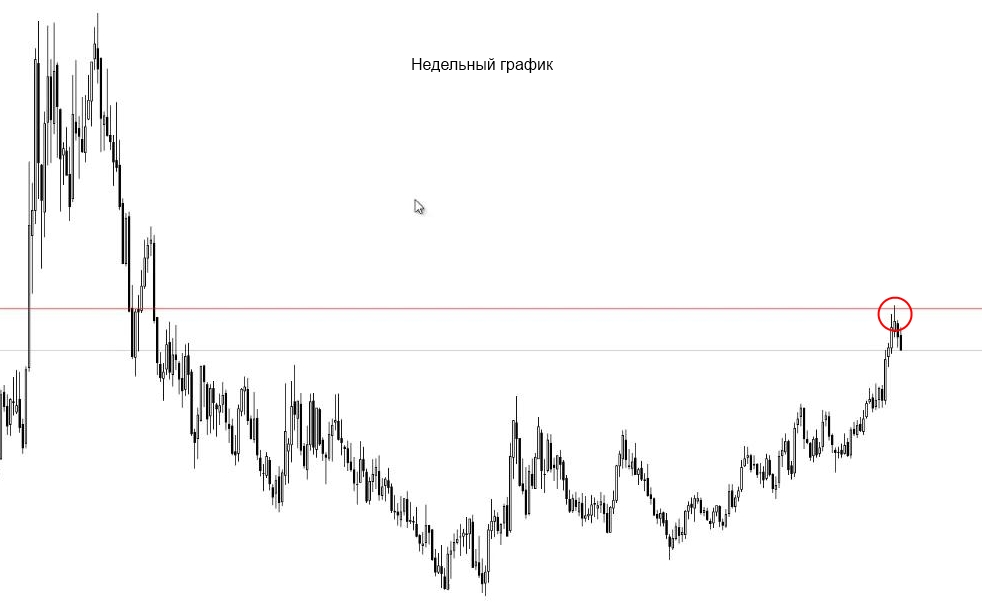
It had not, the entry is dangerous. And there is no level on the weekly charts. If the level we marked had been on the weekly charts, the entry would have been more justified. But we do not have a level on the weekly charts, so we work with what we have. Nevertheless, do not forget, in case of doubt, to look at the higher time frame.
So, I have listed for you several signs of a good counter-trend entry. But even these signs are sometimes not enough, because such signs as long candles, space on the left, the presence of some setup natural for entry - all this does not give us complete confidence, since the price may well continue moving.
And still, if you need to enter the market against the trend... When is it better to do it?
First, you should wait for all the signs I talked about earlier. And besides that, wait until the price has drawn a high at about the same level at least two times in a row. In this case, we can see it on the chart. The price is hitting practically one level.
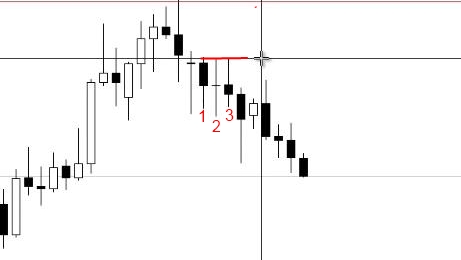
The price at which they were selling is 1, 1121. The price does not necessarily have to hit point for point; it is enough to rebound within narrow boundaries. Plus or minus two or three points. And when you see that for several days in a row they are selling from one point, that is, the price is not being allowed to go higher, this is a sign that you can enter sells. This is a sign that the trend has at least slowed down and that there will at least be a correction.
Because on daily charts, in order to hold the price below a certain level and sell from that level again and again, quite a lot of assets and quite a lot of resources are needed. This means that there is a strong player in the market.
Therefore, in the case of a strong prolonged trend, we wait until the price rebounds from one price level at least two times, and only then do we enter. Moreover, it is best to enter not far from this level. And, naturally, you need to enter with a pending order.
In this case, where is the best place to do it?
Here we have a candle that formed and rebounded from the price of about 1.1120. And one more candle formed and rebounded from the same price, a couple of points lower. Let us place a level. What does this mean? This means that a new level is being formed from which they are selling.
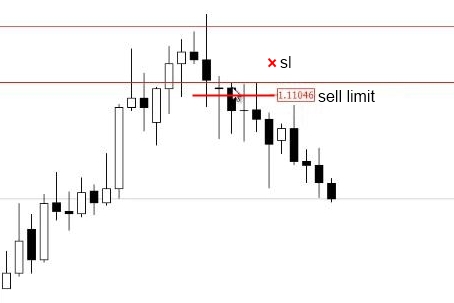
After the second candle has closed, which rebounded from the same point with its high, we place a sell limit pending order not far from the level. Let us mark where we would place the pending order. Let me remind you, the price rebounded from the 1.1120 level, so we place it at 1.1105. We place a sell limit pending order, since at the moment the doji closes the price is below the price at which we want to enter. And the stop loss is slightly above the level. At about the same distance at which we entered below the level, at the same distance above the level we place the stop-loss.
What target should be set?
In the case of entering against the trend, there is no point in setting any large targets, so our target is the nearest level. In this case, the nearest obvious level is far away. Therefore, you can hold, or you can play it safe and simply increase the stop-loss by 4 times. In this case, our stop-loss is 40-45 points. Let us multiply by 4. We get 160 points. But as you can see, the price has already reached this level. Our take-profit would already have been taken in this case. And the trade would have closed with a profit four times greater than this stop-loss.
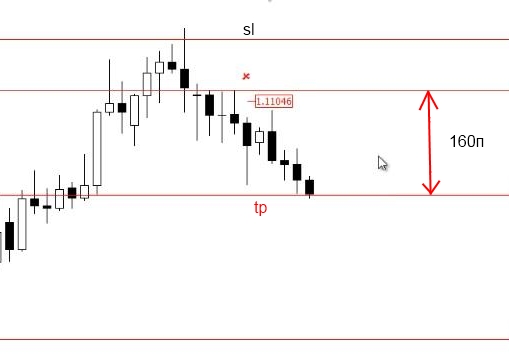
This is how you should enter against the trend.
If we had a level here, we could have entered more easily: by the setup, by the pin bar that would have had a supporting level. When there is no level, we wait for it to form, that is, until the price bounces twice from some price mark.
These bars do not necessarily have to come one after another. There may be one or two candles between them. But do not wait for too many candles either: five bars have passed, you can look for some new setups.
If we had buys, then we would wait until the price bounced twice from one price. We would wait until the lows of two candles became approximately on the same level. This would mean that a large seller is buying from that level. Likewise, if we entered by a setup from a level against the trend, then the stop-loss would be according to the setup rules.
A couple of tips for those who trade intraday
You can enter from the level of the previous day. Take the high point or the low point of the previous daily candle as the level when you trade intraday, watch the levels on the daily charts, and as a target take the average daily range, or simply close at the end of the American session, that is, in the evening. What do I mean when I say to take the average daily range as a target?
This is the average size of the candle from high to low for a given currency pair. That is, if the average size of the candle from high to low is, say, 100 points, and the price has already moved 80, then naturally it is better to exit, since the probability that it will move some large number of points is very, very small. How can you find out the average daily range?
The average daily range can be viewed using the ATR indicator, as well as on the website www.forexticket.ru:
- Go to this website.
- Find the Forex volatility section.
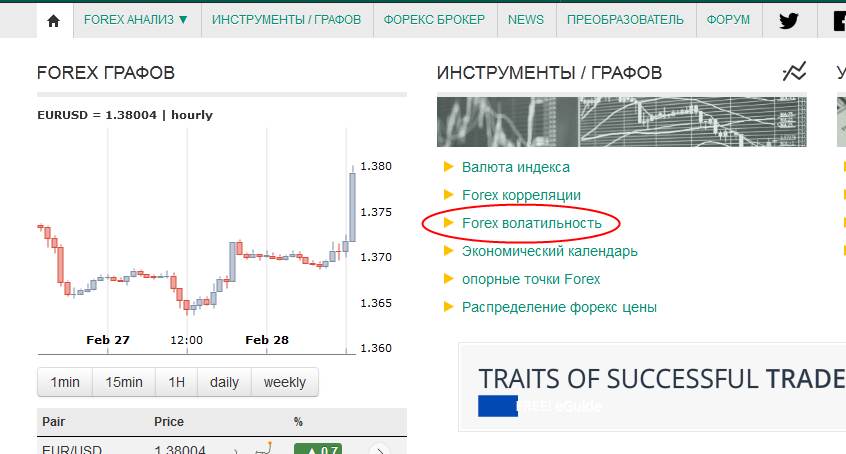
- Choose the required currency pair from the list, for example GBPUSD.
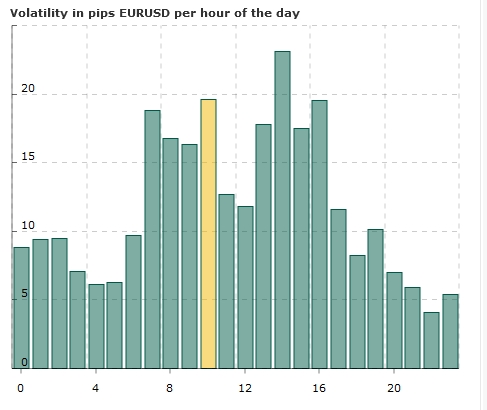
Here there is an average candle range from high to low even by hours, for those who like extreme trading, starting from M1.
There is an average daily range from high to low on different days of the week. Here, on Wednesday over the last 10 weeks, we had an average of 113 points. That is how much the price covers on average from high to low. On Thursday the average is 91 points, 110 on Friday, on Tuesday 84 points. On average, you could say 90 is the average daily range for GBP/USD.
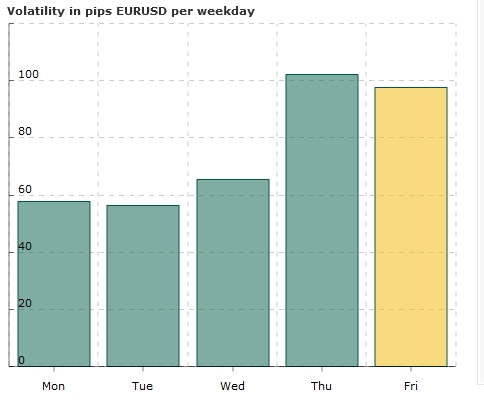
Accordingly, if the price has already covered 80 points since the start of the day, then opening any new positions and entering in the direction the price has been moving is pointless. And expecting any super profits is also pointless. It is better to exit. When trading intraday, take this data into account.
Let us look at a few more examples
Here is an interesting example: such a strong collapse began on H4 and a pin bar with a very long tail appeared. By the way, there was also support from a level here. It would seem that you could enter. But if we had entered here, then the nearest target, the nearest level, would have been this one.
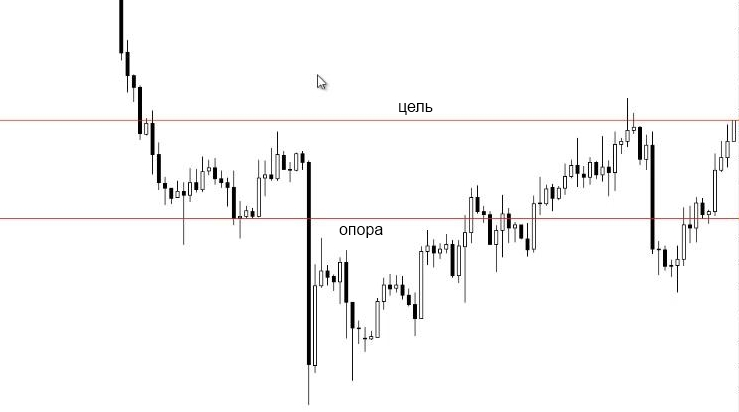
And as we can see, the price did not reach it. If you had still entered here and saw tails when the price came a little short of the target, that means you need to exit earlier. You saw the price come just short of your target and draw a tail, exit.
Therefore, when trading against the trend in general, and especially intraday, you should watch price behavior very carefully. The slightest signs that the trend will continue, while you entered against it, get out. It is better to have some tiny profit or a small loss there, but treat entries against the trend like some kind of flammable substance.
One interesting point of a successful entry against the trend
Sometimes on daily and intraday bars you see such very long tails as here.
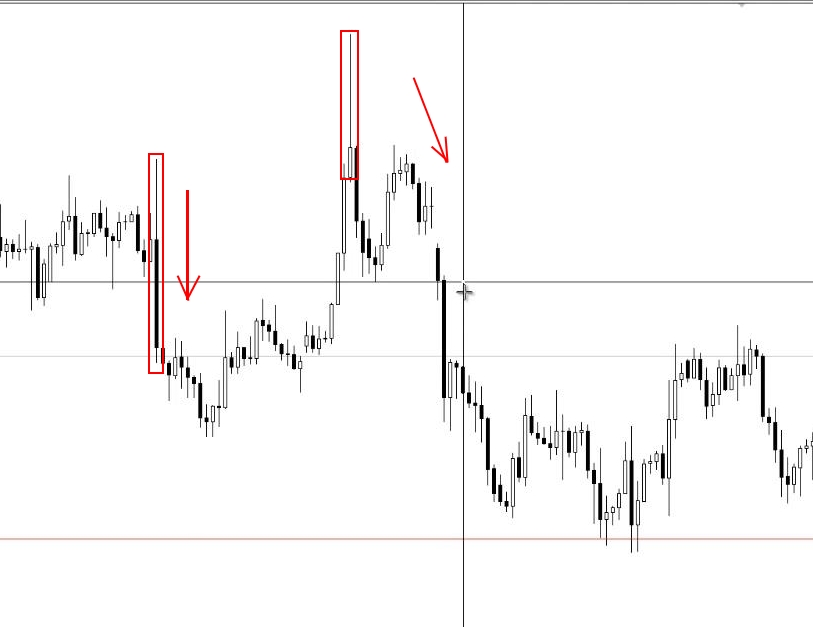
This is a good moment to enter. When a candle with such a long tail has closed, you can enter immediately. Because it means there is very heavy buying or selling, and there will be an impulse downward. After such candles, as a rule, this always happens. In such a trade you can already stay in longer. Not even to the nearest level, but to the next level. And take a very, very decent profit.
This is something like free treats from the market. Because everyone will be entering here. Do not forget about stops, set them either behind the tail or not far from the end of the tail, there is no other way. Because there are also spikes when they try to knock out those who entered on this tail. That is also normal. Here you need to place a big stop, but the profit is also often very large.
Another good example for an entry
A strong spike upward against the trend, you would have entered at the candle close and then the price moved lower. You could have stayed in to the nearest level. And to the next level. To the next level is probably the optimal option. Here you could have taken 129 points, which is very, very good on H4.
If there is some strongly protruding large tail, that is a good moment. Even if the trade is against the trend.
Let us look at a buy example. On the same chart there was a strong move downward, and then the price stalled. As soon as we see that the price has stalled, that is a sign that we need to get ready. Here it bounced off one level three times. After this doji, we could have placed a pending buy limit order. Practically at the same price as the low of this tailed candle, then the low of this little one, and the next one. And on this doji we could have entered. The stop-loss is slightly below the level, at about the same distance as the pending order is placed.
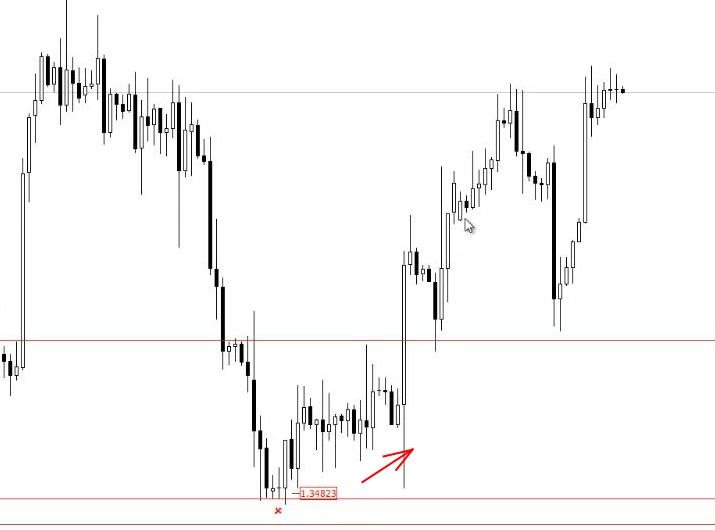
As we can see, the price made a false breakout, moving just a little beyond this price boundary. But the stop was not hit, and the price went up again. Here you could have stayed in until the nearest level. But you could also have exited later and still made a profit. And you could have stayed in even longer, but with moves against the trend it is dangerous to stay in for a long time.
I would have exited here either at this level, depending on exactly how you marked it, a couple of points lower there would have been a take-profit, a couple of points higher there would not have been a take-profit. If there had been no take-profit, I would have exited on this candle, since the long tail in this case indicates danger for the position. And I would have taken a profit of 30 points. These are 4-hour charts, and the stop-loss is only 10 points.
That is, even if we had closed after this tailed candle without taking the take-profit, the profit would have been 3 times larger than the stop-loss. And if we had taken the take-profit, then the profit would have been about seven times larger than the stop-loss.
Summary: Thus, to sum up, we can say that it is possible to trade against the trend, but very, very carefully. If you are a beginner, I would not advise you to open against the trend at all, only on strongly "tailed" candles. This is the only exception where even beginners can enter, while not forgetting to stay attentive.
I remind you that you need to watch the price more vigilantly when trading against the trend. The slightest hint that there is about to be a reversal against your position, get out.
Sincerely, Pavel TradeLikeaPro.ru
