
Traders Dynamic Index - that very indicator

All forex traders at some stage of their trading activity have thought about the existence of a trading grail. Of course, because with its help a trader's life could change significantly for the better. But trading circles persistently repeat from all sides that the grail does not exist. What should be done? There is a way out. In fact, it is enough to find a system that generates signals with a high ratio of profitable trades and strictly follow its rules. This will be that very key to profitable and stable trading. Today we will look at the Traders Dynamic Index (TDI) indicator and a popular strategy based on it, giving simple and high-probability entry signals.
TDI is based on the standard RSI indicator, which determines the strength of the current trend or, if you prefer, the rate of price change. To smooth the lines, the algorithm of moving averages is used, and to assess the amplitude of fluctuations, Bollinger Bands are used. Thanks to the comprehensive approach, the TDI indicator alone can be used as a complete trading system. In fact, thanks to the Trading Made Simple system (see below), it gained its fame as a tool for determining the current state of the market.
Indicator characteristics

Platform: MetaTrader4
Currency pairs: EURUSD, GBPUSD, AUDUSD, USDCAD, USDJPY, EURJPY, AUDJPY, EURGBP
Timeframe: H1-H4
Trading time: Around the clock
Recommended brokers: Alpari, Exness, Instaforex
Settings

- Period for calculating the RSI indicator. A value between 8 and 25 is recommended. The optimal period is 13.
- Selection of the source price for the Relative Strength Index. By default, the closing price is used.
- Standard deviation period. It is used to calculate volatility boundaries (Bollinger lines). The lower the value, the more sensitive the lines are to changes.
- Smoothing of the fast RSI line.
- Smoothing method. By default, a simple average.
- Smoothing period of the slow RSI line.
- Line smoothing method.
Working principle
The green line is a smoothed RSI line with a small period. The red one has a longer smoothing period and is called the signal line. RSI in its pure form is not used; its values are used only to calculate the fast and signal lines.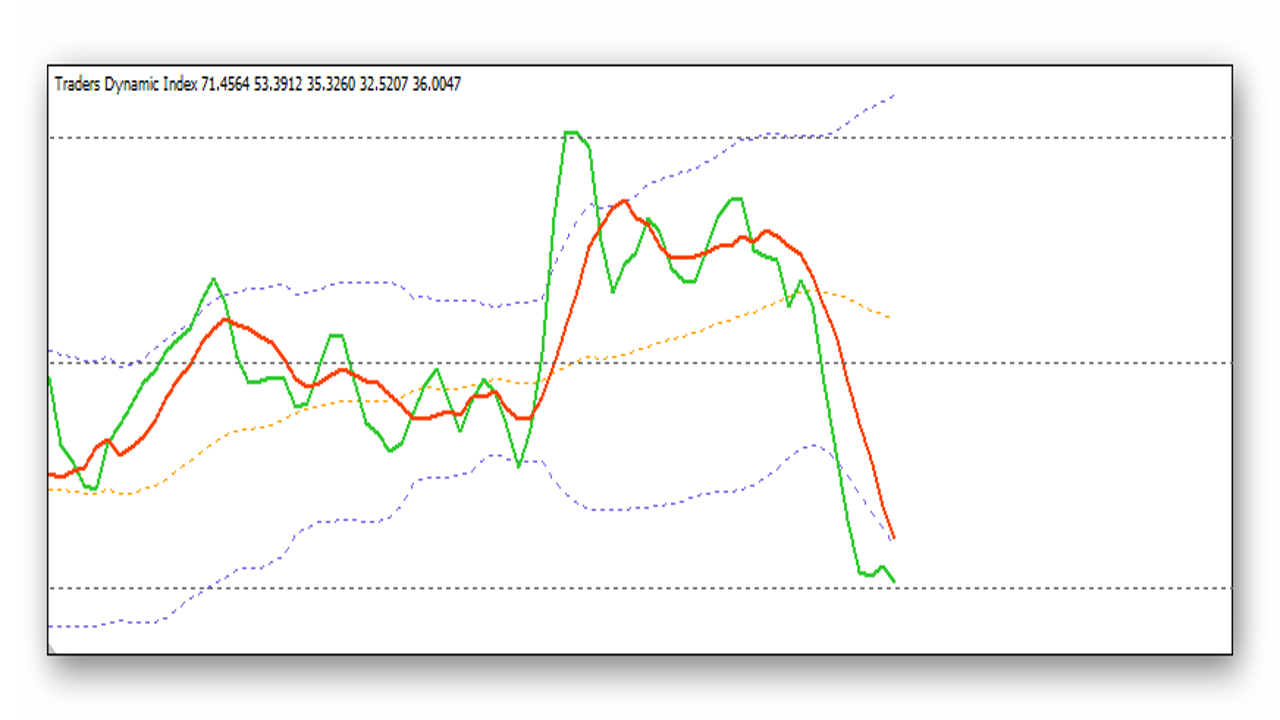 Bollinger lines are also built from RSI readings, but not from smoothed values. The orange line is the average between the upper and lower channel lines. In fact, these 3 lines display market strength and current volatility.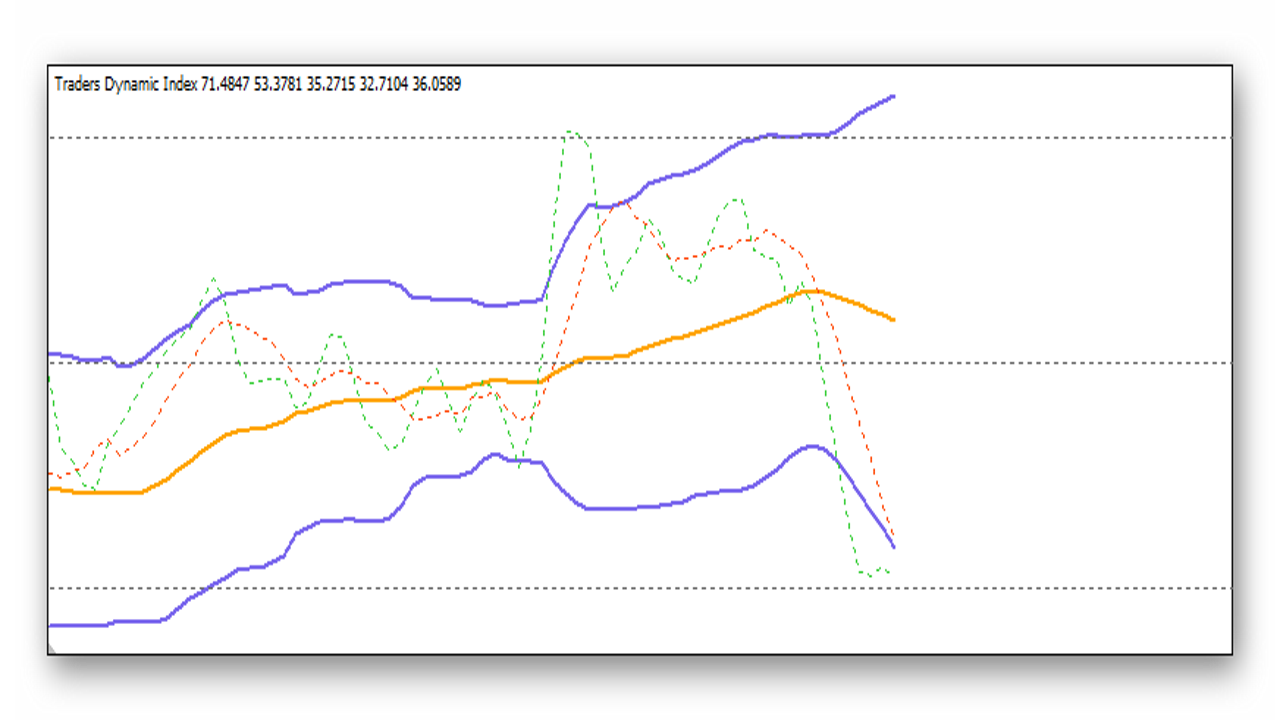
Signals
The TDI indicator simultaneously shows the direction and speed (strength) of the current trend, by which we already determine the appropriate moment to enter a trade. Despite its complex nature, understanding how the indicator works is quite simple - you just need to be able to identify the signals and understand what they mean.
- Trend direction
First of all, the indicator can be used to determine the current trend. The green line above the red one signals a change in the short-term trend to an upward one. When the green line falls below the red one, the short-term trend changes to a downward one.
The yellow line indicates the long-term trend. Most of the time it does not go beyond the 68 and 32 boundaries. When the line bounces off these boundaries, it signals a possible change in the trend.
- Market strength and volatility
The indicator also signals the current strength of the market. Usually, the greater the slope of the green line, the stronger the market players are. If the line moves more horizontally than vertically, we are dealing with an extremely inert market.
The expansion of the Bollinger lines signals an increase in volatility. The narrowing of the lines, on the contrary, indicates a decrease in volatility and weakening of the market. If the lines narrow strongly, one should expect the release of some important reports or other news capable of moving the market sharply. In such cases, it is better to temporarily refrain from trading.
- Trading signals
First, let us consider tactics for scalpers. If you trade with short targets, you need to open a Buy trade when the green line crosses the red one in the direction of the upward trend.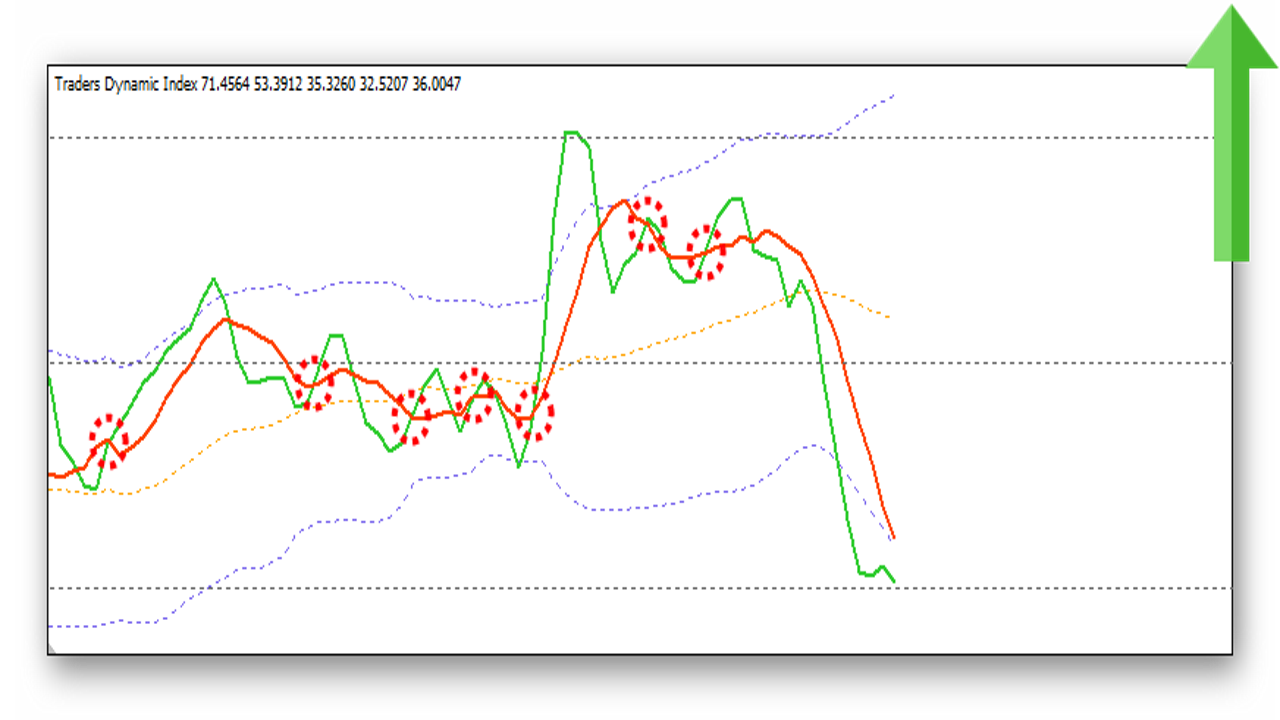 Similarly, we open a sell trade when the green line is below the red one.
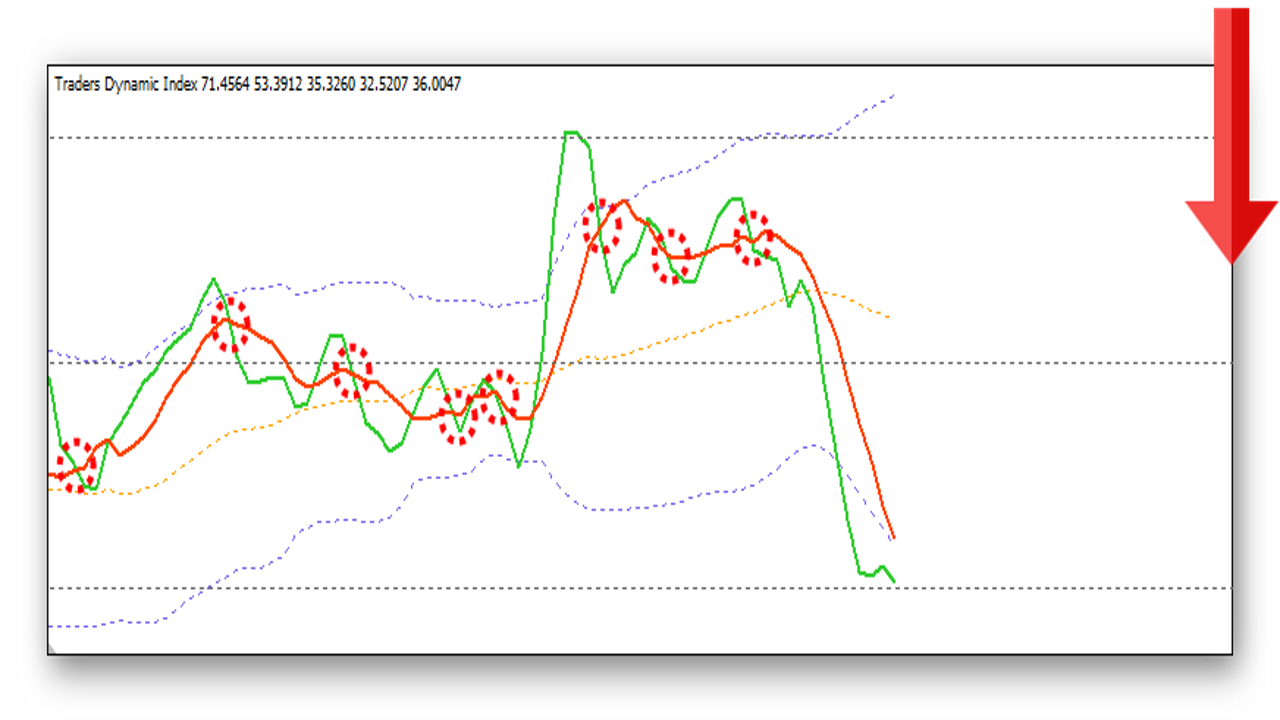 For more conservative traders, it is worth entering a buy position only when both lines are above the yellow one. Accordingly, in the case of a sell, the green and red lines must be below the yellow line.
There is also a variation of the strategy for medium-term positions with a holding time from several days to several weeks. The rules are the same as for the conservative strategy, except that all three lines must be above level 50 in the case of a buy and below it in the case of a sell. Ideally, Bollinger should indicate increasing volatility, that is, the lines should diverge.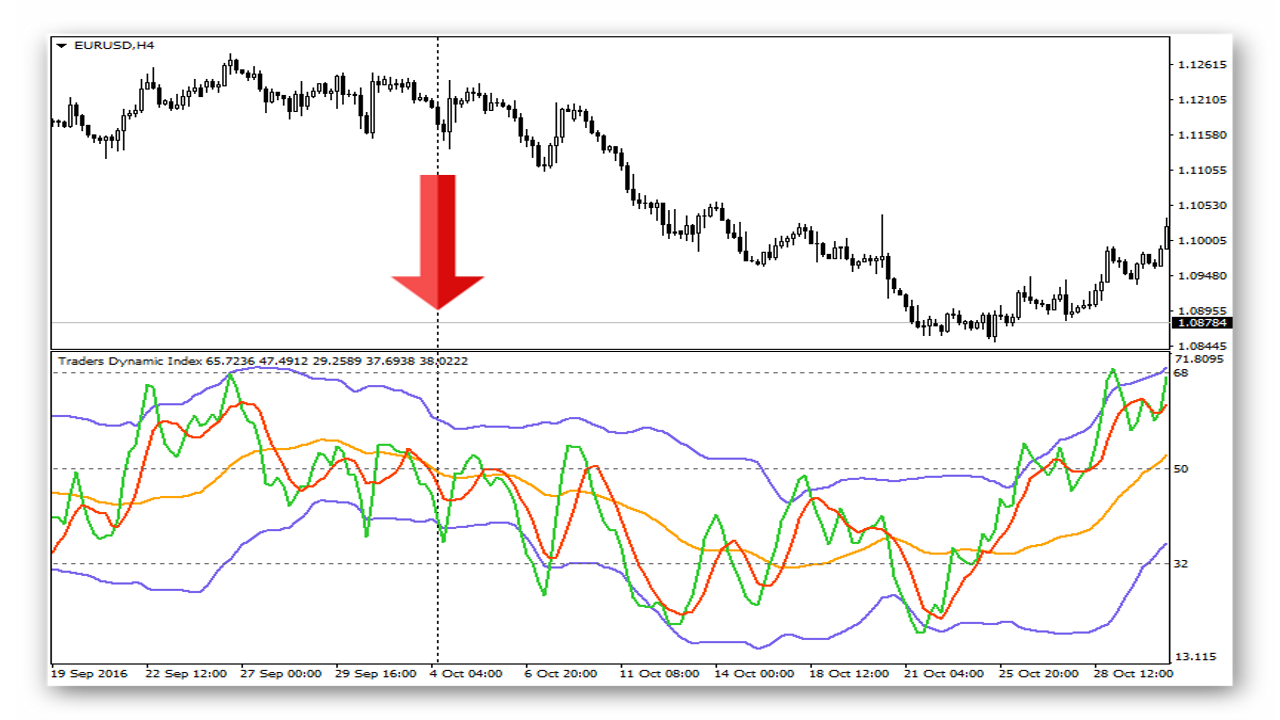
Trading Made Simple

Now let us move directly to the much-talked-about trading strategy. Unfortunately, its author passed away due to old age, but the system continues to develop, already counting almost 4000 pages in the original thread.
In addition to the TDI indicator itself, we will use Heiken Ashi and stochastic.
It is worth entering a buy position when the green line crosses the red one from bottom to top during the first two Heiken Ashi candles. The same thing, only the other way around, applies to a sell. That is, both indicators should show a change in trend at about the same time.
For confirmation, we use stochastic readings with parameters 8/3/3. In the case of a buy, the stochastic should be in the oversold zone; in the case of a sell, in the overbought zone. If the stochastic is in the space between levels 80 and 20, we look at the slope of the line. The slope of the stochastic should be greater than 30 degrees in the direction of the main signal.
It is worth exiting the trade when the green line begins to bend or shows signs of a reversal by becoming horizontal.
We place the stop-loss at the low or high two candles back, but no less than 20 points. We place the take-profit at twice the stop-loss. As a rule, this is about 40 points. Here you can combine two approaches by splitting the position into two parts. We close one part on the green-line signal, and set a take-profit on the second.
Let us look at several examples on the H4, EURUSD chart.
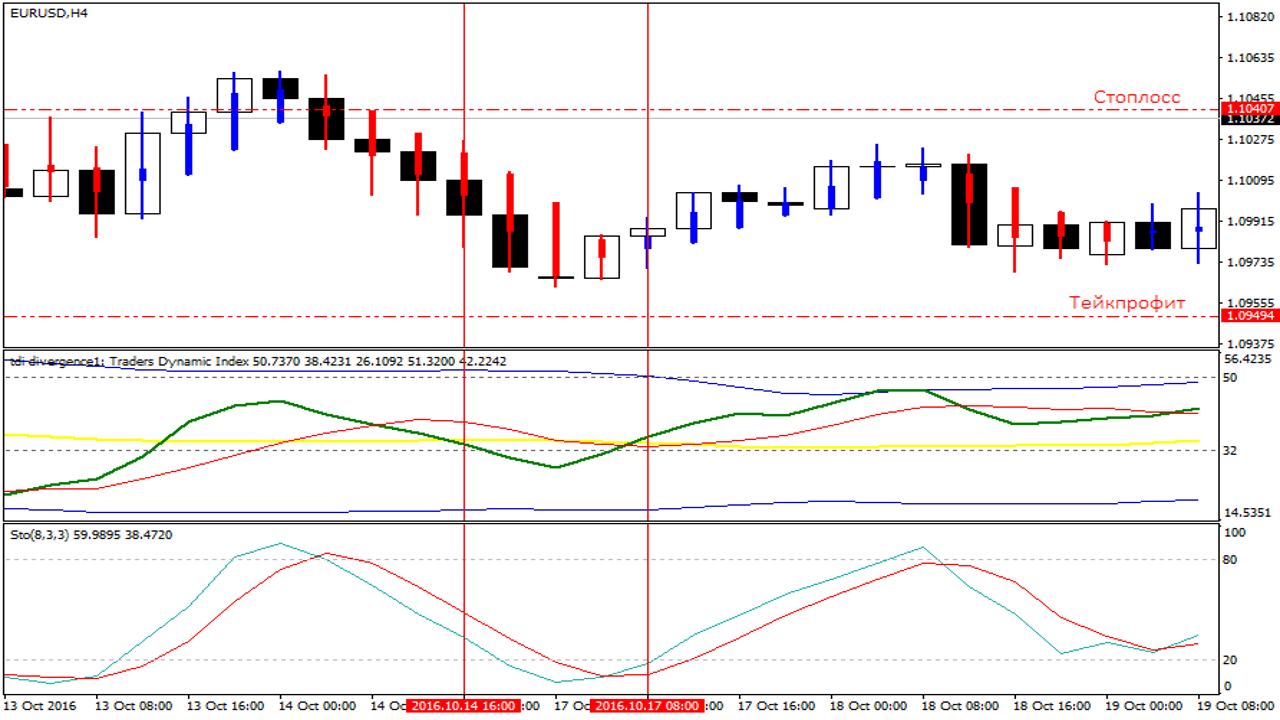
- Here we received a signal in the first two Heiken Ashi candles. At the same time, the stochastic shows a slope greater than 30 degrees. We set the stop-loss at the level of the high two candles back - 30 points, and place the take-profit at a distance of 60 points. We exit the trade when the green line changes direction. Result: +24 points.
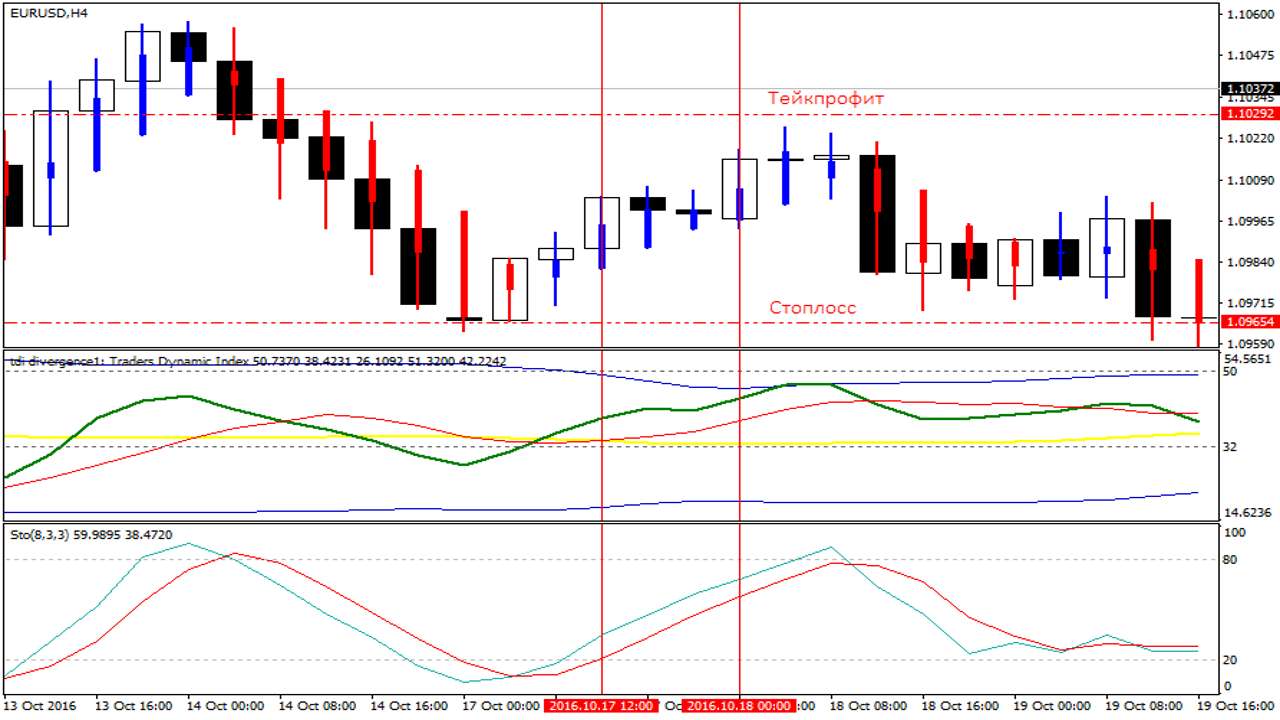
- The crossing of the green and red lines occurred on the first Heiken Ashi candle. The stochastic is in the oversold zone. We open a buy position, place the stop-loss at a distance of 20 points, and the take-profit at a distance of 40. We exit the position when the direction of the green TDI line changes. Result: +10 points.
- The crossing occurred in the first two candles. We set the stop-loss at the local extremum, and the take-profit at a distance of 80 points. We closed the trade on the indicator signal, but, as we discussed earlier, in some cases you can split the position into two parts - we close the first by take-profit, and the second by signal. In this case, the trade closed almost without profit, result: +4 points.
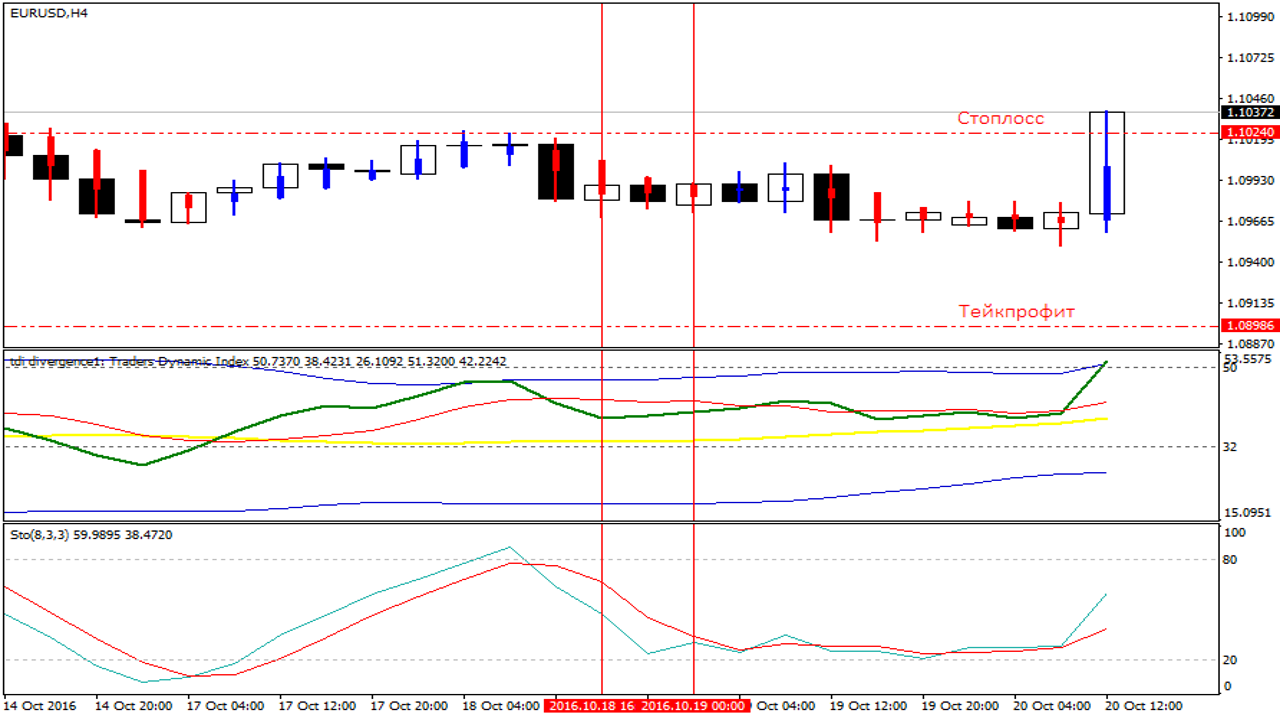
If the stochastic is between levels 20 and 80 and at the same time does not have a clearly expressed direction, we ignore TDI signals. If, however, the stochastic enters the overbought or oversold zone, we do not look at the angle of slope.
You can discuss the original trading strategy on our forum.
Conclusion
The author claims that over time anyone will be able to achieve a rate of 85% successful trades by trading according to the described method. Some even manage to get an even better result by trading using only the TDI indicator. To obtain higher-quality signals, you can additionally use a higher timeframe. That is, first we get a signal on H1-H4, then we move to M5-M15 and wait for a signal in the same direction. We close the trade according to the same rules, but on the smaller TF.
The TDI indicator works on its own, but with the help of additional filters or another TF we can get higher-quality signals so that trading is as effective as possible. You can come up with your own filter or use one of the proposed ones - each of us has some special indicator that is most comfortable to work with.
Download the Trader's Dynamic Index indicator

Indicator thread on the forum
Respectfully, Alexey Vergunov
TradeLikeaPro.ru