
Trade with pleasure! Renko Candles - building a chart "brick by brick"

Hello, friends! On our site there have already been several forex strategies for trading on Renko charts, I think it is worth considering this type of chart separately, discussing the pros and cons of such an approach to trading. Also as part of this review we will get acquainted with an alternative indicator for building Renko charts, since some of the old utilities do not work for some people after the Metatrader 4 update.
What are Renko charts (Renko)?
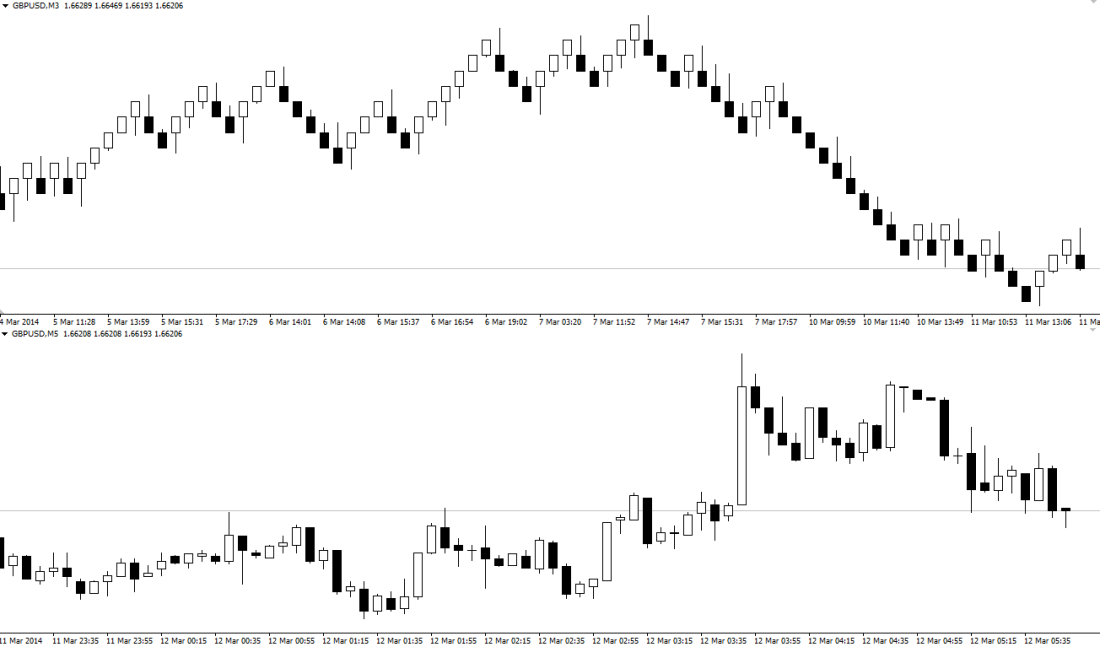
Renko charts (top) and regular candles (bottom)
This graphical method can be used to display trends that may not be so obvious on charts built from bars or candles.
Renko charts were invented by Japanese traders several hundred years ago and were given the name Renga, which in Japanese means “brick.” How do they differ from bar or candlestick charts? First of all, they are visually attractive, which makes them easy for filtering out noise and for isolated perception of trends. They display candles symmetrically and are effective for determining the main trends and support and resistance levels. Renko charts can be used effectively to obtain a signal of a trend reversal.
Renko charts are one of the ways of representing price changes. They display the trend in a way that bars and candles cannot display it. Renko charts are able to filter out noise and create the uniformity underlying the trend. While useful, Renko charts also give signals about reversals and serious warnings regarding trading, and overall provide a number of advantages for carrying out trading using this kind of chart. One of them is that the trader has the opportunity to stay in the market for a longer amount of time than when using other methods of trend following.
Advantages of Renko charts

Compared with more traditional candlestick charts, Renko charts make the decision-making process much simpler. A typical one-minute EURUSD candlestick chart would contain 1440 candles in one day, while a similar Renko chart (with a brick size of 10 points) would contain only 15 to 40 Renko bricks. Thanks to the smaller number of candles, the number of variables that you need to take into account for making your trading decisions during the trading day is reduced.
Pros of Renko charts;
- Clearer display of trends
- Absence of strong "noise" on the chart
- Alternative operation of indicators and advisors
- Simpler trading for short-term traders
Construction of Renko candles

Renko charts consist of dark (bearish) or light (bullish) “bricks” that move in the direction of the trend. As a rule, before a trend reversal, bricks of different colors begin to appear, and the movement continues by two or more bricks in the same direction. If you look at regular candlestick charts of similar timeframes, you can see the appearance of various signals, both trend and countertrend. However, the Renko chart will keep the same trend direction until another, opposite brick appears.
After a Renko brick has formed, it will not change its direction until the next brick is formed. The disadvantage of Renko bricks is that they are never displayed one next to another.
They are always displayed strictly at an angle of +45 degrees or –45 degrees relative to the previous brick. After a brick is created, its size will never change, and it will never be removed.
Size of Renko candles

The size of Renko bricks determines the accuracy of trend display and is set depending on the volatility and long-term nature of your trading tactics. The smaller the size of the bricks, the greater their number will be displayed on the chart, and the more clearly the price movement will be shown. The larger the sizes of the Renko bricks, the fewer candles there will be on the chart and the more hidden price movements there will be. Therefore, when choosing the candle size, you should be careful.
Setting the brick size on a Renko chart is more of an art than a science. In order to determine the optimal brick sizes, it is necessary to carry out various studies, but by and large, the brick size is specific to each individual instrument and the range of its volatility.
You should experiment by applying various brick sizes in practice and find a size that would match your strategy and indicators.
From my own experience, I have found that intraday Renko charts are more effective than when trading on daily charts. Therefore, I advise using Renko candles only if you trade intraday.
Disadvantages of Renko charts

Although Renko charts are visually appealing and display trends well, certain problems may arise when working with them:
1. Renko bricks suppress noise and/or volatility. One of the difficulties is that it may take 5 or 50 minutes, or several hours, for each subsequent brick to form and appear. Since a new brick is generated only when the candle on the current chart closes, waiting for the next one to appear will cause you some anxiety. During consolidation, it will take much more time for a Renko brick to form. While the next Renko brick is forming, a candlestick chart could show consolidation, an unwanted reversal, or a frequently changing price direction. It should be remembered that in the area where key moving averages or other critical price levels cluster, there is frequent alternation of differently directed Renko bricks. This alternation can be especially sharp when the price is near a key support or resistance level.
2. Smaller Renko brick sizes will show upcoming reversals faster, while larger brick sizes will cause a delay in recording price movement.
3. In a trend, the difference between the top of a light Renko brick and the bottom of a new, oppositely directed Renko brick is three times larger than the size of that brick. This happens because, for an oppositely directed Renko brick to form, the closing price must be below the bottom of the Renko brick. Thus, while waiting for the next oppositely directed Renko brick to appear, you will need more time. As a result, you will also need to resort to other methods in order to protect your profit.
4. The number of oppositely directed Renko bricks is much smaller than the number of same-direction bricks. For a trend this is only an advantage; however, when working in combination with many trend indicators, it is possible to get signals for reversals that are too early and therefore false.
5. Renko bricks are formed using closing prices, and the number of bricks displayed in one direction or another will become known only after the current candle closes. This can lead to a delay in chart formation. Another important question is also what the number of such Renko bricks will be by the close of the candle or trading session.
Installing Renko Charts in MT4

By default, there are no Renko charts in the Metatrader 4 terminal. Therefore, we will need a special indicator to create them, which you can download at the end of this post. The archive needs to be unpacked and then follow the instructions below.
0. Download and install the Metatrader 4 terminal
1. Copy the contents of folder 1 into the folder with the installed Metatrader 4 program, agree to replace files if the names match.
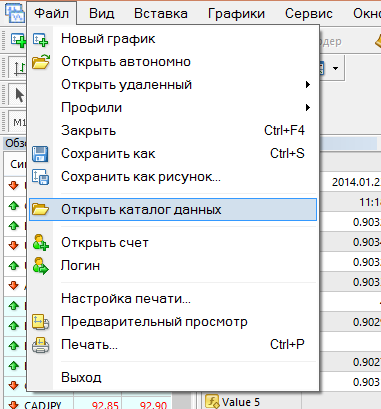
2. Copy the contents of folder 2 into the terminal data directory.
How to get there?
To get to the data directory, in the terminal click File -> Open Data Folder
3. Restart the terminal.
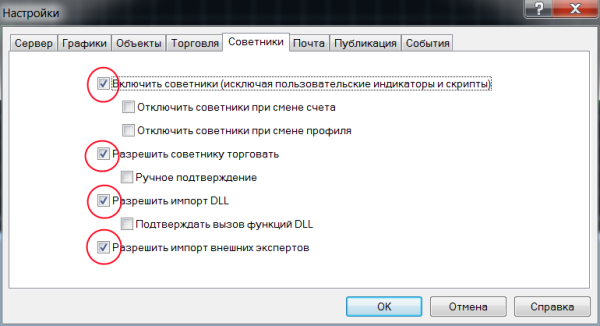
4. Open the Metatrader 4 terminal, go to Tools->Options
Select the Expert Advisors tab and check the boxes as shown in the figure below. Press OK.
5. Open the chart of the required currency pair with the M1 timeframe.
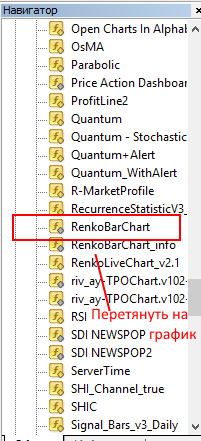
6. Install the RenkoBarChart indicator on it by dragging it onto the chart from the "Navigator" window
7. Go to the File menu -> Open Offline
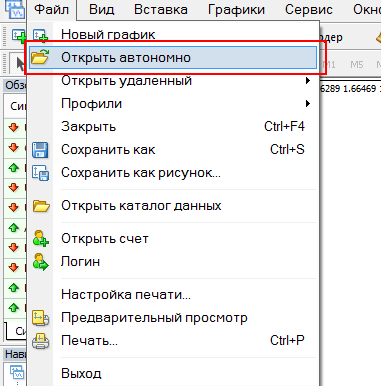
8. Find the chart of our currency pair with the M3 timeframe (by default, this can be changed in the indicator settings) and double-click it with the mouse.
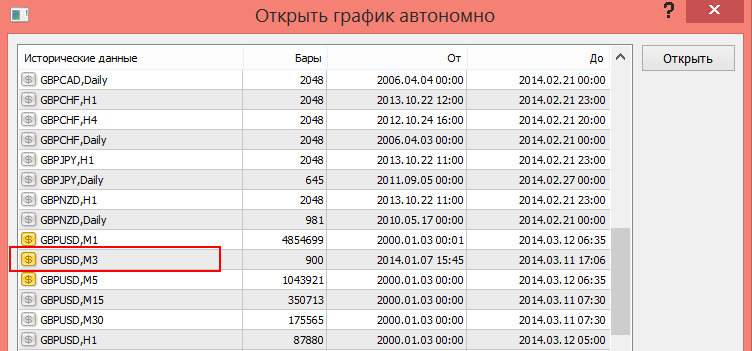
9. A chart with Renko candles for our currency pair will open.
Conclusion

Renko charts are visually more pleasing. They display symmetrical candles and are effective for identifying major trends and support and resistance levels. Renko charts suppress noise and reproduce the uniformity underlying the trend; they are also effective in that they give signals of trend reversal. Renko charts are based on closing prices, and their concept is similar to the one used for point-and-figure charts.
Buy and sell signals on Renko charts are generated when the Renko bricks change their color. They can also be used together with other indicators, which will help you improve your trading results.
Despite the cautions, on Renko charts one can identify various reversal patterns, as well as see excellent support and resistance levels. However, they are mainly suitable for intraday traders.
Download the script (indicator) for building Renko charts

Respectfully, Pavel
TradeLikeaPro.ru