
Forex Order Book Indicator | Liquidity & Support Levels
Forex Order Book Indicator: How to Read the Data and Use the Tool
What Is the Forex Order Book Indicator?
The TLAP Forex Order Book Indicator provides an Order Book (Depth of Market) view based on aggregated OANDA client data. It visualizes the distribution of resting limit and stop orders across multiple price levels, helping traders identify areas of concentrated liquidity where price is more likely to react, stall, or accelerate.
Rather than displaying price alone, the indicator reveals how liquidity is positioned around the current market, providing valuable insight into market structure and trader positioning.
While the Order Book does not predict future price direction, it helps traders understand where significant liquidity is concentrated and where the market is most likely to respond.
Indicator Overview
The interface consists of two main sections: the price chart with the Order Book on the left and the market statistics panel on the right.
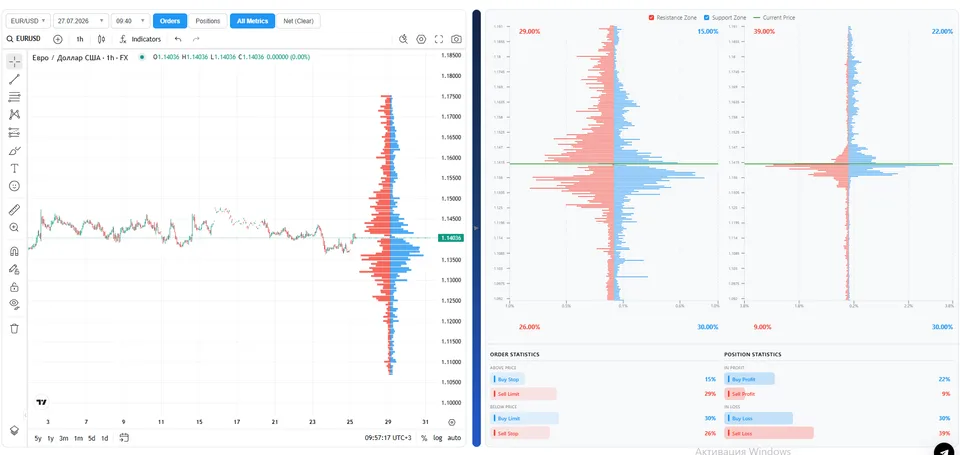
Left Panel: Price Chart and Order Book
The chart displays the distribution of resting limit orders as horizontal bars positioned at their corresponding price levels.
Blue bars represent buy-side liquidity (limit buy orders).
Red bars represent sell-side liquidity (limit sell orders).
Below the current price, traders typically find limit buy orders together with sell stop orders, forming potential support zones and areas where downside liquidity is concentrated.
Above the current price, the indicator displays limit sell orders together with buy stop orders, highlighting potential resistance levels and areas where a stop-loss run may trigger a strong upward move.
Right Panel: Market Statistics
The statistics panel summarizes aggregated OANDA client data using distribution charts and percentage values.
It displays:
the distribution of pending orders and open positions above and below the current price;
the percentage of buy and sell orders.
These statistics help traders evaluate market positioning, monitor order and position distribution, and identify where liquidity is concentrated.
How to Use the Indicator
The Forex Order Book Indicator is designed to complement technical analysis by adding liquidity information to your market view.
A typical workflow includes:
Select a currency pair and timeframe. For most intraday strategies, M15 to H1 provides an effective balance between market structure and execution timing.
Locate major liquidity clusters. Large concentrations of resting limit orders frequently act as support or resistance where price may react, stall, or break through.
Watch for clusters of stop orders. When a significant number of buy stops or sell stops accumulate near key price levels, the market may perform a stop-loss run or liquidity sweep, often resulting in increased directional momentum.
Validate your trade setup. Strong buy-side liquidity below price may reinforce a bullish scenario, while heavy sell-side liquidity above price strengthens a potential resistance level.
Practical Trading Scenarios
Support Confirmation
Your technical analysis identifies a potential long setup, while the Order Book shows a major concentration of limit buy orders below the market. The additional resting liquidity reinforces the support level and increases the probability of a meaningful price reaction.
False Breakout at Resistance
A significant concentration of limit sell orders sits above the current price together with numerous buy stop orders. If price reaches this area, the market may trigger a stop-loss run, creating a temporary breakout before reversing back below resistance.
Breakout Trading
When price approaches a major stop-order cluster, experienced traders may look for breakout entries as stop orders are triggered and directional momentum accelerates. As with any breakout strategy, disciplined risk management remains essential.
Integrating the Indicator into Your Trading Strategy
The Forex Order Book Indicator is designed to strengthen an existing trading strategy rather than replace it.
It is particularly useful for:
validating support and resistance levels using real order distribution data;
assessing the likelihood of false breakouts and liquidity sweeps;
selecting more effective stop-loss and take-profit locations around major liquidity clusters;
combining order book analysis with price action, market structure, volume analysis, and support and resistance techniques.
Using multiple forms of analysis provides a more complete understanding of market behavior than price action alone.
Why Use the TLAP Forex Order Book Indicator?
The TLAP Forex Order Book Indicator helps you:
visualize real order distribution based on aggregated OANDA client data;
identify resting liquidity that cannot be inferred from price action alone;
recognize areas where price is more likely to react, accelerate, or reverse;
improve trade execution and timing by incorporating liquidity into your analysis;
support both intraday and swing trading strategies with additional market context.
Used alongside technical analysis and disciplined risk management, the Forex Order Book Indicator provides deeper insight into market liquidity, order flow, and trader positioning, helping traders make more informed trading decisions.