
TDW and TDM - testing Larry Williams' theories on Forex
 Many authors of various books on trading often share their view of the market, trading secrets, and general approach. But if you take some approach from any book and trade according to it, know this: you are acting rashly. Every time you come across a new trading idea, before applying it in practice, you simply need to first carefully check and test it on historical data.
You surely know that the economies of different countries are subject to cycles. And if not, read this article. The site also has a special tool that calculates seasonal cycles in the movement of currency pairs. Larry Williams in his book "Long-Term Secrets to Short-Term Trading" reflected on the cyclicality of markets and invented such filters as TDW (Trade Day Week) and TDM (Trade Day Month). The idea is very simple: to find patterns in the market's rise or fall on certain days of the week or month. And today we will check the possibility and advisability of applying them in the forex market.
Who is Larry Williams?
Trader Larry Williams is one of the best-known professional currency speculators today. His main successes are connected with trading CFDs and stocks. Besides practical activity, Larry is widely popular as a theorist who regularly conducts seminars in different corners of the globe. The books of the legendary trader became real bestsellers, selling in hundreds of thousands of copies.
 Williams was born in October 1942 in the tiny town of Miles City, Montana, USA. He began working while still at school in his hometown of Billings (Oregon), taking a side job at the enterprise where his father worked. The young man was predicted a great future in the epistolary genre, and there is nothing surprising in the fact that in 1964 Williams graduated from the University of Oregon with a degree in Journalism.
After completing his education in his home state, Williams moved to New York and got a job as a proofreader at one of the local advertising agencies. Some time later he returned home to organize his own newspaper, The Oregon Report. The publication specialized in covering economic and political events. It was this topic that determined Larry's future development. As the financier himself recalls, one of the articles from which he learned about a serious rise in a company's shares pushed him to become interested in playing on the stock exchange.
At the first stage of his trader career, Larry Williams specialized exclusively in stocks. Work based on technical analysis, carried out by studying the indicators of that time, did not bring much success. On the advice of one of his friends, Williams switched to the futures market, and, as it turned out, it was a direct hit in the bullseye. Already in the early seventies Larry became a millionaire, after which his career steadily went upward.
Larry Williams' real finest hour came in 1987, when, being a successful investor, he volunteered to participate in the Robbins World Cup futures championship from the investment company Robbins Trading Company. The rules were simple: achieve the maximum profit in a year with an initial investment amount of 10 thousand U.S. dollars.
Exactly 12 months later the world was shocked: Williams showed a return of 11 376%. The result could have been even more impressive if not for "Black" Monday on October 19, after which the Dow Jones index collapse of almost a quarter was recorded. By that moment Larry's assets already totaled more than two million, and the return at one point exceeded 20 000%.
One of Williams' most important merits before the trading and world community is the improvement of technical analysis methods. He developed and improved a number of popular indicators. His most famous brainchild is Williams %R, also known as Williams Percent Range.
What are TDW and TDM?

Have you ever had the feeling that during the week the market behaves as if according to a pattern? Yes, not always, but still at least once you must have caught yourself thinking that. So, Larry Williams decided to check whether this was really so.
To test his hypothesis, taking a certain system, Williams simply added up the resulting system results for Mondays, Tuesdays, and so on. He discovered that certain days are much more suitable for buying, and some, on the contrary, for selling. He carried out his test for U.S. market stocks. That is why, if you take and begin mindlessly applying the results of his research, you will blow your deposit. But, fortunately, today we will study in detail the applicability of his conclusions to the forex market.
So, what is TDW? In English, this abbreviation stands for Trade Day Week, or trading day of the week in Russian. TDM, accordingly, is Trade Day Month, or trading day of the month.
The main idea of these patterns is that the market is subject to cyclicality and, because of various processes taking place in the economies of countries around the world, on some days of the month or week the probability of closing above or below the opening price is significantly higher than 50%.
Testing the hypothesis

To test this theory, I wrote a simple expert advisor that opens a trade in the specified direction on the specified day of the month or week and keeps the trade open for a certain number of days. No position management, stop-loss or take-profit levels are provided so that they do not influence the result. The exit point, as is known, is of enormous importance for the final result of a system, sometimes even more important than the entry point. It is very often possible to turn an unprofitable trading system into a profitable one by choosing the optimal exit option. Therefore, only one indicator will affect our exit, the number of days a position is held, and it will be the same for all days. That is, we will have only one exit point.
As for the entry point, in the advisor settings I set one of three options for each day of the month: 0 (do not enter), 1 (buy), and -2 (sell). These parameters, together with the position holding time, are exactly what I will optimize. The system also uses the simplest trend filter: if the price is above the 100-period moving average, only buys are allowed. If below, only sells. The filter parameters remain unchanged for all currency pairs. Optimization will take place on the segment from 2000 to 2013. The remaining period is reserved for forward testing.
The whole process takes place automatically in order to exclude subjectivity in evaluating the forward-test results: an algorithm does everything for me and offers one, the most optimal result at the output. When selecting parameters, results with a small number of trades, with a low profit factor (less than 1.1), and with a maximum drawdown exceeding 20% are immediately discarded. In addition, setting sets are discarded in which the profit factor or drawdown values during the optimization and forward periods differ by more than 10%. Thus, only the most stable sets of settings remain, from which the best one according to a given criterion is also selected automatically. To test the resulting system, as criteria for selecting the best option I chose the number of trades, profit factor, drawdown, and final profit.
Building the system

If the hypothesis is correct and the TDM pattern really works, then it is possible to build a full-fledged trading system. Thus, after the basic test we will add the use of stops based on ATR and takes as a percentage of the size of the stops to the system.
The third stage will be adding various exit options to improve the strategy's results. These will be exits based on readings from various indicators and indicator-free signals. Then we will select various position management options, such as an ATR trailing stop. And at the final stage we will apply the TDW pattern: we will prohibit trading on those days of the week on which the system's results are the worst.
Testing

Below I will provide summary tables for each stage of building the system for USDCHF, GBPUSD, EURUSD, USDJPY, USDCAD, and AUDUSD, as well as combined tests.
Let me remind you that optimization will take place on the segment from 2000 to 2013. The remaining period is reserved for forward testing. Quotes from broker Alpari are used for all tests.
We carry out the first test only on the TDM pattern itself, without using stop and take-profit orders, trailing stops, and various exit rules. The entry rule is a certain day of the month. If the settings for that day are 1, the advisor will buy. If minus 1, it will sell. At the same time, for buys the price must be above SMA (100), and for sells below it. Exit is after a certain time set in the settings.
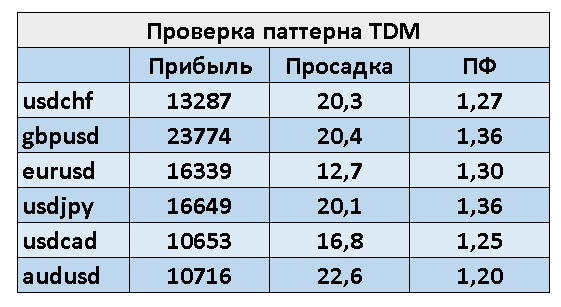 The drawdowns are quite large, and still the pattern works fairly well. Let us add ATR-based stops and take profits depending on the size of the stops:
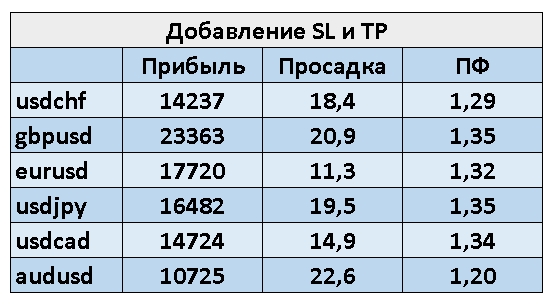 In a number of cases, final profit increased, the profit factor grew, and drawdown decreased. We can add exit rules. There will be quite a lot of them: exits after highly volatile days, and exits by indicators such as Stochastic, ADX, WPR, CCI, and even by the crossing of moving averages.
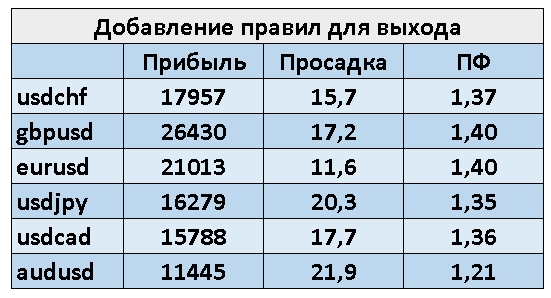 And again a more attractive result was achieved. Let us add several trailing stop options: by BollingerBands, by a moving average, by ATR, by the shadows of candles, and an ordinary move to breakeven:
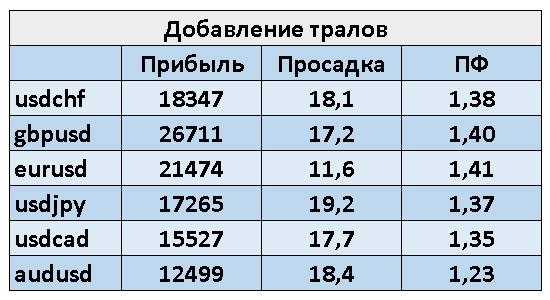 The results improved slightly. And finally, let us add the application of the TDW pattern: we will allow or prohibit trading on certain days of the week:
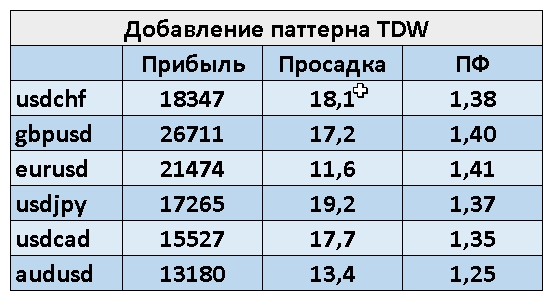 This pattern brought almost no changes. Apparently, the system parameters are already quite optimal as they are. Let us look at the final-result test results for each of the currency pairs:
AUDUSD:
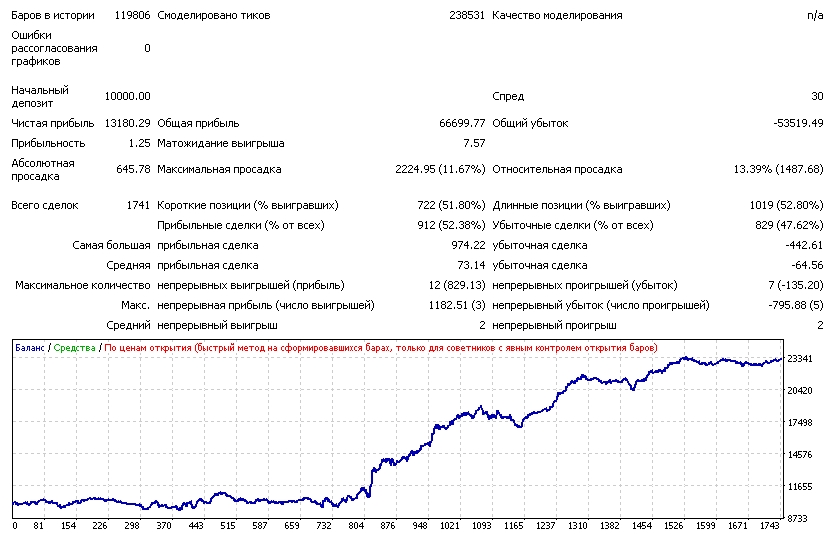 The application of the pattern on this currency pair is not efficient enough for its use in real trading.
EURUSD:
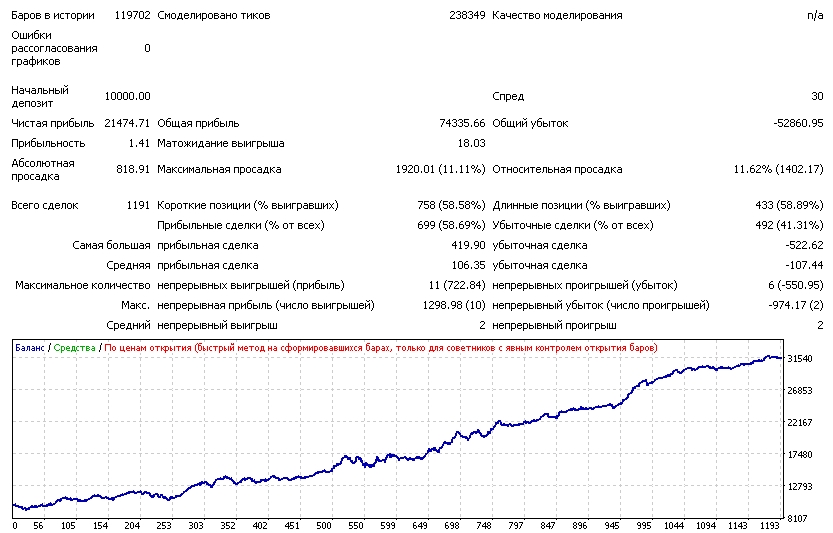 The application of the pattern on this currency pair showed efficiency sufficient for use in real trading.
GBPUSD:
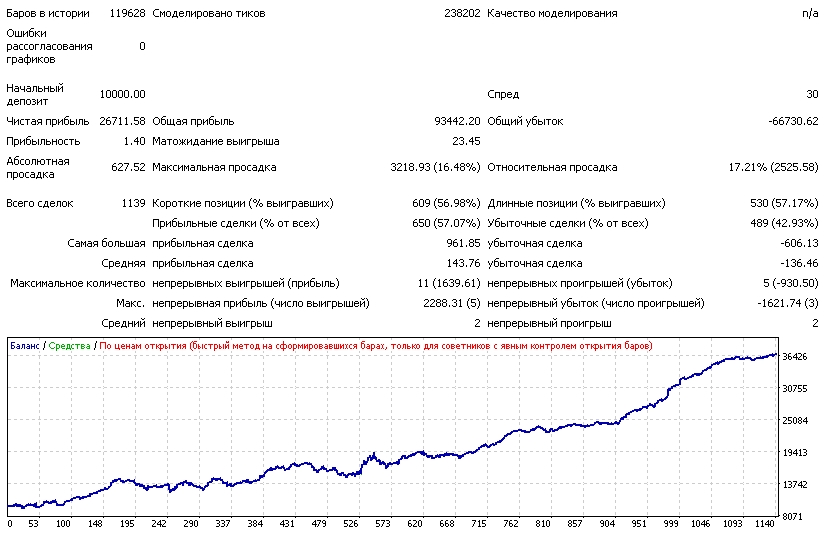 The application of the pattern on this currency pair showed efficiency sufficient for work in real trading.
USDCAD:
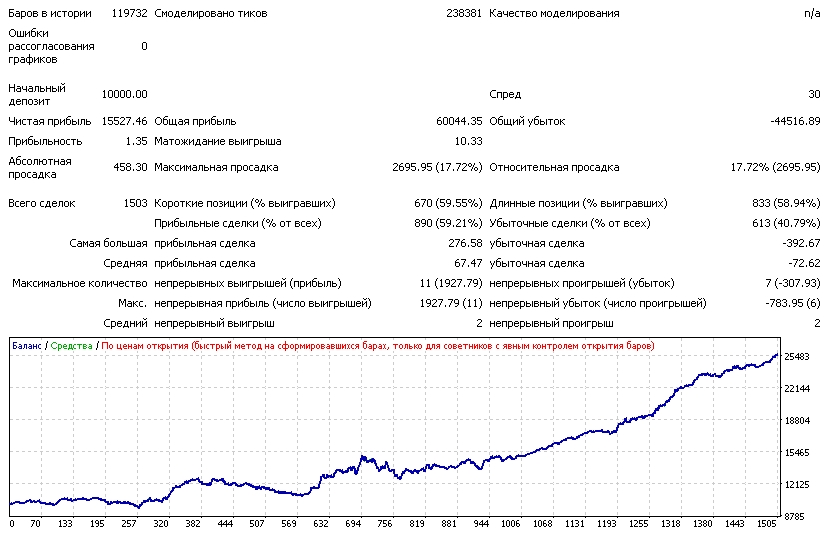 The application of the pattern on this currency pair showed efficiency sufficient for use in real trading.
USDCHF:
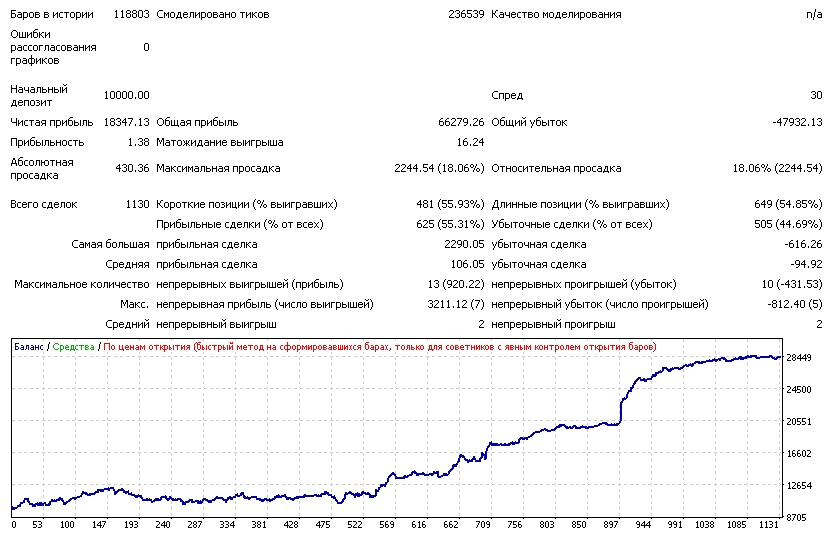 The application of the pattern on this currency pair is not efficient enough for it to work in real trading.
USDJPY:
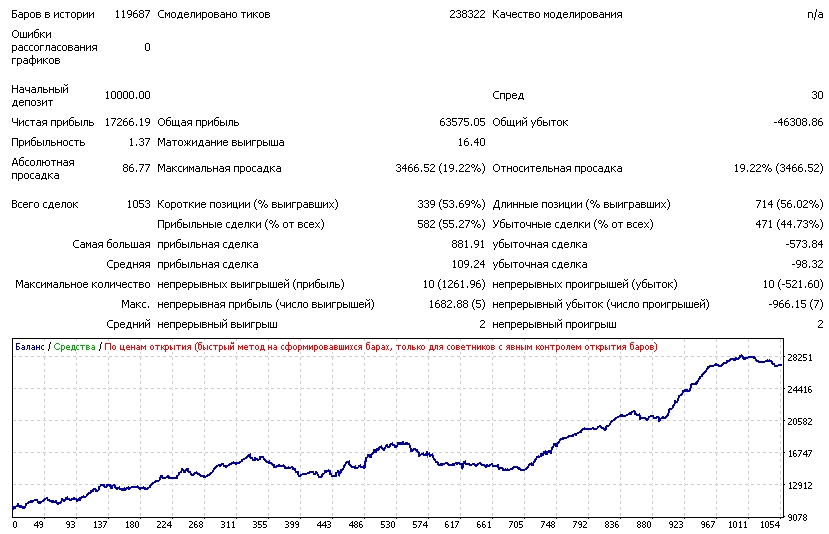 The application of the pattern on this currency pair is not efficient enough for its use in real trading.
And, traditionally, let us look at the combined test:
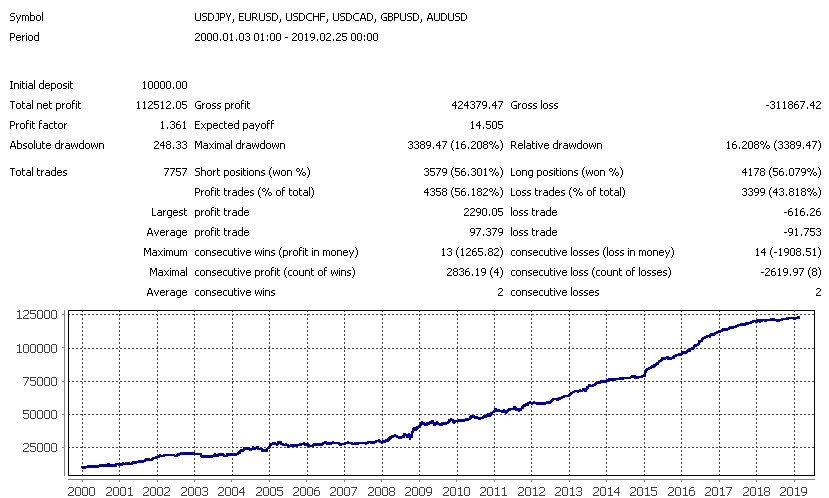 With some stretching, this trading system can be called quite suitable for trading. The picture is badly spoiled by a rather high drawdown, which in real conditions may well grow to 25%. At the same time, the final amount of profit is not so large.
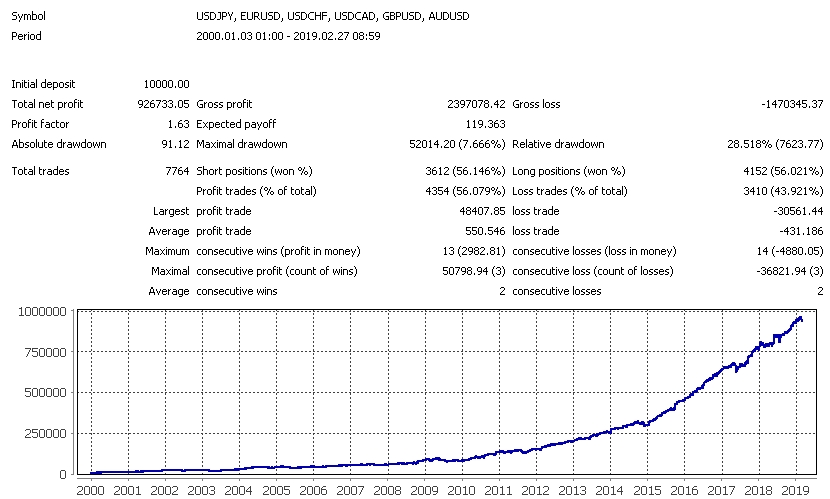
I know that many people really love using martingale to drain their deposits, so in order for my research not to be so boring, I tried to test the pattern using a soft version of martingale. Its meaning is that it turns on after 2-4 losing trades and turns off after a certain series of wins, even if the advisor has not yet managed to get out of drawdown. Unlike less intelligent variants, this one allows the deposit to survive noticeably longer. I did not optimize the settings too carefully, I set the first more or less attractive results. Let us, for entertainment purposes, see what we got:
Conclusion

Today we saw that the TDM pattern works and is quite capable of bringing profit. TDM and TDW patterns are especially relevant as filters for existing profitable systems. They can significantly improve trading results.
It would be quite difficult to find out the reasons for the operability of these setups, since it would be necessary to sort out the numerous nuances of macroeconomics, thoroughly study the work of banks, funds, and other large currency players. But we do not need that, it is enough that this inefficiency is really present in the markets of most currency pairs. And that means it should be used if your goal is to make a profit.
Download the expert advisor used in the article
 Respectfully, Dmitry aka Silentspec
TradeLikeaPro.ru
Respectfully, Dmitry aka Silentspec
TradeLikeaPro.ru