
System Creator: an army of robots without getting off the couch

Hello everyone! Today we continue the article series that covers the topic of algorithmic trading. Many of you have more than once thought about how to trade while lying on the couch, using automatic trading systems at the same time. But you were surely stopped by the fact that for this you need to study a programming language, and it is not that simple and you will have to get up from your favorite couch. This time we will talk about how to write robots without knowing any programming languages. No, you will have to get up from the couch, but for a rather short time, just to get acquainted with this lesson.
I will tell you about the magical System Creator program, which will let you write robots without programming knowledge, registrations, and SMS! The program is unclear and unfamiliar at first glance, so I myself will describe in detail what, in what order, and exactly how you need to click so that the money starts rolling in. So, let's begin.
Program Interface
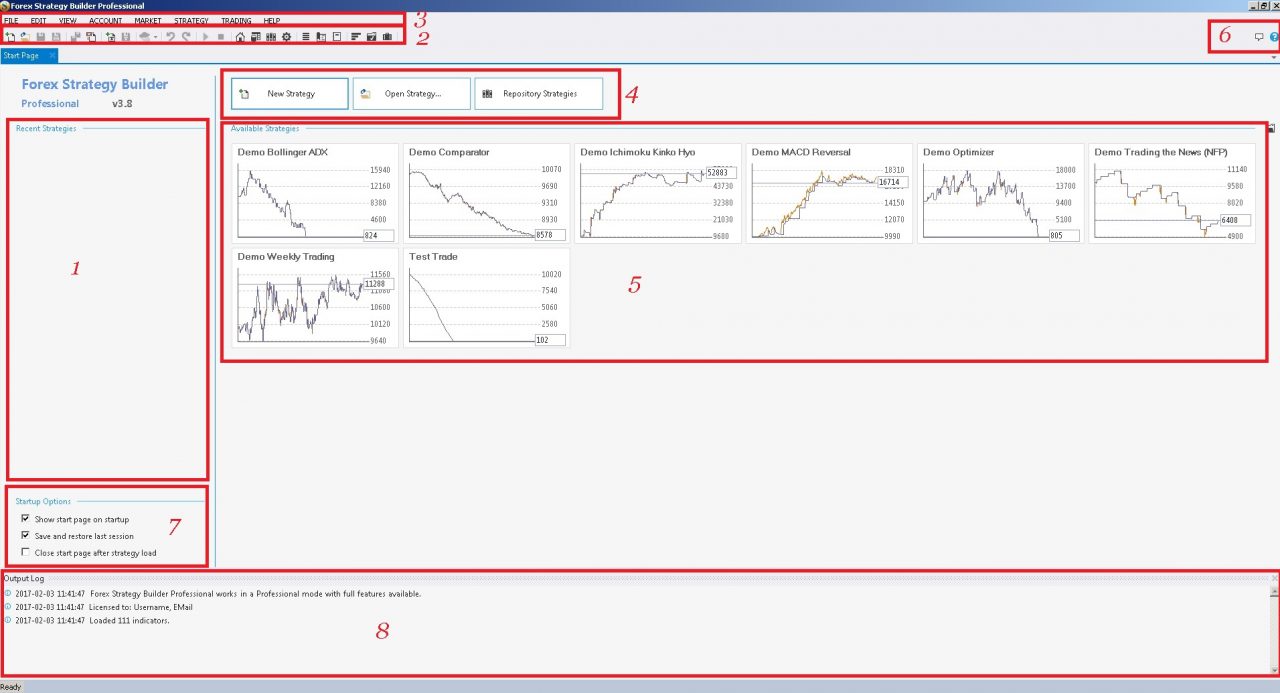
When you launch the program, the start page opens. Field 1 is intended for quick access to your previously saved strategies. Naturally, on the first launch it will be empty. Field 2 is the working tools ribbon. In addition to the options for creating a new strategy, saving, and closing the current one, here you will also find a button for exporting your strategy directly to the MT4 terminal as a ready-made expert advisor with open code, which you can edit if you wish (add trailing stops, money management options, and so on). But, of course, getting up from the couch once again is not necessary, everything will work fine in its current form as well.
Also on the left side of the ribbon you can see buttons for various tools, which we will discuss below. Menu (3) contains drop-down lists of various tools and settings, but so as not to overload your head right away, we will also leave them for later. But field 4 is quite interesting. It contains only three buttons: New Strategy (creates a new strategy, clicking it opens the corresponding window), Open Strategy (opens a window with your ready-made strategies), and Repository Strategies (opens a window with a long list of demo strategies from the program authors' site).
In field 5 you will find ready-made demo strategies. In field 6 you can find the program help, in English, of course. Field 7 contains three checkboxes. The first lets you disable the start window on subsequent launches, the second is responsible for autosave, the third lets you automatically close the start window when the user opens the required strategy. And field 8 is the log, an analogue of the log in the terminal. All messages about actions taken by the user, errors, and other information are written here.
Preparation for Use

Many of you do not know foreign languages all that well, so let us immediately switch it to our native one and continue working in the Russified version of the program. To do this, in the main menu click VIEW -> Language -> Russian:
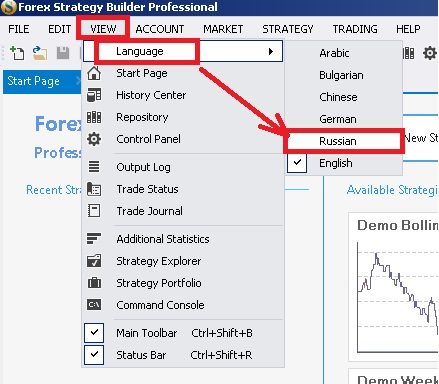
Below the ribbon, the message "Language was change" and a recommendation to restart the program will appear. That is what we will do, after which everything will already be in Russian.
Basic Account Settings:
Click the "Account Settings" button
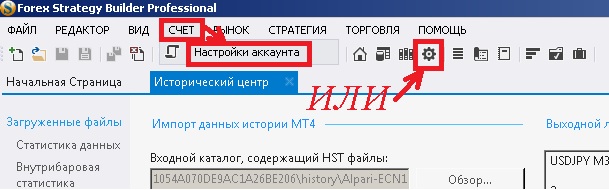
A window with settings opens:
- Create a new profile:
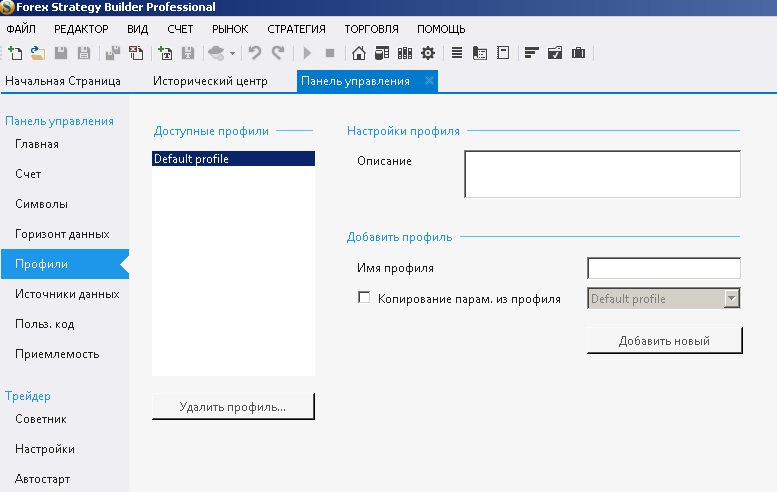
To do this, enter the name in the Profile Name field and the description in the Description field, respectively. Click the Add New button.
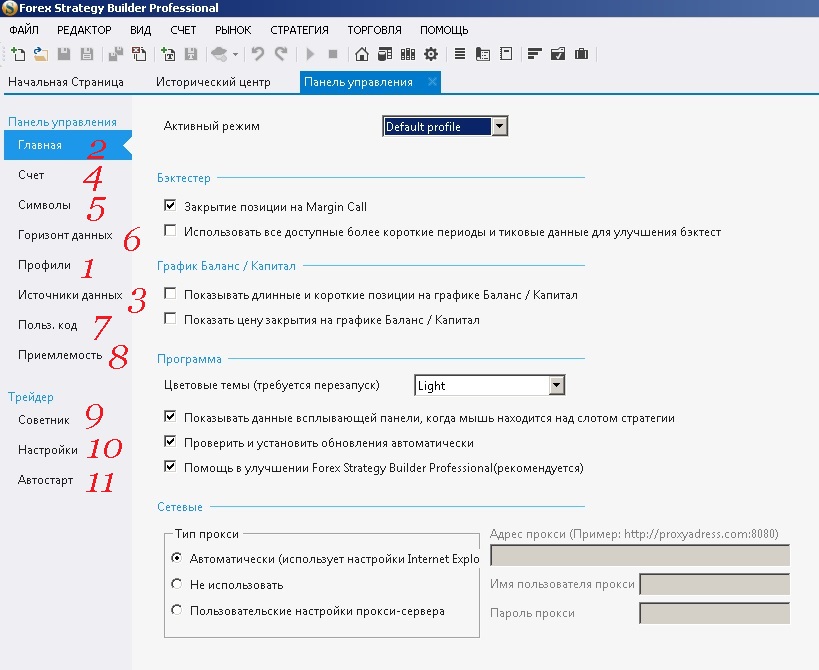
- Next, go to the Main tab:
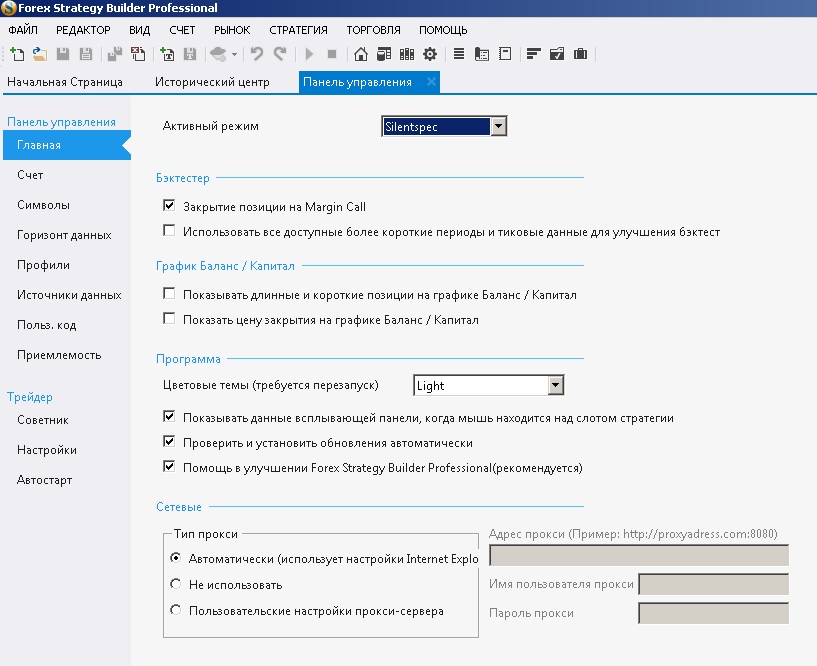
Select Active mode as our newly created profile.
Backtester field.
There are two options in the backtester field. The first emulates closing positions by margin call, the second allows using shorter periods for testing. That is, if your strategy works on H1, M1 data are used for the test. Definitely, in both cases we check the box.
Balance/Equity Chart field

Also two options. The first allows drawing on the balance chart a separate growth curve for long positions and for short ones, in addition to the main growth line. Remember that a quality strategy should be balanced, which means growth from buys should not differ too much from growth from sells. We check the box because this information is useful. The second option displays the asset chart (closing prices) on the growth chart.
Program field.
Here you can choose the program color scheme, enable pop-up hints, enable automatic program updates, and sending error reports.
And the last field, Network settings, makes no sense to touch if you do not use a proxy.
- Data sources
Next, click the "Data Sources" button in the left menu. Here we need to create our own source of historical data:
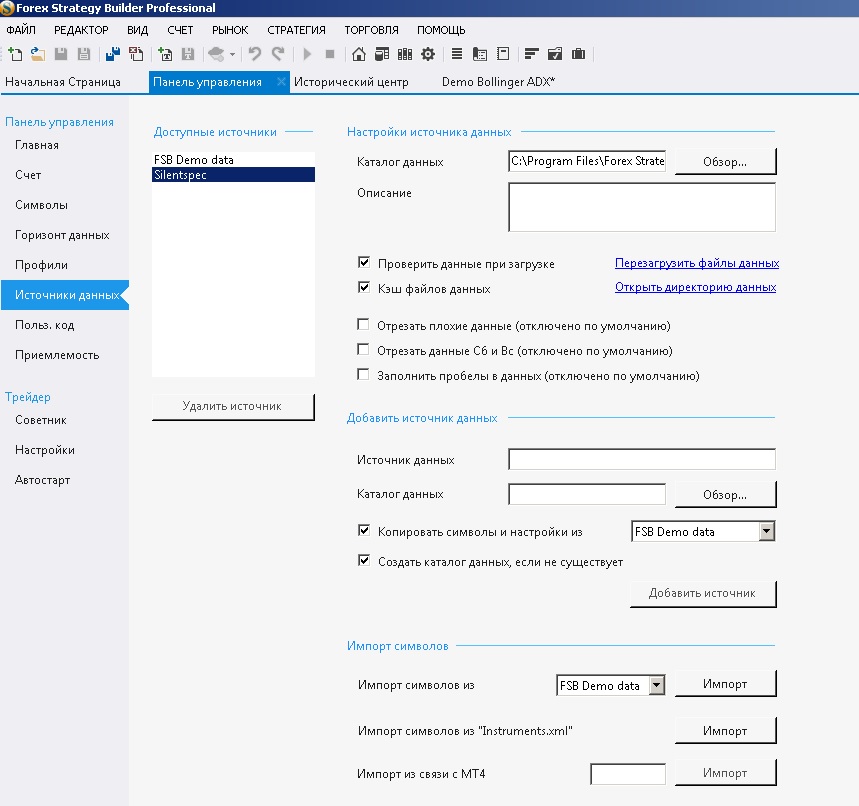
Find the Add data source field, type its name into the Data source field, and choose a catalog for storing the data. Leave everything else unchanged and click the Add source button. A new data source will appear. You can import a list of symbols into the data source from an existing source, from a special Instruments.xml file (which must first be created), or from the MT4 terminal, but that does not interest us. In the data source settings field at the top you can change the path to the folder containing the historical data, add a description of the data source (for example, the name of the source they were downloaded from, Alpari-ECN, for instance). I advise not touching the other checkboxes.
- Account settings
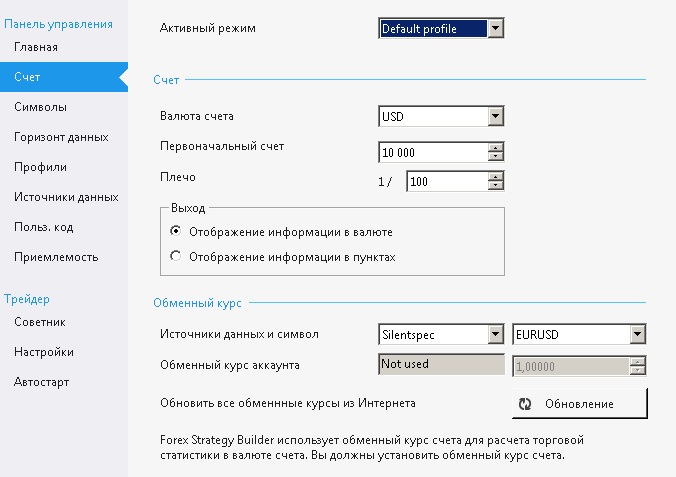
Select active mode again and configure the characteristics of the virtual account. As the account currency, you can choose US dollars, euros, pounds, and yen. The initial deposit is set to 10,000 units by default, and the leverage is 1:100. You can choose in which units to display all trading statistics, in points or still in the deposit currency. And the last field is the account exchange rate, it serves for the correct calculation of trading statistics when using various currency pairs for trading. Here you just need to click the Update button and the rates will update automatically.
- Symbols
On this tab we can add all the symbols for which we have historical data:
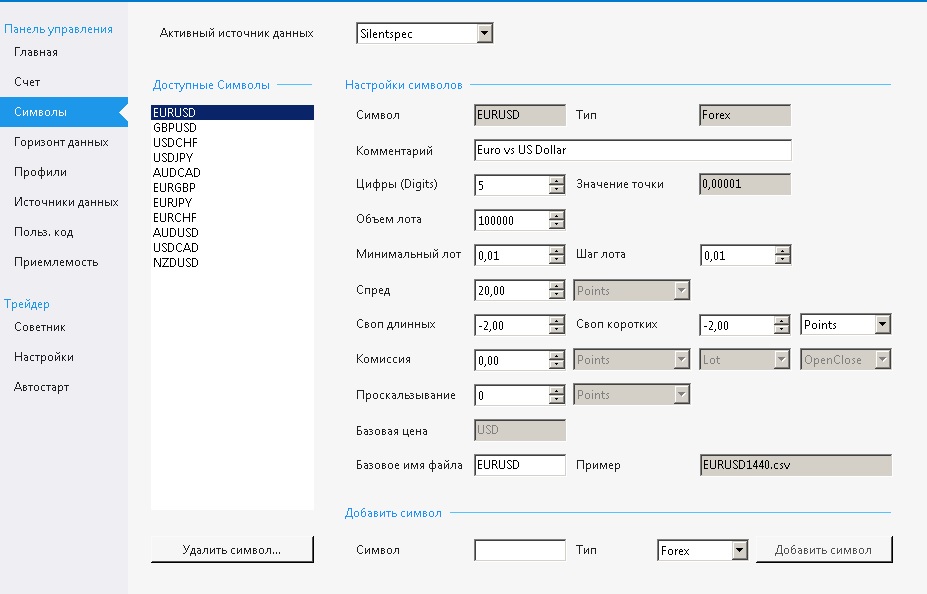
To do this, in the symbol field enter the symbol designation in Latin letters, as in the MT4 terminal without suffixes and prefixes, and click the add button. If the instrument does not belong to the Forex market, you can choose the instrument type Index or CFD. Click the add button and the symbol appears in the available symbols field. Do the same for all your instruments.
Next, set the number of digits after the decimal point, but as a rule, they are immediately set correctly. The same applies to the maximum and minimum lot, as well as the lot increment step. I advise setting the spread to the average from the terminal, and the swaps can be viewed on the broker's website. Do not forget to choose in which units the swap is indicated, in points or in money (as a rule, the swap is indicated in points).

If a commission is charged for trading on your account, you need to indicate this. Again, do not forget to specify in what: in points or money, per lot or per trade, on opening and closing or only on opening the position. As a rule, if a commission is charged at all, it is charged in money, per lot, on opening and closing. That is, for example, 7.00, in money, lots, opening-closing.
You can also specify the average slippage to bring the test results closer to real conditions. Trades on a live account are often opened with slippage, especially on volatile instruments. Accordingly, you can specify a couple or three old points for slippage.
- Data horizon
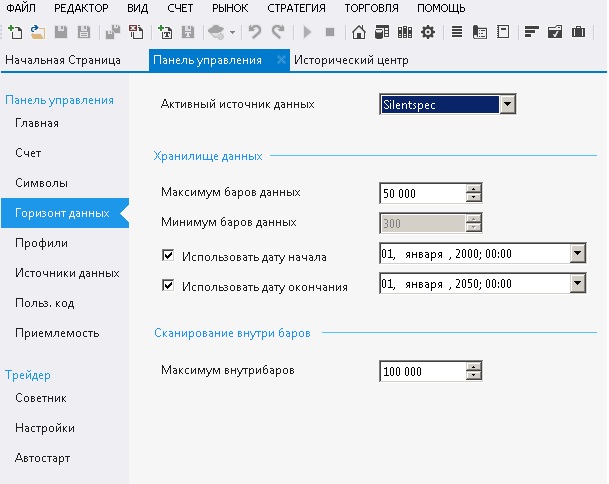
Here we can specify the maximum number of data bars (maximum 50 thousand) and ticks inside the bars (maximum 100 thousand). Unfortunately, the limitations are very strict, but for generating strategies for periods from H1 and higher it will basically do. You can also specify the start and end date, but it will again be cut off.
- Custom code
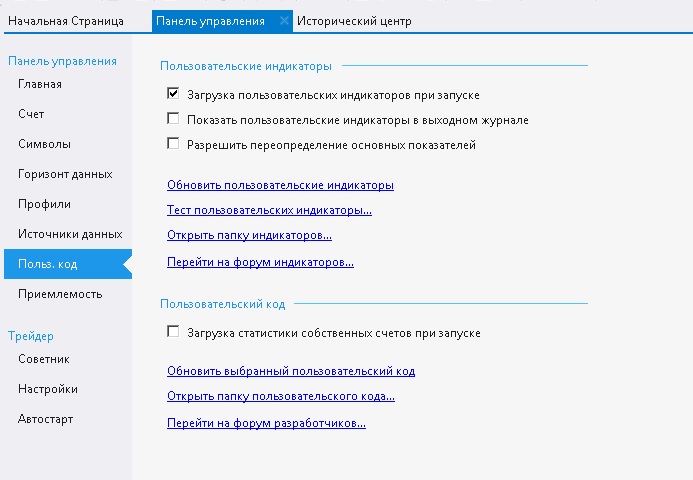
This tab is quite interesting, we will dwell on it in more detail. First of all, I recommend checking the top three boxes. First, click the inscription "Go to the indicators forum" and go to the forum of the program authors' site, to the thread devoted to questions about indicators. If you click the Repository button in the top menu, we will go to the repository of many ready-made strategies, indicators, and add-ons for the program. We will write the strategies ourselves, the add-ons do not interest us for obvious reasons, but downloading new indicators into the program is just right. When you click the link to the indicator page, you will go to the download page:
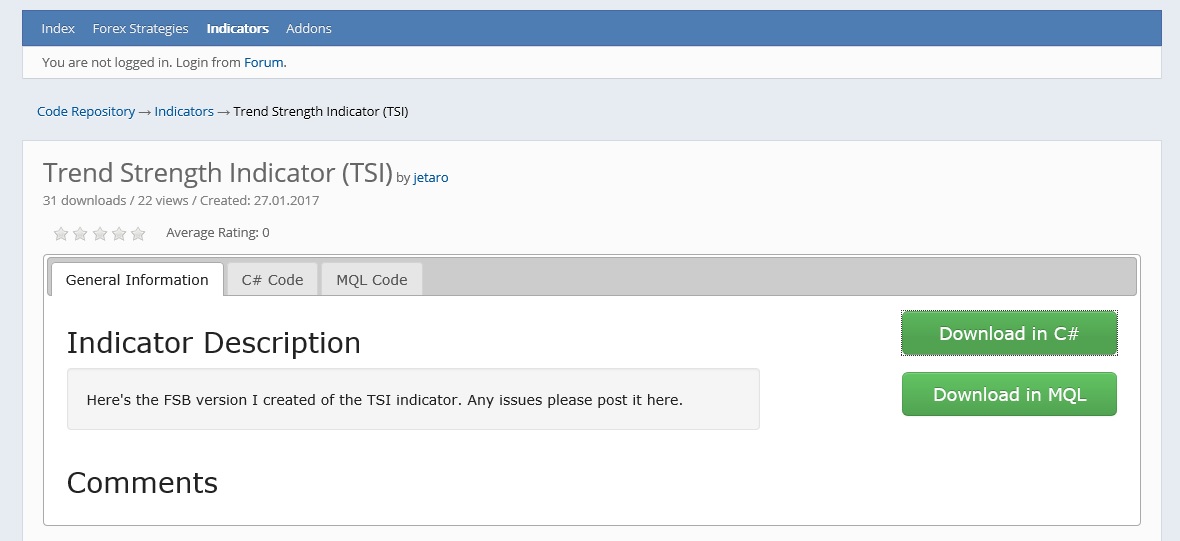
In front of you there will be three tabs: basic information on the indicator (as a rule, download links and sometimes a description of the indicator), as well as two tabs with code. In them you can view and study the indicator code without downloading it. Indicators for the program are written in C#, have a very simple structure, and anyone who wants, provided they know the same mql4, will be able to master the writing technology in a couple of hours (and if not, shout in the comments to the lesson and I will record an additional explanation). We need both indicator files, both the C# version (for use in the program) and the mql4 version (for subsequent use in the MT4 terminal together with the resulting advisor).
Then click the Open indicators folder button in the program and carefully put everything you downloaded there. Since we have found ourselves in the User Files/Indicators folder, let's go up one level and study the contents of the User Files folder:
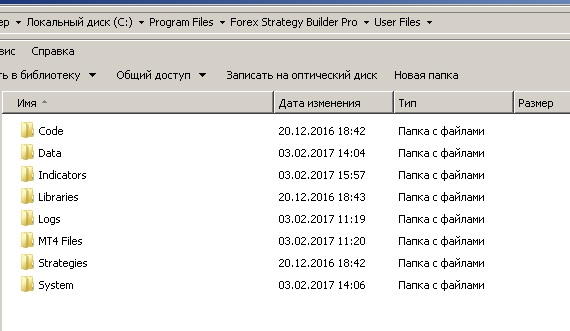
The Code folder stores all add-ons for the program. By default, there is only the AccountStatistics file there, written in the same C# (you do remember the article about algo trading, where I urged you to learn programming languages). This file can be corrected by adding the trading statistics you think are missing (for example, some tricky coefficients named after you). But we did not study programming at school and we are not going to get up from the couch for that, so let's move on. The Data folder stores all our historical data in csv format. We will load it there a little later, but for now it is empty.
We have already dropped the indicators downloaded from the site into the Indicators folder, and if you want to remake a custom indicator from MetaTrader for the program, you need to put it right here. The next folder, Libraries, contains compiled indicators in the form of libraries with the dll extension. The Logs folder contains all the messages from the program log, similar to the MT4 terminal. The MT4 Files folder contains the advisor and the Bridge Installer. This file installs a special bridge on the selected MT4 platform so that you can trade advisors directly from the program.
The next folder, Strategies, contains strategy files, including those created by you. If you decide to download not only indicators from the site but also a couple of strategies, you need to place them right here. In the System folder you can find the Languages folder. Here, if you wish, you can create another xml file with a translation into any other language, Elvish, for example, or the language of the proud peoples of the north. You can also find the Indicators_abbreviation file, which contains the names of the standard indicators. You can rename them with some swear words too. In the System folder itself there are files written in Java. These are both the color themes of the program and all the main modules, which can be edited and supplemented to your taste if, of course, you know what needs to be done.
For our downloaded indicators to appear in the program, click the Refresh custom indicators inscription and they will be read by the program and recompiled from cs format (open code) into dll format and moved into the corresponding folder (the source code will remain). This may take some time, but as a rule, no more than a minute; it all depends on your greed (the number of indicators downloaded from the site).
- Acceptability tab
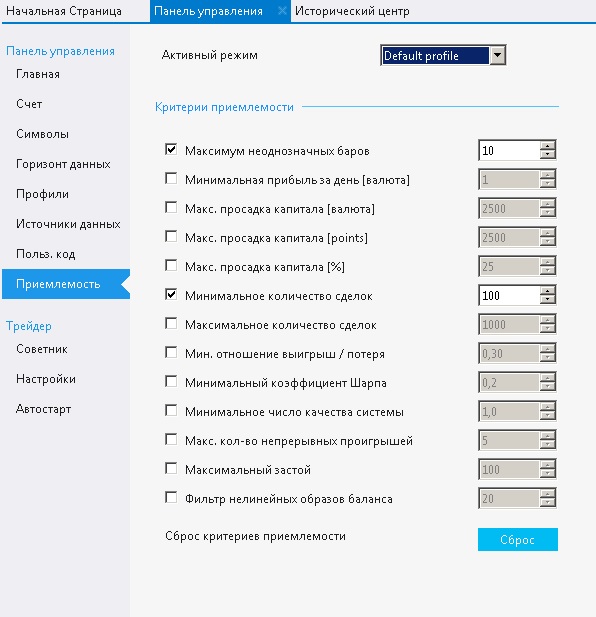
Here you can set some restrictions for the trading strategy generator. All the settings are named quite unambiguously, so I think they do not require explanations.
- Advisor tab
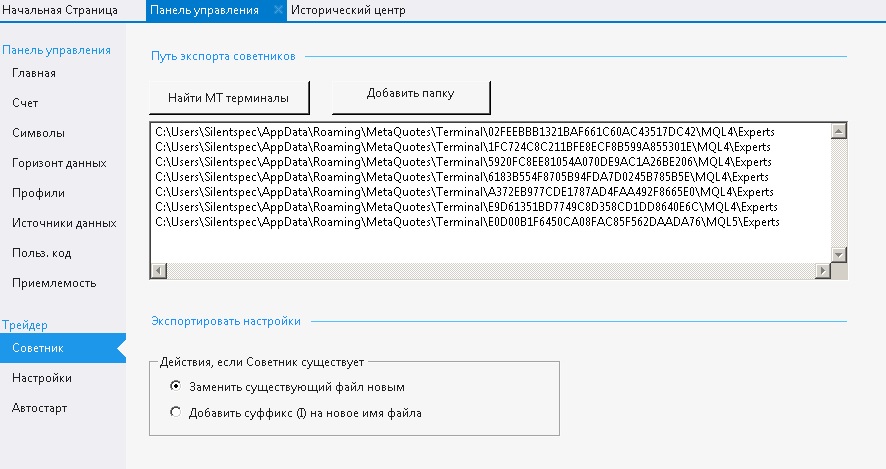
On this tab the path to the MT4 terminals is set, the export of trading advisors will be performed into these folders.
- Settings
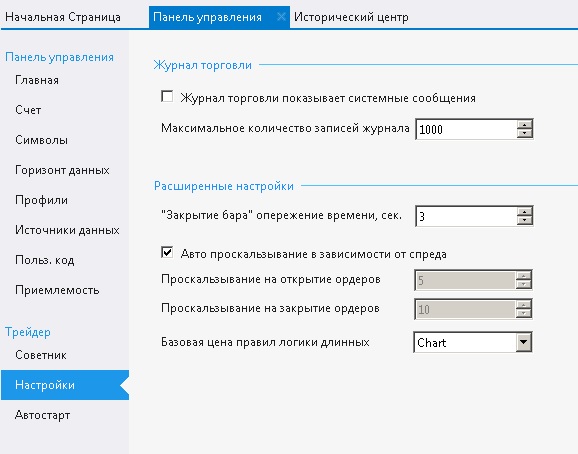
On this tab you can configure the slippage properties and the number of messages in the trading log. The "bar close" time lead lets you enter a few seconds before the bar closes, because the first tick on a new bar may not arrive immediately, but after some undefined time. The auto-slippage option depending on the spread allows you to emulate the amount of slippage depending on the current volatility: if the market is calm, there will be no slippage. Another option is that you can configure the amount of slippage yourself by unchecking auto-detection.
- Autostart tab
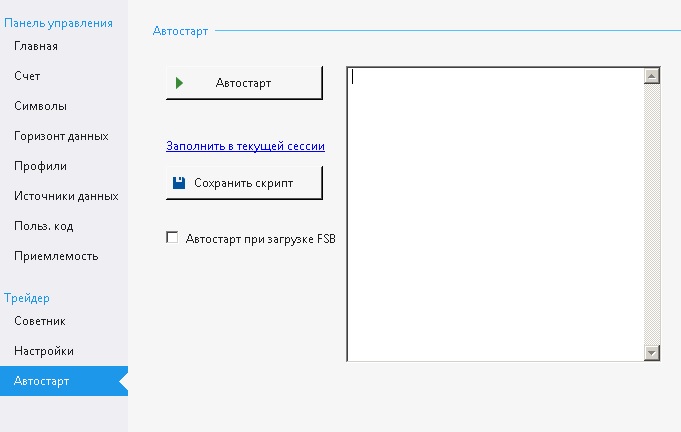
The autostart tab lets you configure automatic startup of the program and the terminal for trading with expert advisors. It is enough to enter the names of the strategies to launch into the white field, save the script and press the start button. And do not forget to place the program into startup.
Loading historical data
To create a strategy, it has to be tested on some data. That is what the Historical Center tool exists for:
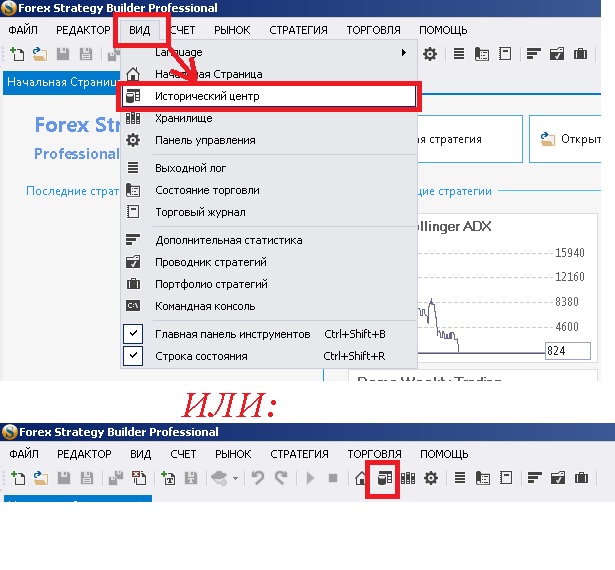
After pressing the button, a new Historical Center window will appear.
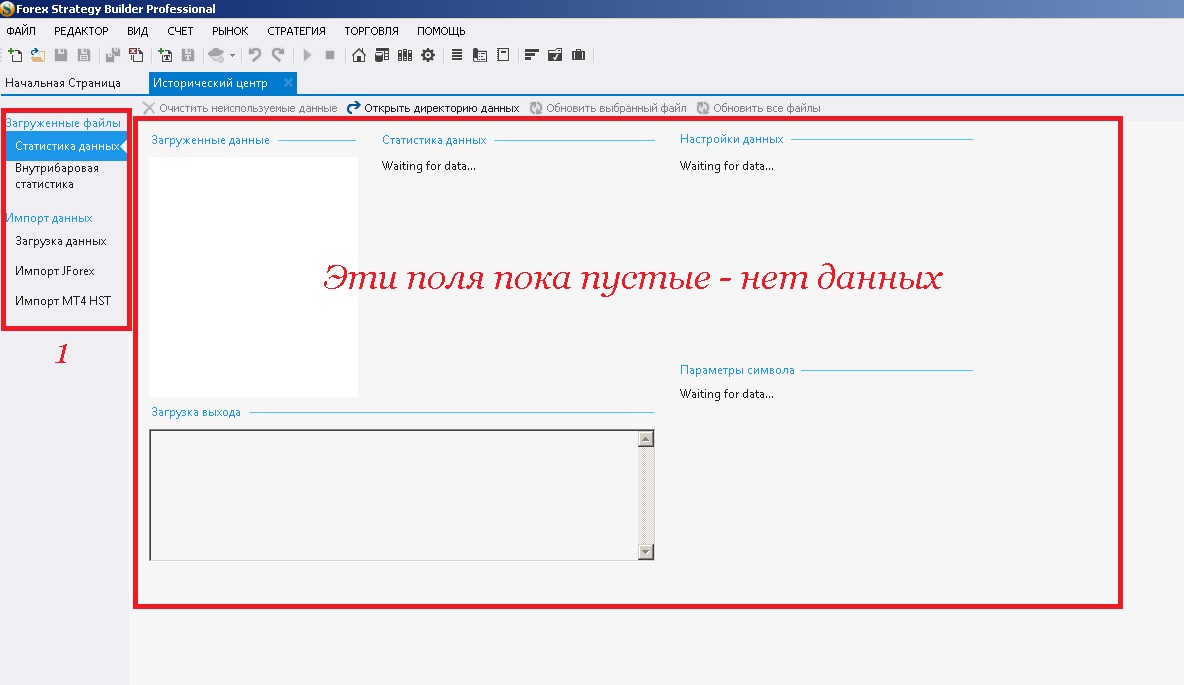
At the first stage we need the left menu (1), namely the Data import field.
Three options are provided:
Loading data from the program authors' website:
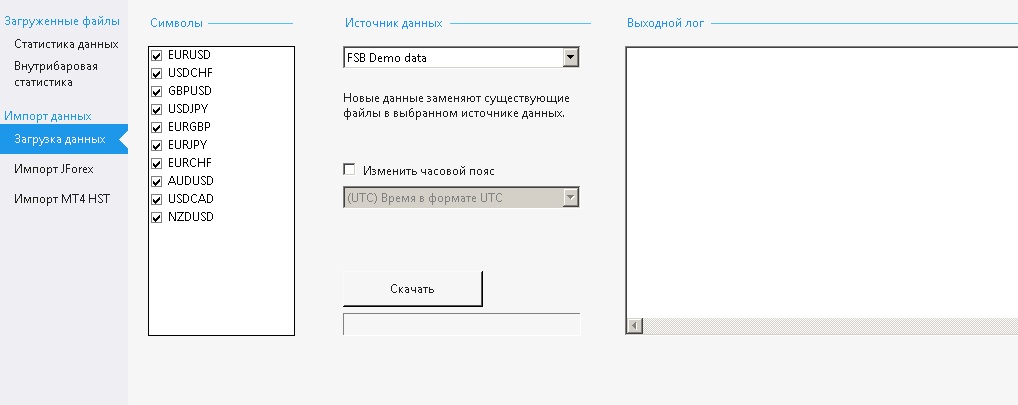
The choice of instruments is limited, and the quality of the quotes is not exactly terrible, but it still leaves much to be desired. To download, choose the currency pairs you need, the data source, change the time zone if required, and click the Download button. Then watch the process in the Output log window until it finishes.
The second option is loading trendy Dukascopy quotes:
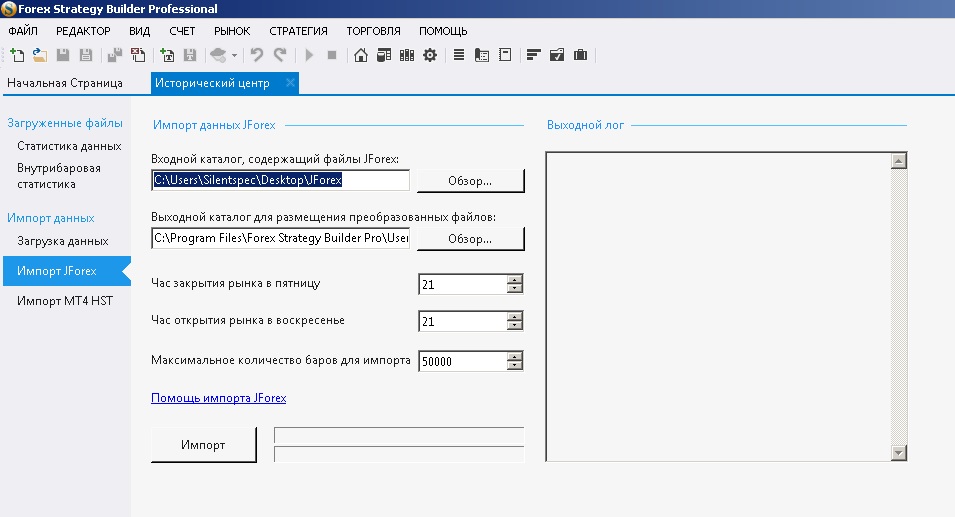
The quotes must be downloaded in advance by the program you usually use to download them. You need to specify the path to the folder where they should already be stored, and the path to the folder where the program will neatly put them. You can specify the market opening and closing hours on weekends. You also need to specify the maximum number of bars for import; it is programmatically limited to one million bars.

Then we press import and watch how events unfold in the Output log window. And one more thing. There will be no ticks in the program, it will create minute quotes in csv format from Dukascopy ticks and that is all. I am not a supporter of Dukascopy quotes, and I do not recommend them to you either. Besides, minute bars from Dukascopy ticks turn out very holey.
And the third option, the most worthy one, is importing quotes from your terminal for testing (after all, that is where quotes of excellent quality are most likely stored):
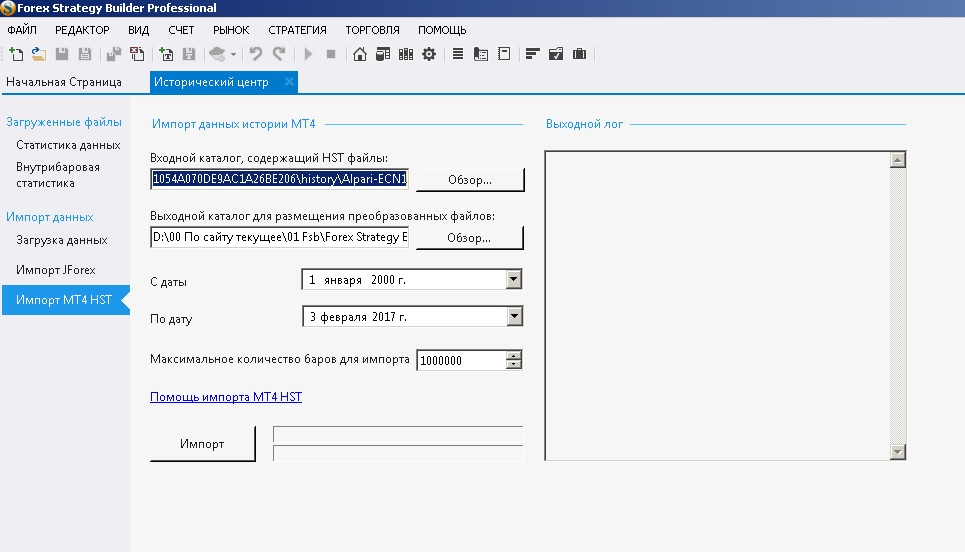
We set the path to the historical data, this is the folder of the terminal data directory -> history -> the name of the server to which the terminal was connected, in my case this is the Alpari-ECN1 folder. For those who do not know, step 1 is open the terminal, File menu -> open data folder:
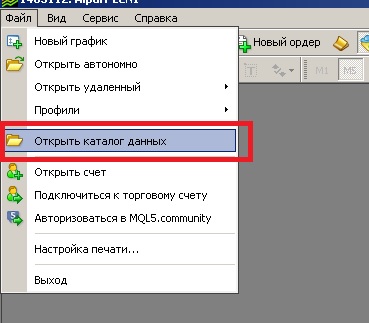
Then an explorer window will open:
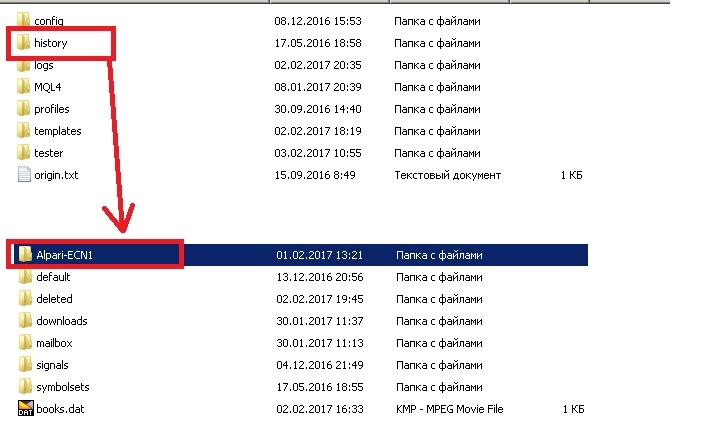
That is all. Next we choose where to save our quotes, from what date to start the import and when to stop, and also the maximum number of bars. No matter how hard you try, the program cuts off part of the history, leaving the last million bars. This is, of course, a significant minus, but on the other hand, it will be possible to test the strategy in more detail later in the native MT4 terminal. In the terminal you first need to check whether the entire history for all instruments is there, and if something is missing, download it in advance. So, we specify the paths, set 1 000 000 bars and press start. Import usually takes from 10-15 minutes to several hours depending on the number of instruments and the depth of the historical data. And you can watch the import progress in the Output log window.
- Data statistics
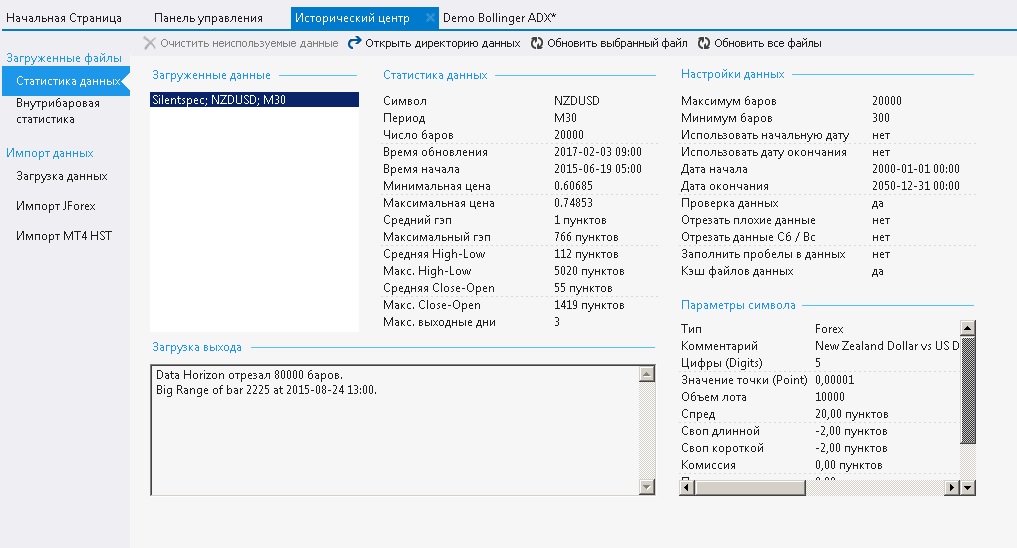
Data is loaded here only when it is used in your strategies. When you have created a strategy, say, on hourly EUR/USD charts, you can go here and view statistics on the quality of the quotes used for the strategy test, for example, the total number of bars in the history and the start and end dates of the quotes, the minimum and maximum prices for the period, the average and maximum candle lengths from high to low and from open to close, and the average gap size. Here you can also view general data for the data as a whole and some symbol parameters, such as spread, swap, and so on.
- Intrabar statistics

And the last tab of the Historical Center tool is intrabar statistics.
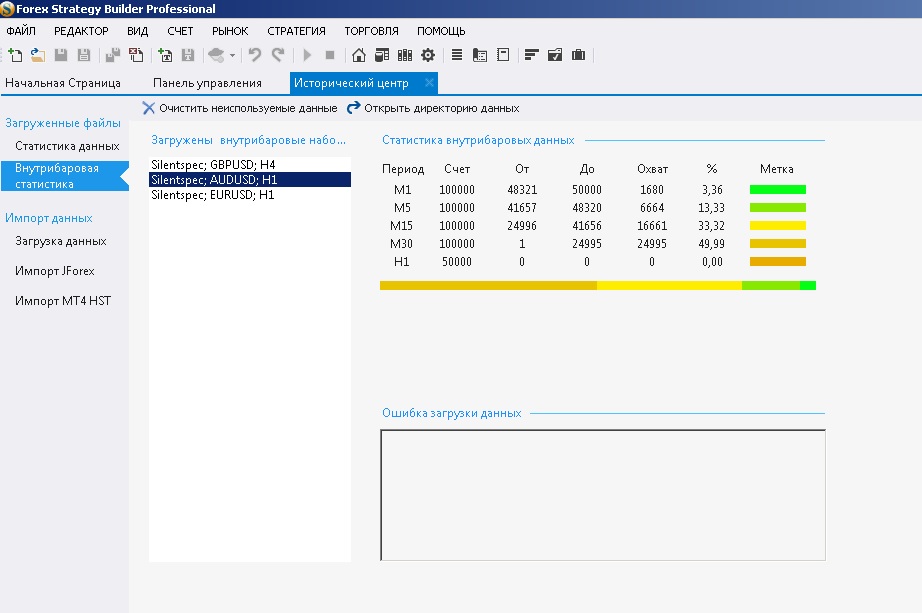
This is analogous to the status bar when testing in the MT4 terminal. It shows which periods and how many bars of each period were used when testing the strategy. For the strategy on H1, judging by the screenshot, not a single H1 bar was used. As you remember, the limit on the number of bars in the test is 100 thousand, so the first 100 thousand bars of the minute period were taken for testing, then M5 was used, when those ran out we used M15, and so on. If holes had been found in the quotes or one of the periods had failed to load properly, we would have seen a message in the Data loading error field. Therefore, looking here after testing is sometimes useful.
Creating a new strategy

Everything is configured and ready to work, so let us move on to the most interesting part, create the first strategy. To do this, on the ribbon click the New strategy icon and we will see a new window:
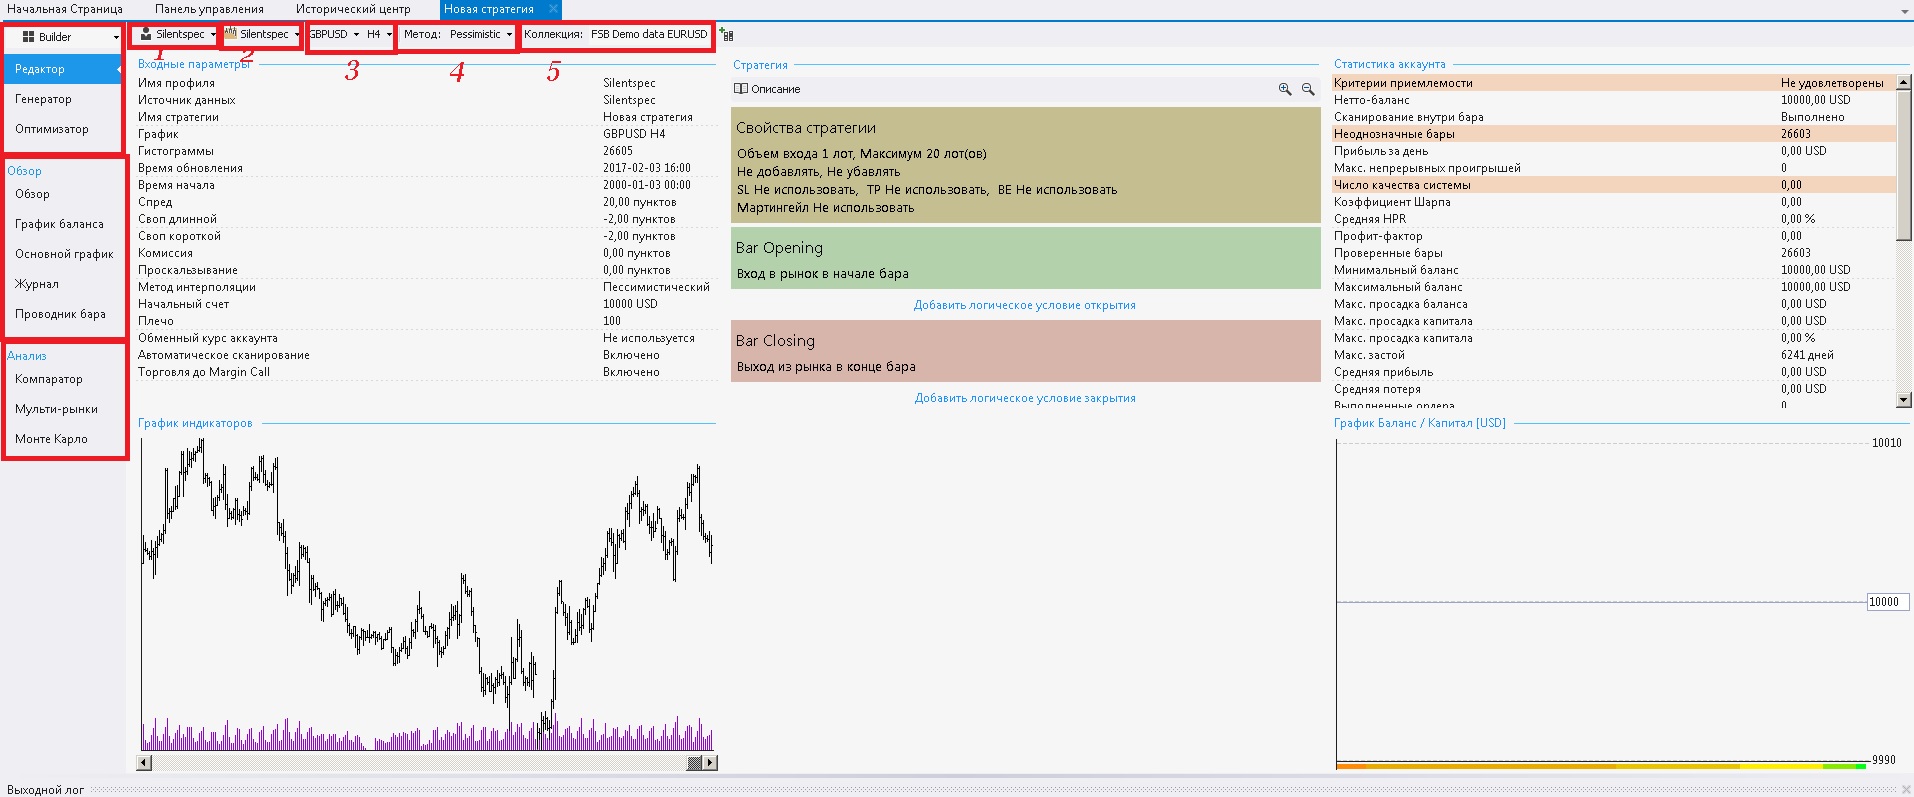
- Select our created profile.
- Select the source of historical data
- Select the preferred instrument and timeframe
- Select the preferred interpolation method (read: testing quality).
- Collection. You can add the strategy to a collection; later you will find your strategy in the repository.
A few words about interpolation methods

Suppose you opened a position at the beginning of a new candle and the stop and take levels ended up inside it. With a pessimistic approach, the stop loss is triggered first, with an optimistic one the take profit is. The Shortest method will close the trade by the nearest route based on movement on lower periods, if they are available. That is, a route of price movement inside the bar will be developed and the trade will be closed by stop or take depending on what the price encounters first on the way. The Nearest method will close the trade by stop or take depending on which level is closer to the entry price. And the Random method will close the trade randomly.
Basic settings
By clicking the New Strategy tab, you will see a drop-down menu:
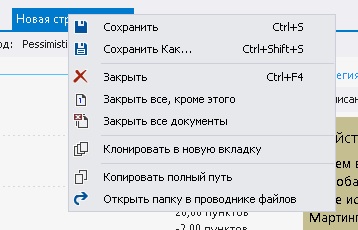
From this menu you can save the strategy and give it some name. The name of the tab with the strategy will then change. From the same menu you can, for example, close the tab, close all tabs, open another identical tab, and so on.
On the left you see a menu with three tool panels. The first relates to strategy generation, the second allows you to analyze a finished strategy, and the third to carry out stress testing. In the main window you see several fields: input parameters, indicator chart, strategy, account statistics, and balance chart. Many fields are still empty for now. In the Input parameters field you can check the main settings used, such as spread size, swaps, leverage, starting balance, slippage, and so on. In the indicator chart field are all the indicators used by the system. The main trading statistics will be displayed in the Trading Statistics field, and deposit growth can be assessed in the balance chart field.
But the most interesting part is in the Strategy field. Here are the conditions for entering and exiting positions, as well as the money management settings.
First, let us click the Strategy properties: button
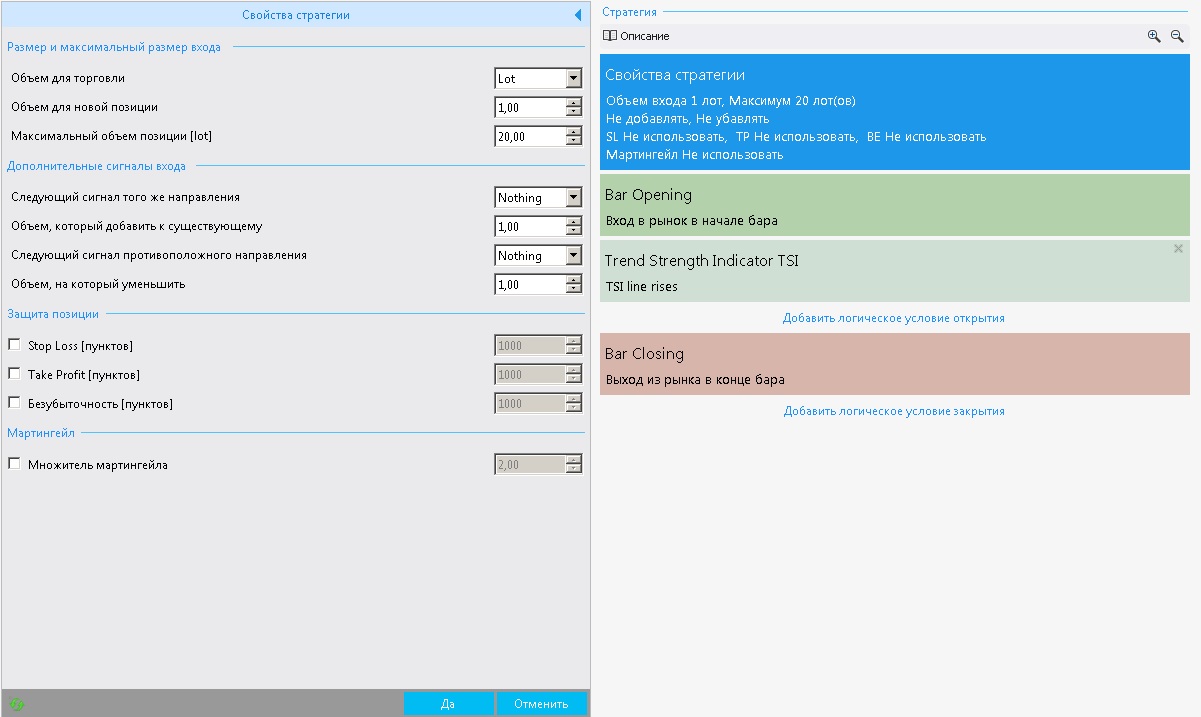
In the size and maximum entry size field there are three settings. The trading volume can be set as a lot or as a percentage. In the first case, trading will be carried out with a fixed lot (Volume for a new position); in the second, you can set the risk as a percentage of the deposit (again, Volume for a new position). You can also limit the maximum volume of all simultaneously open positions.
The next field is Additional entry signals
New entry signals often appear after a position has been opened. So, the options in this field determine what to do with them. For example, when the next signal of the same direction appears, you can do nothing, add another position with the same volume or with any other volume (you can set it), add to the position only if the current trade is in profit, and add to the position only if the current trade is at a loss (that is, build a grid). In the same way, you can handle the event of an opposite signal appearing. The available options in this case are: reduce the position size, close the position completely, close the current position and open a position in the opposite direction. Also in the following fields you can set a fixed stop loss, take profit, a move to breakeven, and a martingale multiplier for monkey lovers.

Below the strategy properties are the rules for entering and exiting a position. They are divided into four groups: entry point, entry logic, exit point, and exit logic. There can be only one entry point: the opening of a new bar, the start of a new day or a certain hour, a fractal breakout, and so on. Entry logic can include up to seven different filters. These can be various indicators or certain conditions, for example, again, a certain hour of the day. For exit conditions, it is all the same: one exit point and many filters (conditions).
By clicking the Add logical condition label for entry, you will get to the indicator selection window and its properties:
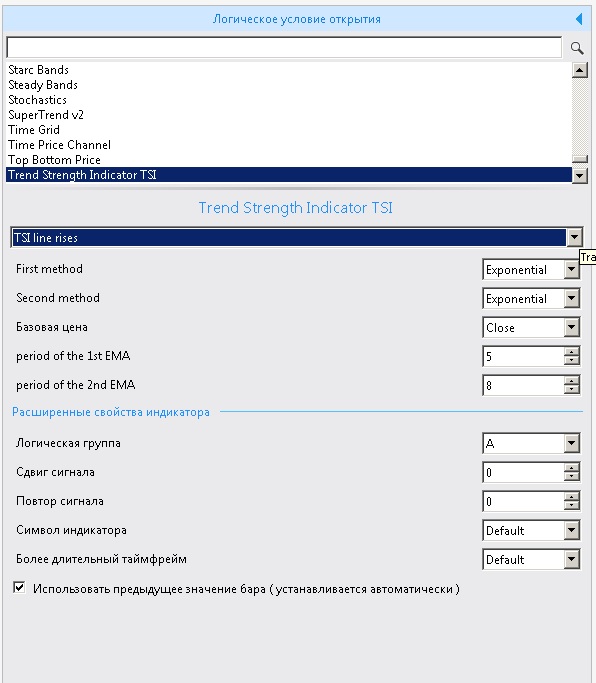
At the top all the program indicators are available, including those we downloaded earlier. Each indicator has its own settings, periods, prices for calculation, and so on, all the same as the indicators in MT4. But there is one difference: first, after choosing the indicator itself, you must select a signal from it in the drop-down menu.
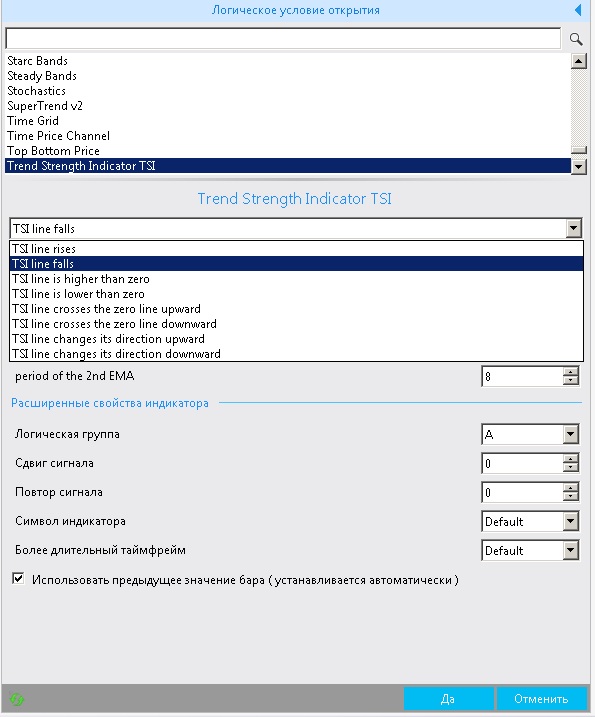
In my case there is a choice of 8 different options. All of them concern buy trades specifically (and it is the same for all the other indicators: all conditions are only for buying). For sells, the condition is simply the opposite.
By the way, the system can have several different options for entering and exiting a position, each of which contains several conditions from several indicators. The program uses such a concept as a logical group. A logical group is a group of conditions responsible for one specific event. When setting up an indicator, you can assign a letter designation to its group, for example, A. Thus, in group A, responsible for opening a position, there may be as many as ten indicators. The same goes for group B, also responsible for opening positions. As a result, you can create an adviser that trades according to two, three, or ten different strategies.
Thus, by combining various indicators and conditions for entering and exiting positions, you can build a trading system:
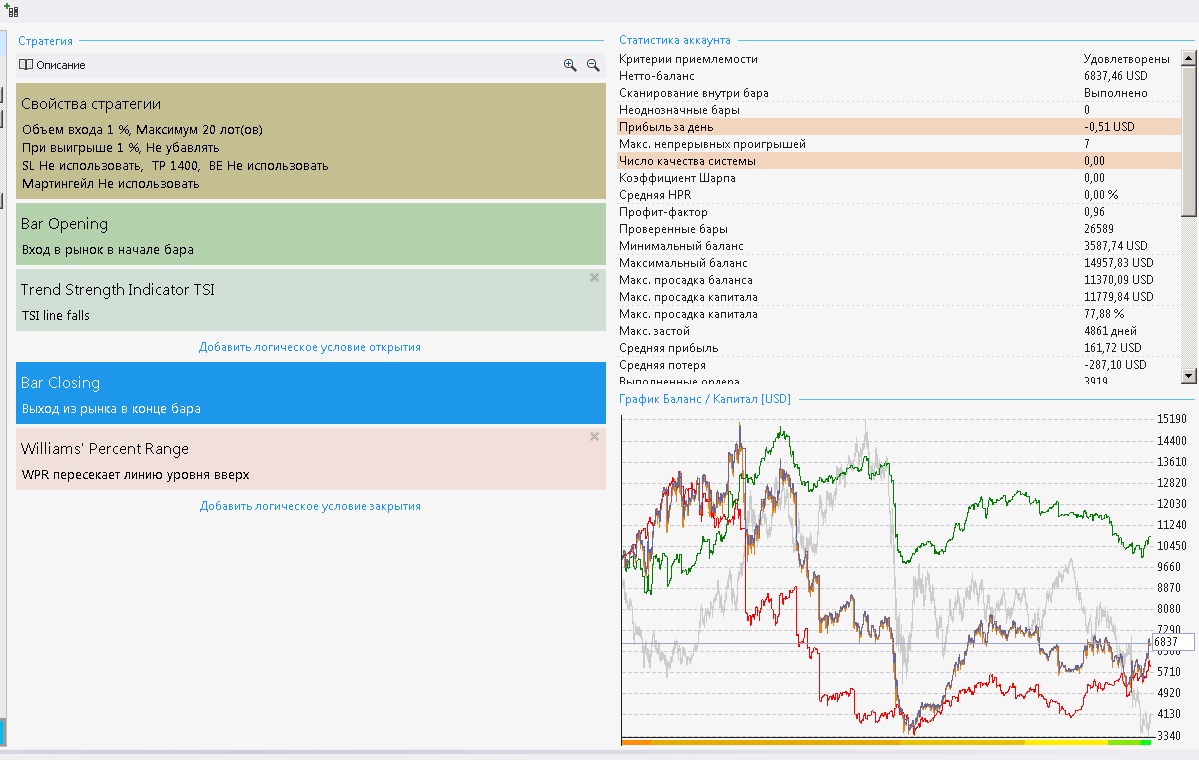
As you can see, my hastily built system is losing money. Note that the account statistics field has been filled in and the balance chart is no longer empty: the gray line marks the pound closing prices (that is, the pound chart), green is profit from buys, and red is profit from sells. The black line shows the overall deposit growth, and the orange one, which is hard to see here, is the equity chart.
Strategy generator settings

But all this is good when you know what you are going to write: you chose the parameters and indicators, configured them, and got an adviser. But what if you have no idea what you want to do? That is exactly what the strategy generator is for. This window looks almost the same as the previous one:
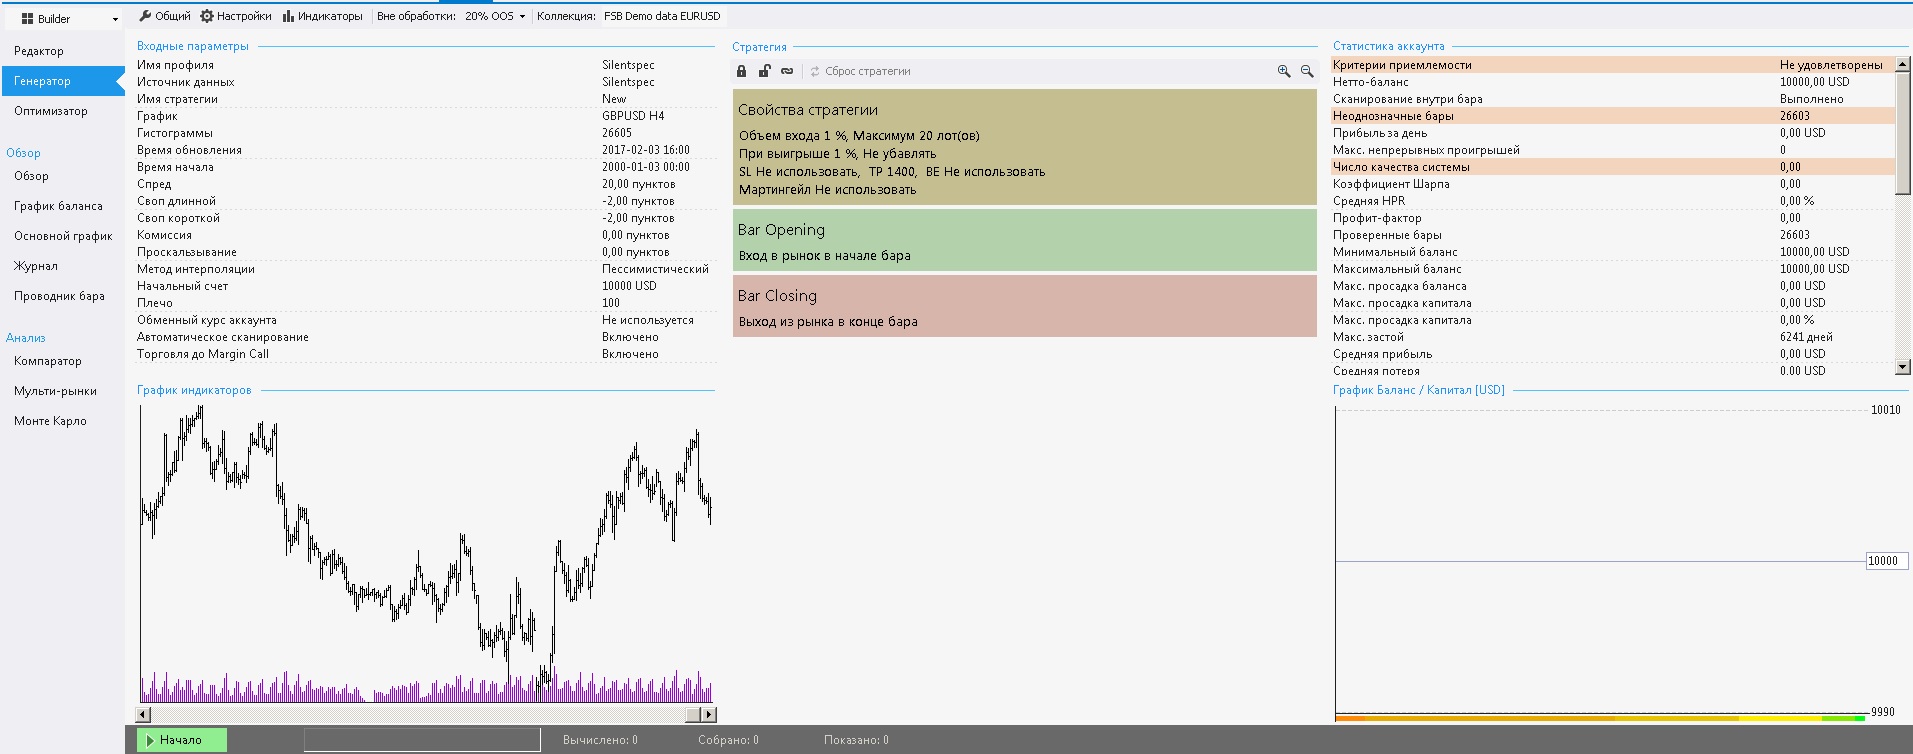
Let us dwell on the differences. The first difference is in the toolbar at the top:

- The General button opens the general generator settings:
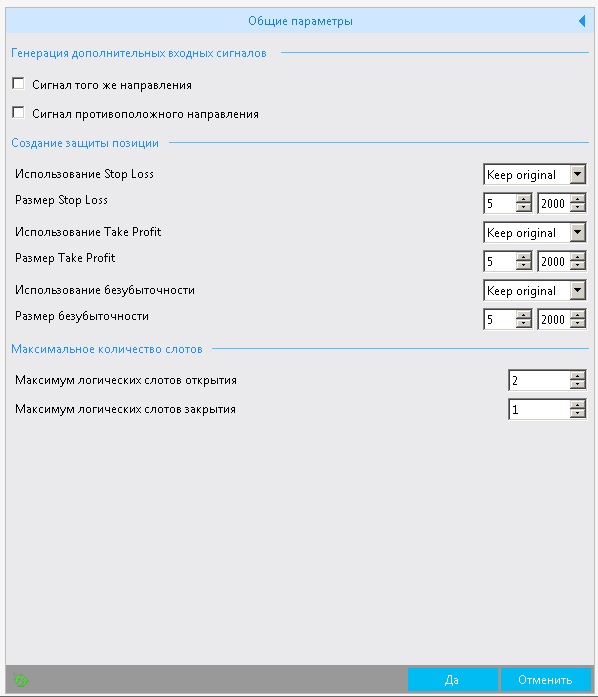
If you wish, you can set a range for TP, SL, and BE or leave them as before (specified in the editor window). These parameters are listed in new items, like all the others in the program. The most important settings here are the number of slots for generating entry and exit signals, that is, in essence, the maximum number of conditions for entering and exiting positions. You can also specify the need to generate additional trades if a repeated signal of the same or opposite direction appears.
- The next button, Settings, opens a window like this:
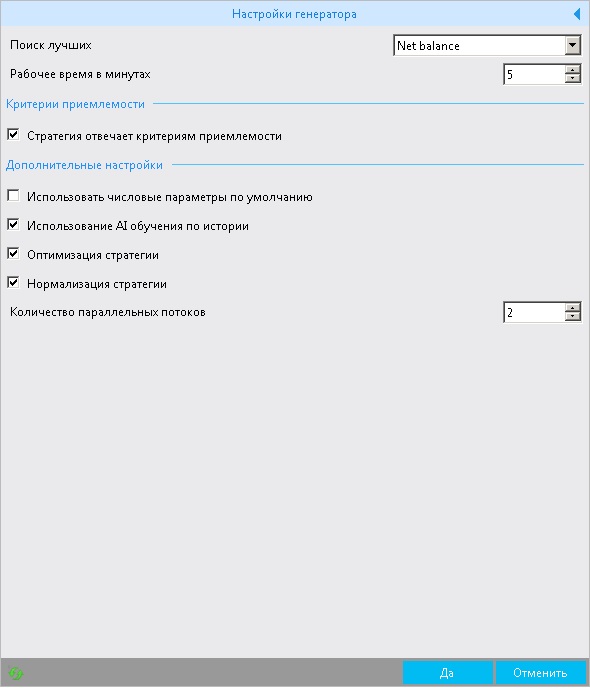
Here we can choose the method for selecting the best options by various metrics: maximum balance, system quality ratio, Sharpe ratio, minimum Equity drawdown, profit, average and geometric HPR, profit factor, and profit-to-risk ratio. The most important parameter here is the time allocated for strategy generation (Working time in minutes). Its value depends on the timeframe used. I have been using this program for almost a week already and have already obtained some results that are not embarrassing to send into trading. So, for the D1 period it is worth setting at least 360 minutes; during this time, 1-2 really quite good systems will most likely be generated. For the H4 timeframe, 900 minutes; for H1, 3600 (about a week). On lower periods I never achieved an acceptable result. From experience, I will say that the program is pleasant to use for generating strategies from H4 and higher.

It is not worth touching the other settings for an inexperienced user, except perhaps the Acceptance criteria (in this case only acceptable strategies will be shown; the acceptance criteria are configured in the Acceptance tab of the Control Panel) and the number of parallel threads (the number of processor cores used to solve the task: the more there are, the faster generation proceeds, and the more strategies we will get in the given period of time).
- The next button is Indicators:
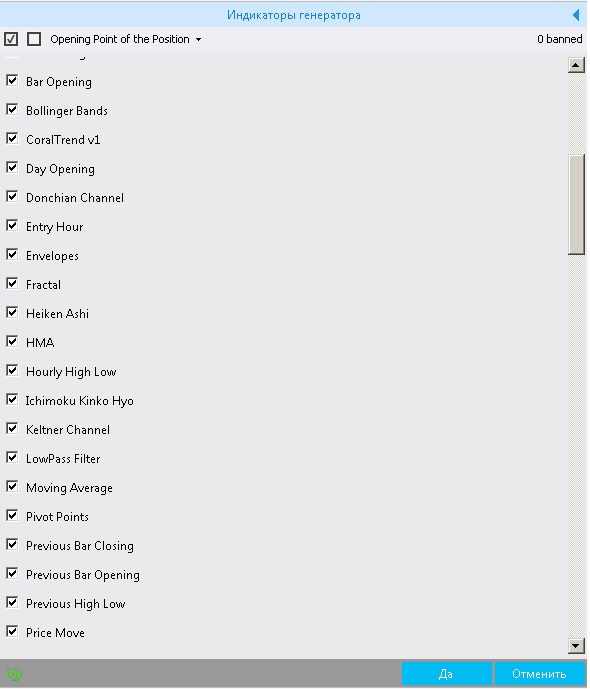
Here you can add or exclude any installed indicators from the strategy search. For example, fractals may annoy you a lot. You can uncheck the box next to the indicator name, and the generator will not consider strategy options with this indicator.
- The next item is Out of sample.
Here you can choose the amount of historical data that will be used to test the strategy on the forward period. I recommend setting this option to 20-30% of the total amount of quotes used.
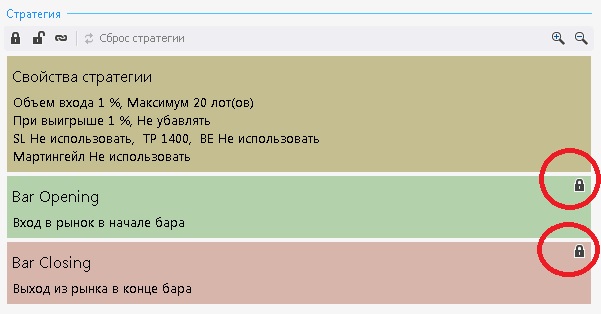
And the last thing to do before starting is to click once on the strategy blocks that you do not want to replace. For example, it is important to you that the strategy, among other things, uses exactly RSI; then, by clicking this block a couple of times and getting a padlock image, you will prevent the program from changing this block. If you did everything correctly, padlocks like mine should appear:
Generating strategies
And the last difference from the editor is the presence of a panel like this at the bottom:

Feel free to press the Start button and launch the strategy generator. The calculation will take some time, from about 5 minutes to a couple of hours, and that is normal. You did notice how quickly the test results are displayed in the editor, right? That's right, a matter of seconds. Well, minutes in the case of testing on M1. MT4 is definitely not capable of that!
After 15 minutes, the generator finished its work and our panel took the following form:

All our generated strategies are moved to the Repository. Select the View tab in the main menu -> Repository, or find the button with three columns on the ribbon:
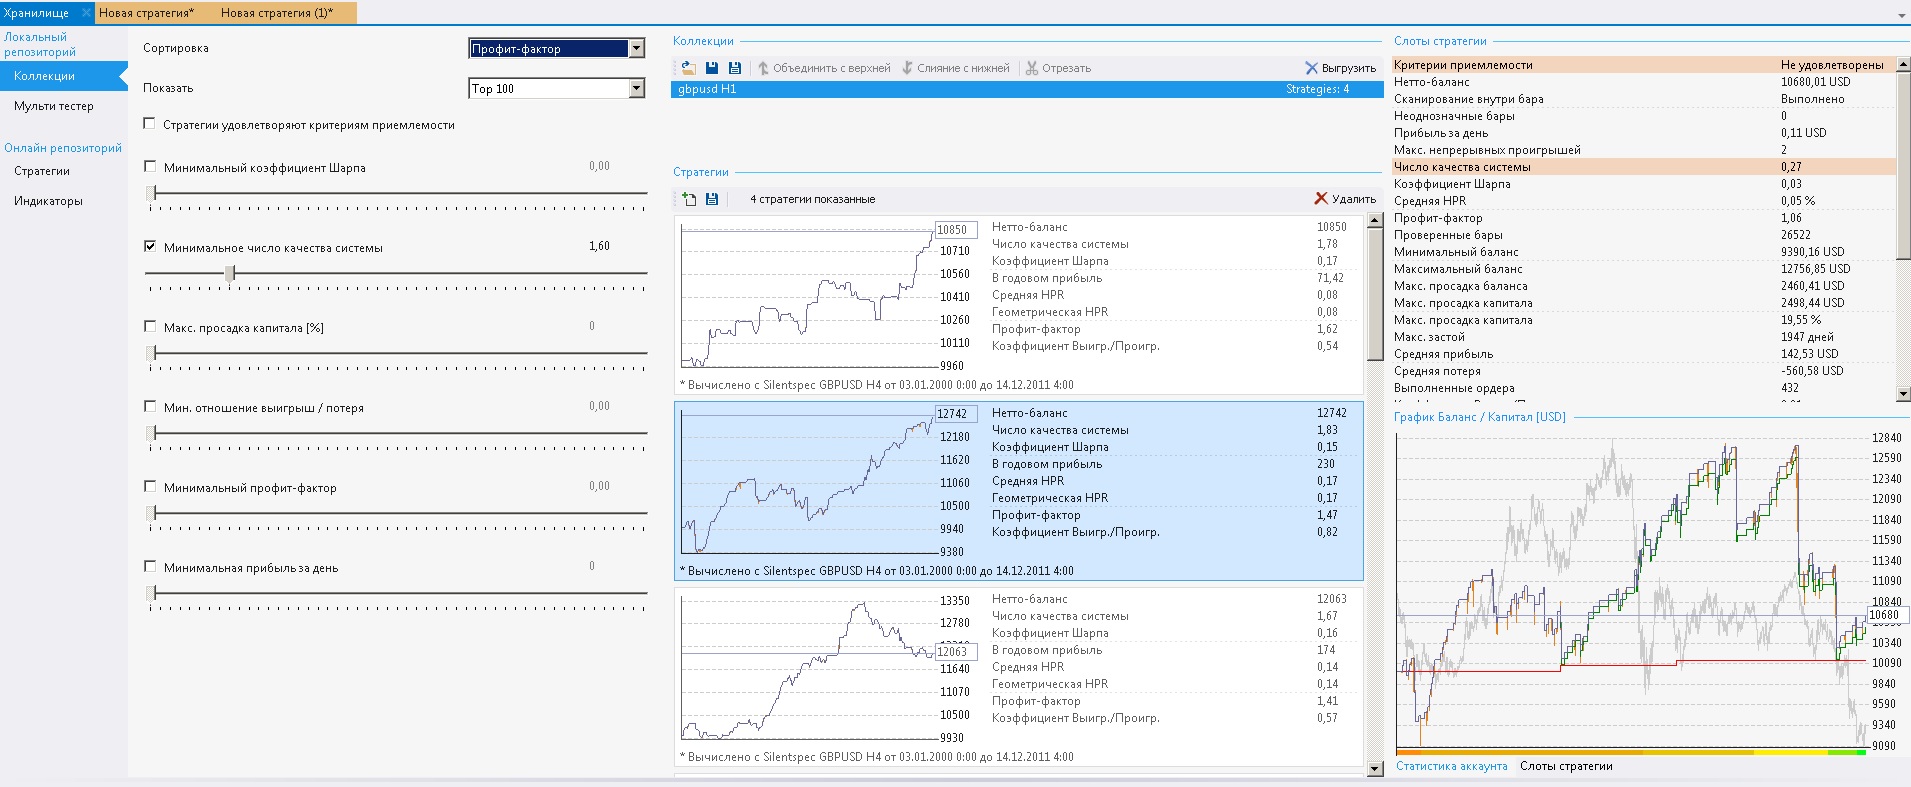
There are two groups of tabs in the menu on the left: Local repository and online repository. The local one stores all the strategies located on the computer; the online repository provides strategies from the program authors' website. A little to the right of the menu there is a field that helps with sorting (Sort from best to worst by the specified parameter and Show - the number of systems to display). Below, you can set conditions for filtering: if a system does not satisfy one of the parameters, it will be hidden from the review. By clicking once on the image of the system's deposit growth chart with its characteristics on the left, you will see which blocks the system consists of (the strategy slots field). At the bottom you will find the Strategy slots/Account statistics switch. When you select account statistics instead of slots, you can see detailed trading statistics:
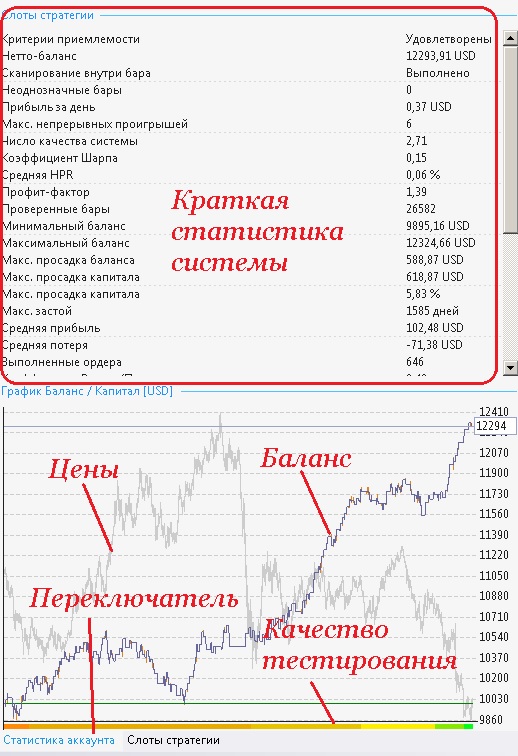
If you double-click with the mouse on the reduced image of the system characteristics, a new editor window will open with this system, which can then be edited further, for example, saved and the system optimized. It is very convenient to select systems in the following way:
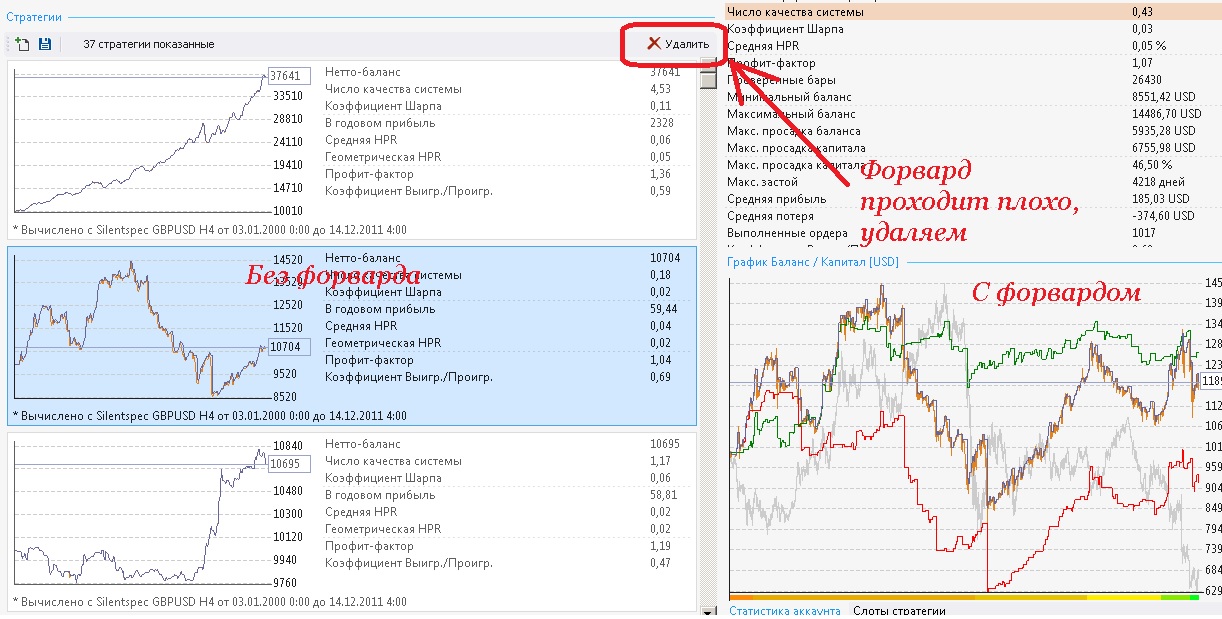
Analysis of generated strategies

I am very picky about generated strategies, so at best I have 1-2 strategies left from each session, and sometimes not even one. But if one does remain, I save it as an expert advisor for MT4 and immediately test it there. Although testing strategies converted to mql4 format takes quite a lot of time (they test very sluggishly because they are packed to the brim with various classes, functions, custom indicators, and more), it is still worth doing - for some reason the program calculates drawdowns and money management incorrectly, and instead of grail-like growth you may get a margin call.
If suddenly everything suits me, I save this strategy, but that does not happen often. Nevertheless, over a week I accumulated two strategies for H4 and five for D1. They passed my strict selection and will eventually be sent to a demo for testing.
If you have a multi-core processor, you can create several new strategies on different pairs and then run the strategy generator on each of them to save time.
So, you configured and launched the generator, left it running for 5-6 hours, and when you came back you found that your repository contained a pile of strategies. After filtering out those that lose on the forward test and those whose results are too weak, you will be left with one or two good strategies for each pair launched into work.
I generated strategies on the daily charts of the pound and the euro for 800 minutes; as a result, several million combinations were tried, almost 600 strategies were generated, about 80 of them passed my acceptability criteria, and about 10 successfully passed the forward test. One daily strategy remained for each pair:
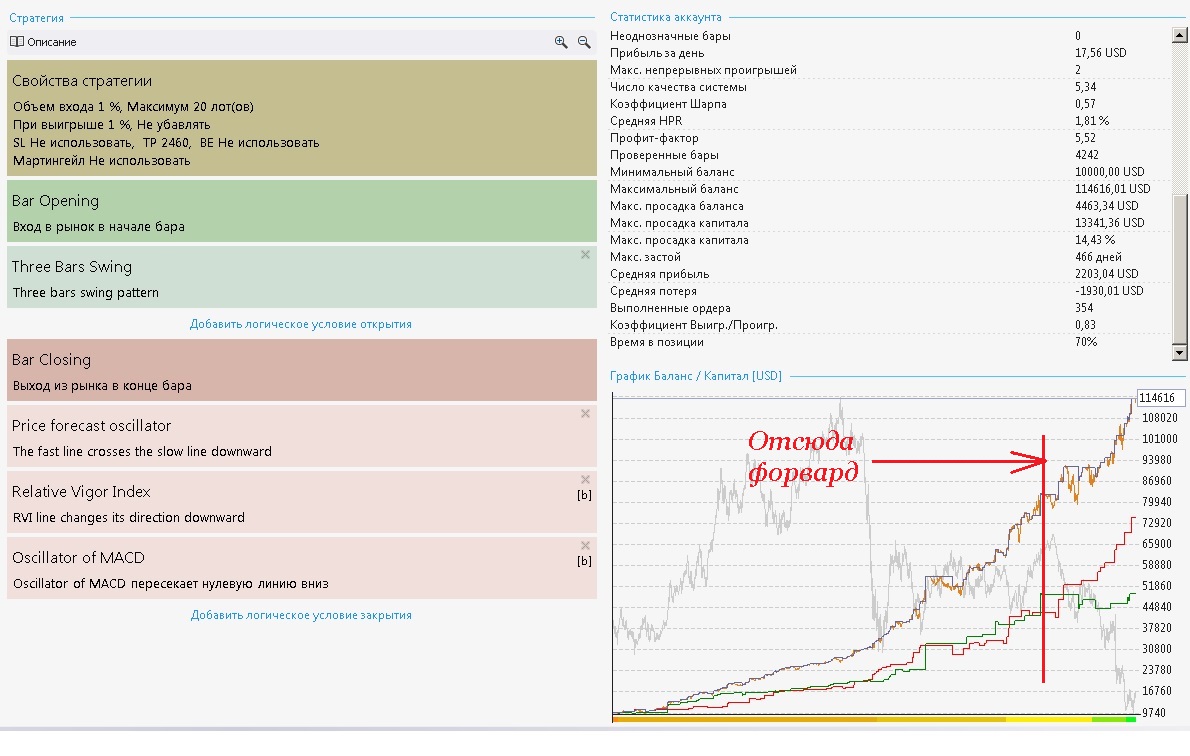
As you can see, the system uses the three-bar reversal candlestick pattern for entry, and several oscillators for exit (and we have two exit options - by group a and group b). The system also has disadvantages, and significant ones: the system does not use a stop loss, the average loss is almost equal to the average profit, only 354 trades have been made since 2000, and the maximum stagnation time (that is, the system could not give a new profit peak) is a full 466 days, meaning we would have sat without profit with it for more than two years.
It goes without saying that trading with this system alone is impractical, and I do not like it very much either, but in a set of, say, a hundred different trading systems for different currency pairs, it is quite acceptable. But the absence of a stop personally still makes me delete it, although it is quite suitable for a further demonstration of the program's capabilities.
Optimizer

So, we have obtained several acceptable strategy options. The next step will be strategy optimization:
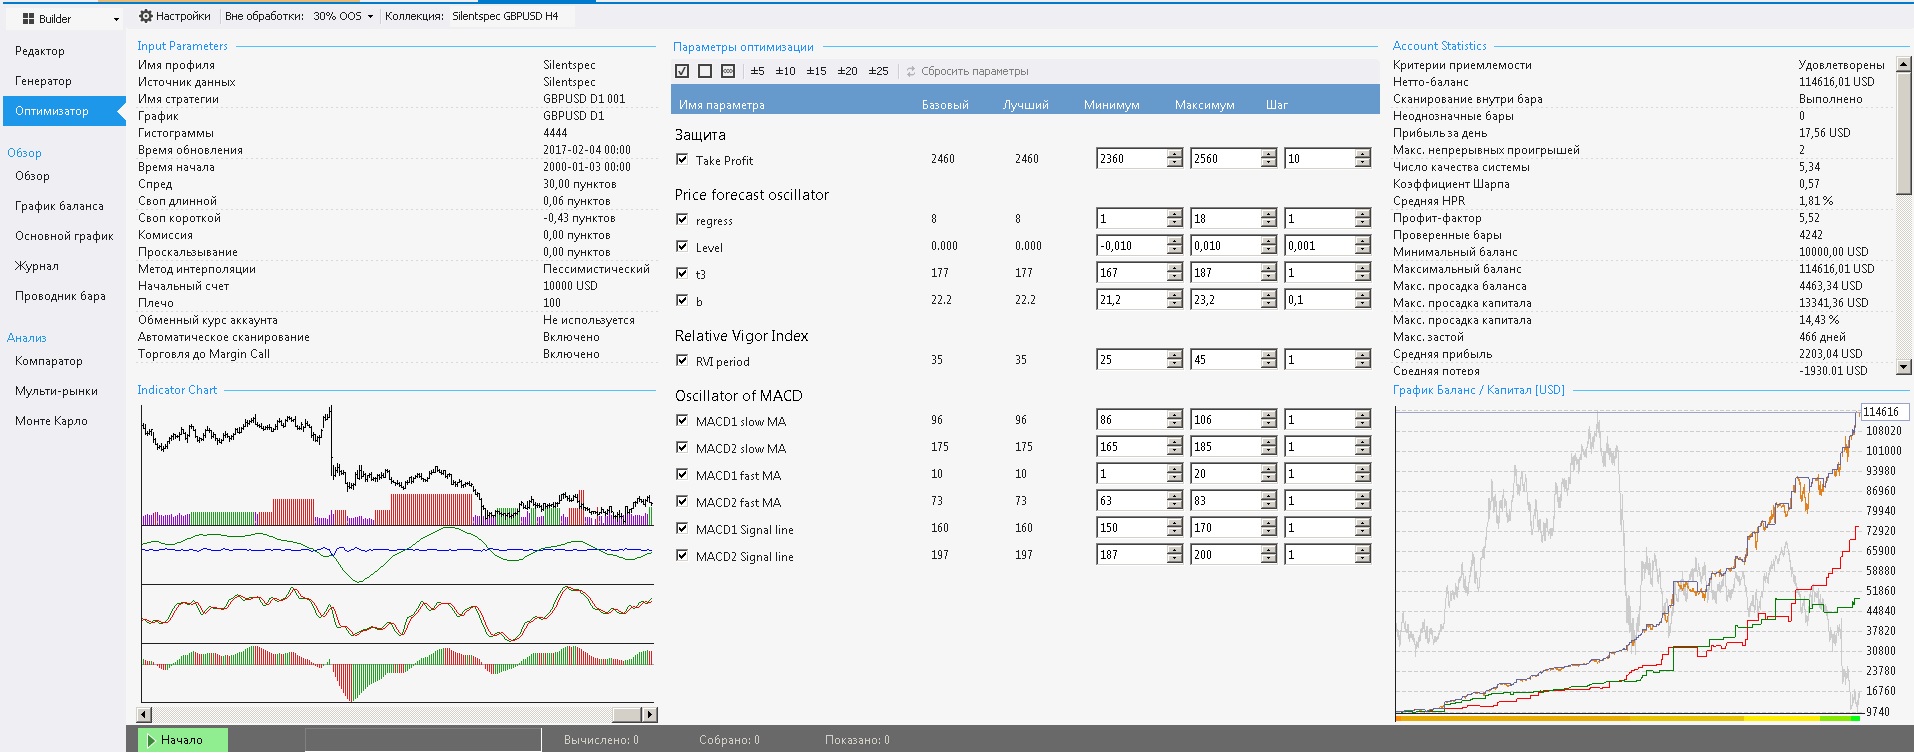
The optimization settings are rather modest:
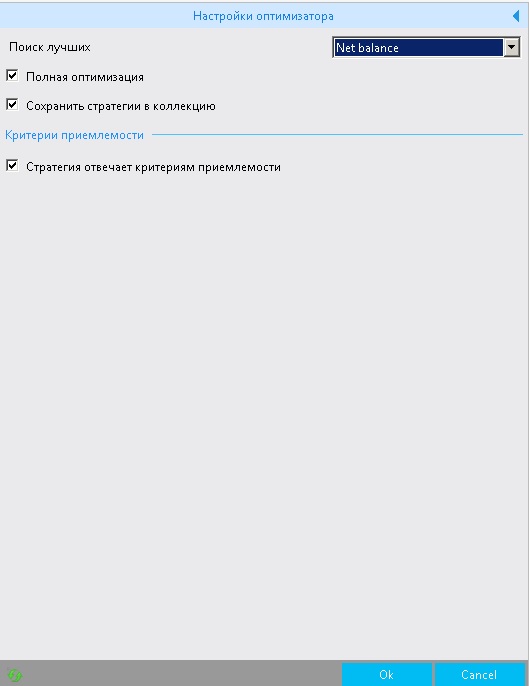
I think everything is clear here and requires no additional comments. Check the boxes next to the parameters that you are going to optimize, set the maximum and minimum parameter values and the increment step. Press the Start button and wait. You will again be able to find all successful options in the Repository.
So, we obtained an optimized strategy, but the program would not be so entertaining if the next group of tools in the left menu, which we will talk about now, did not exist.
Overview

The overview group consists of five tabs: the Overview itself, the Balance chart, the Main chart, the Journal, and the Bar explorer.
- Overview tab
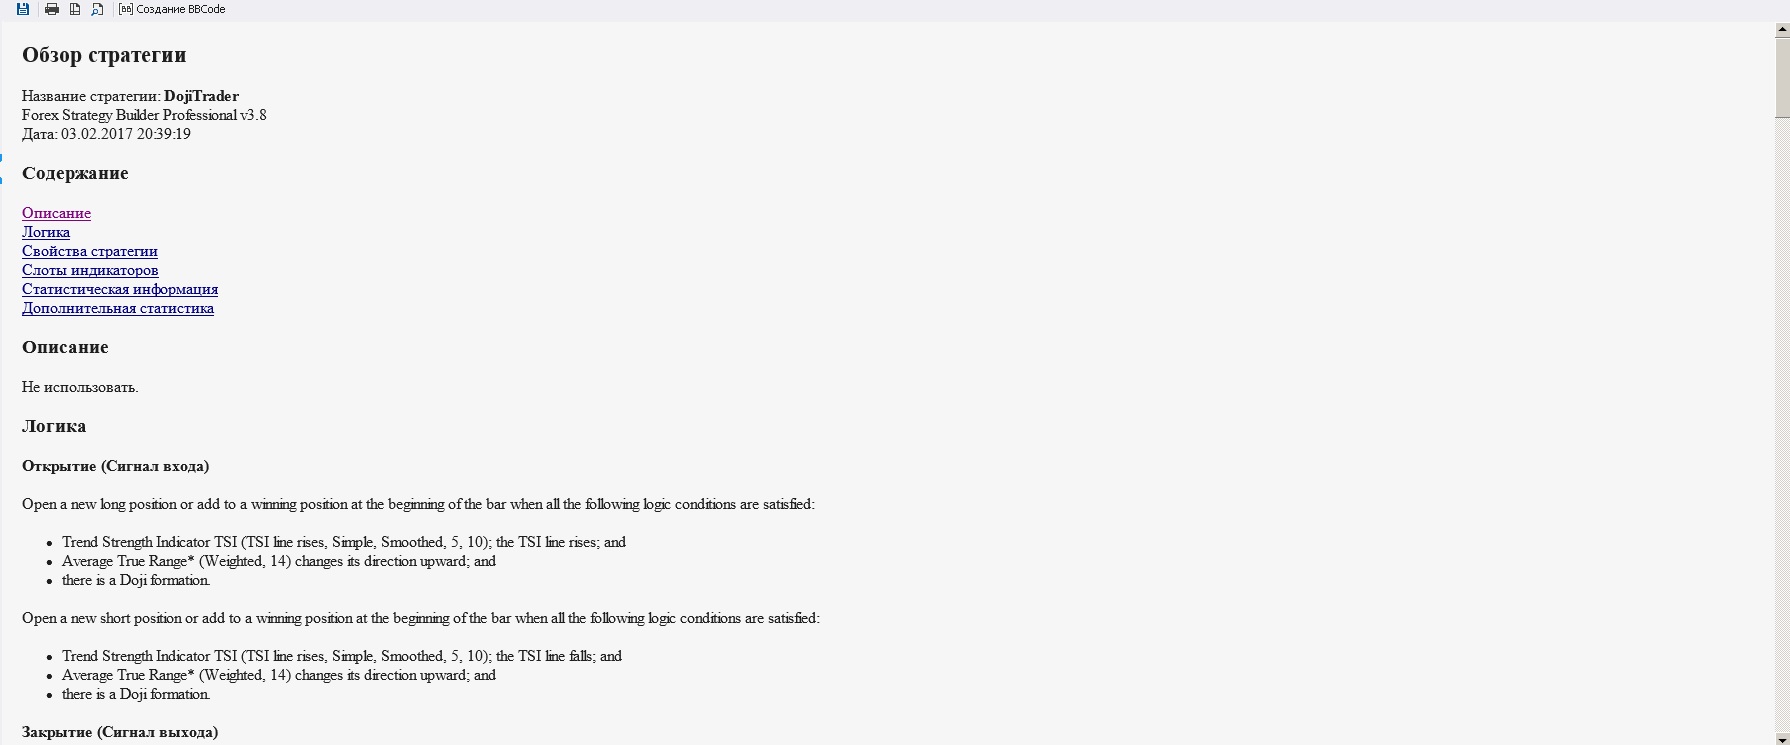
The Overview tab is a textual description of the trading strategy, its specification. In addition to a textual (in words) detailed description of the strategy's operating principle (entry logic, exit logic, scaling in, money management, and so on), here you will find screenshots of the indicator slots with their settings and two tables with detailed system statistics. At the top on the toolbar, you can save this very detailed description or print it.
- Balance chart
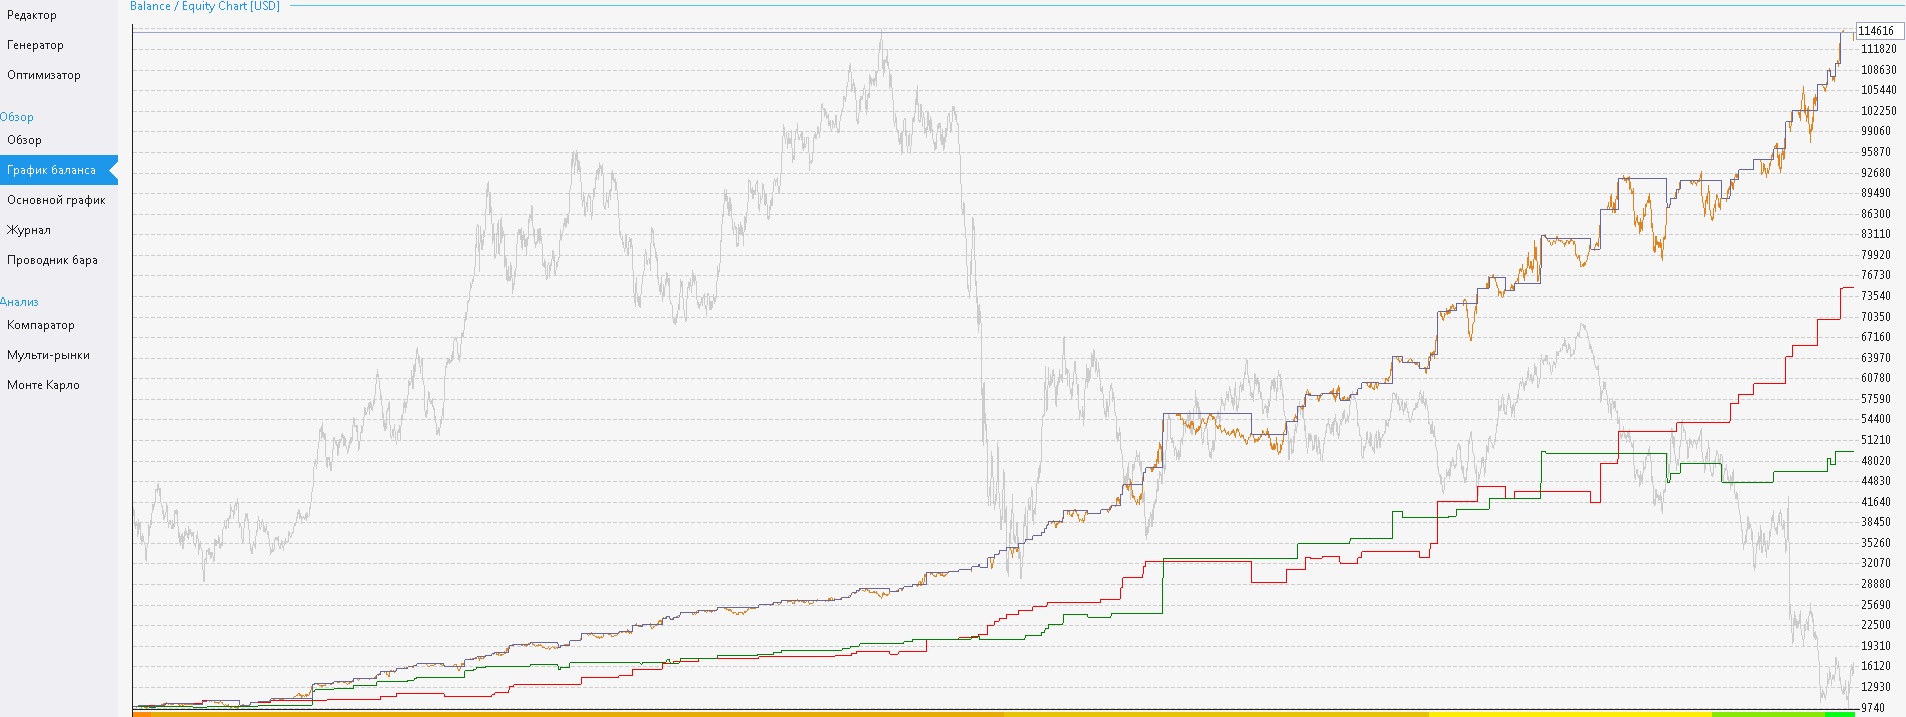
On the Balance chart tab there is also a toolbar at the top containing three buttons: Balance chart, Accrued, and Distribution trading. The program's translation is clumsy, but I will explain everything now. So, on the balance chart there are five lines: the gray one is the instrument's price chart, the black one is the balance chart, the green one is the growth from long positions, the red one is the growth from short positions, and the orange one is the equity chart (it is not visible now).
- Main chart tab
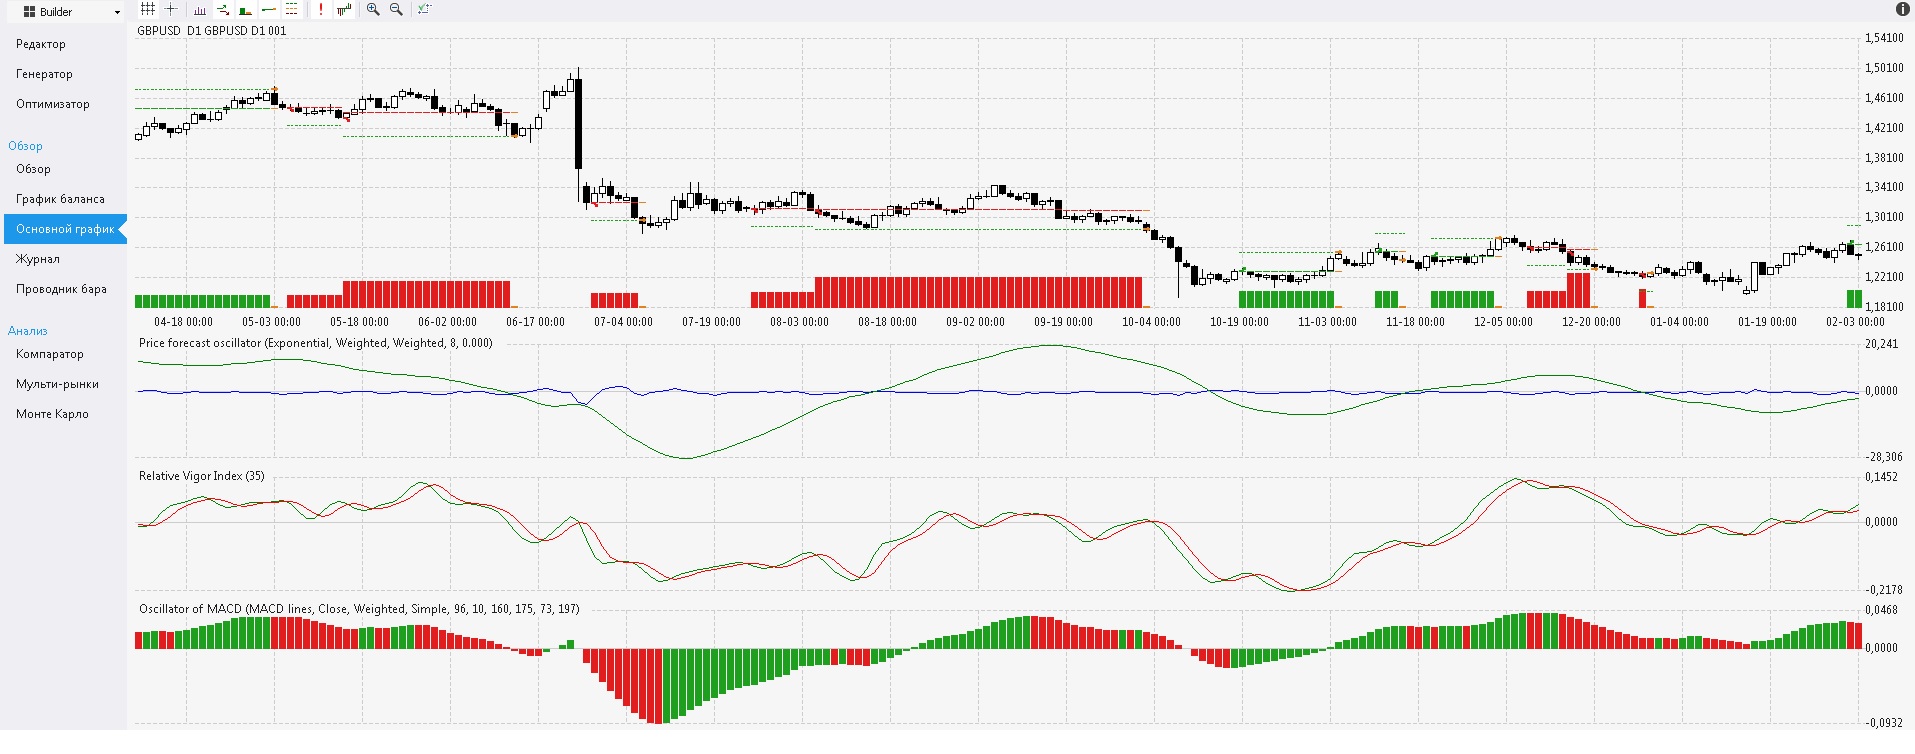
On this tab you can see all the indicators used on the price chart and the history of open trades. A green upward arrow marks buys, and a red downward arrow marks sells. A cross means the exit point from a position, the green line is the TP level, and the red line is the stop level. This is an analogue of visual testing in the MT4 terminal. Above the chart, you can see the toolbar:
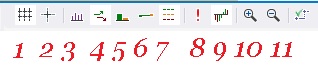
Here you can enable/disable the grid (1), the crosshair (2), volume display (3), position entry arrows (4), position volumes (5), position entry levels (6), stop and take levels (7), ambiguous bars (8) (those where it is not entirely clear how exactly the entry/exit/modification was carried out), indicator charts (9), navigation (10, 11), and the switch for displaying indicator charts as continuous lines or lines by closing prices (12).
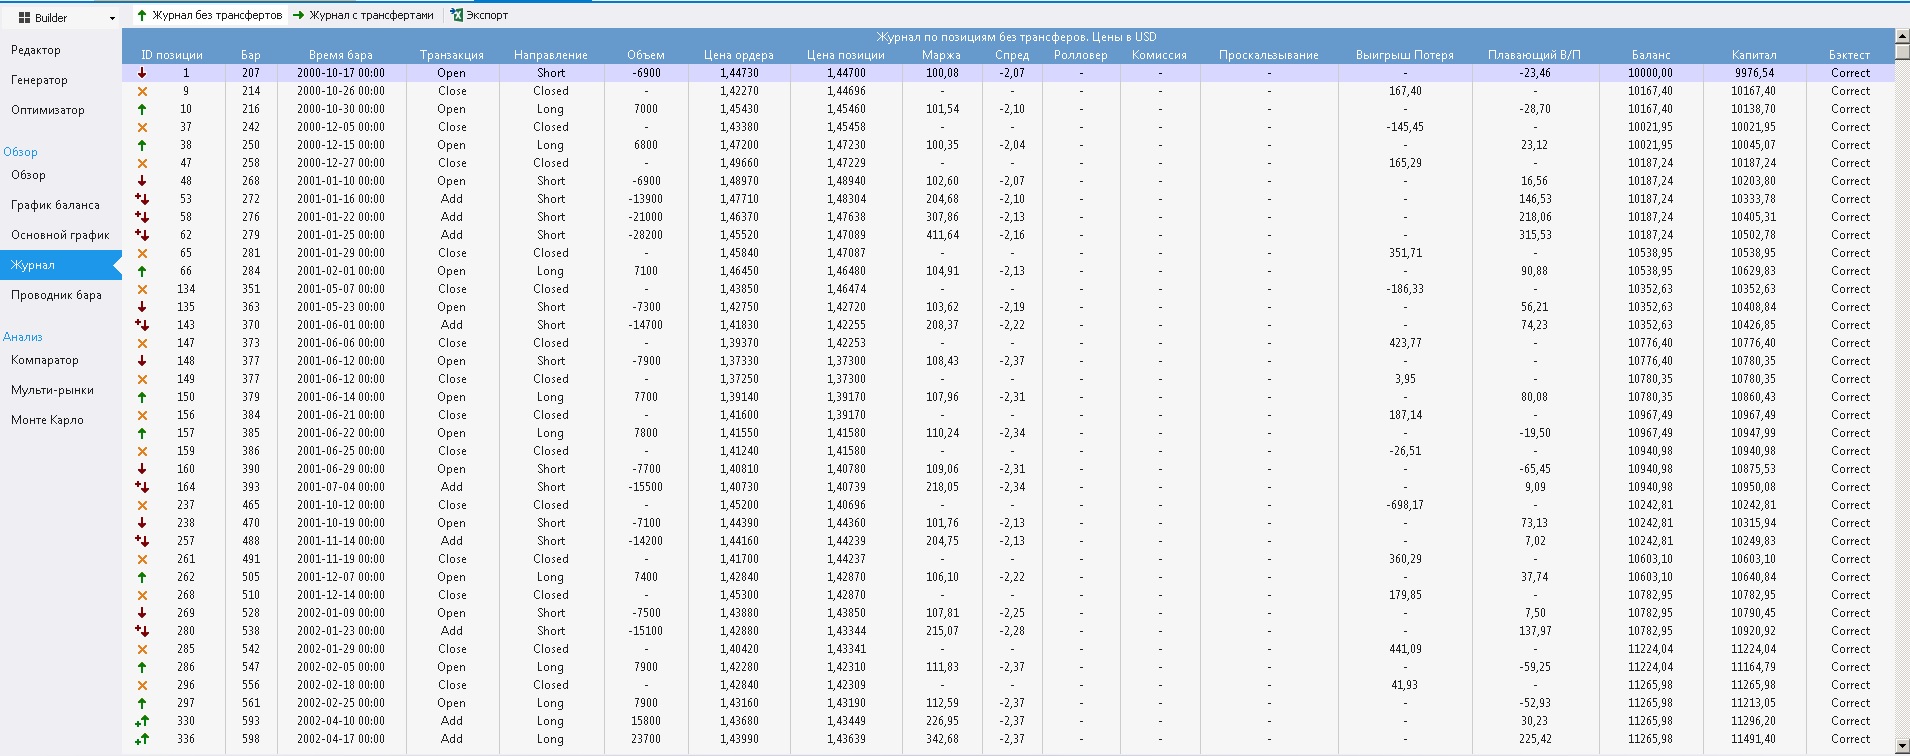
The Journal tab is a table with all completed trades, an analogue of the trade journal in MT4. You can save the trading results to an Excel workbook.
- Bar explorer
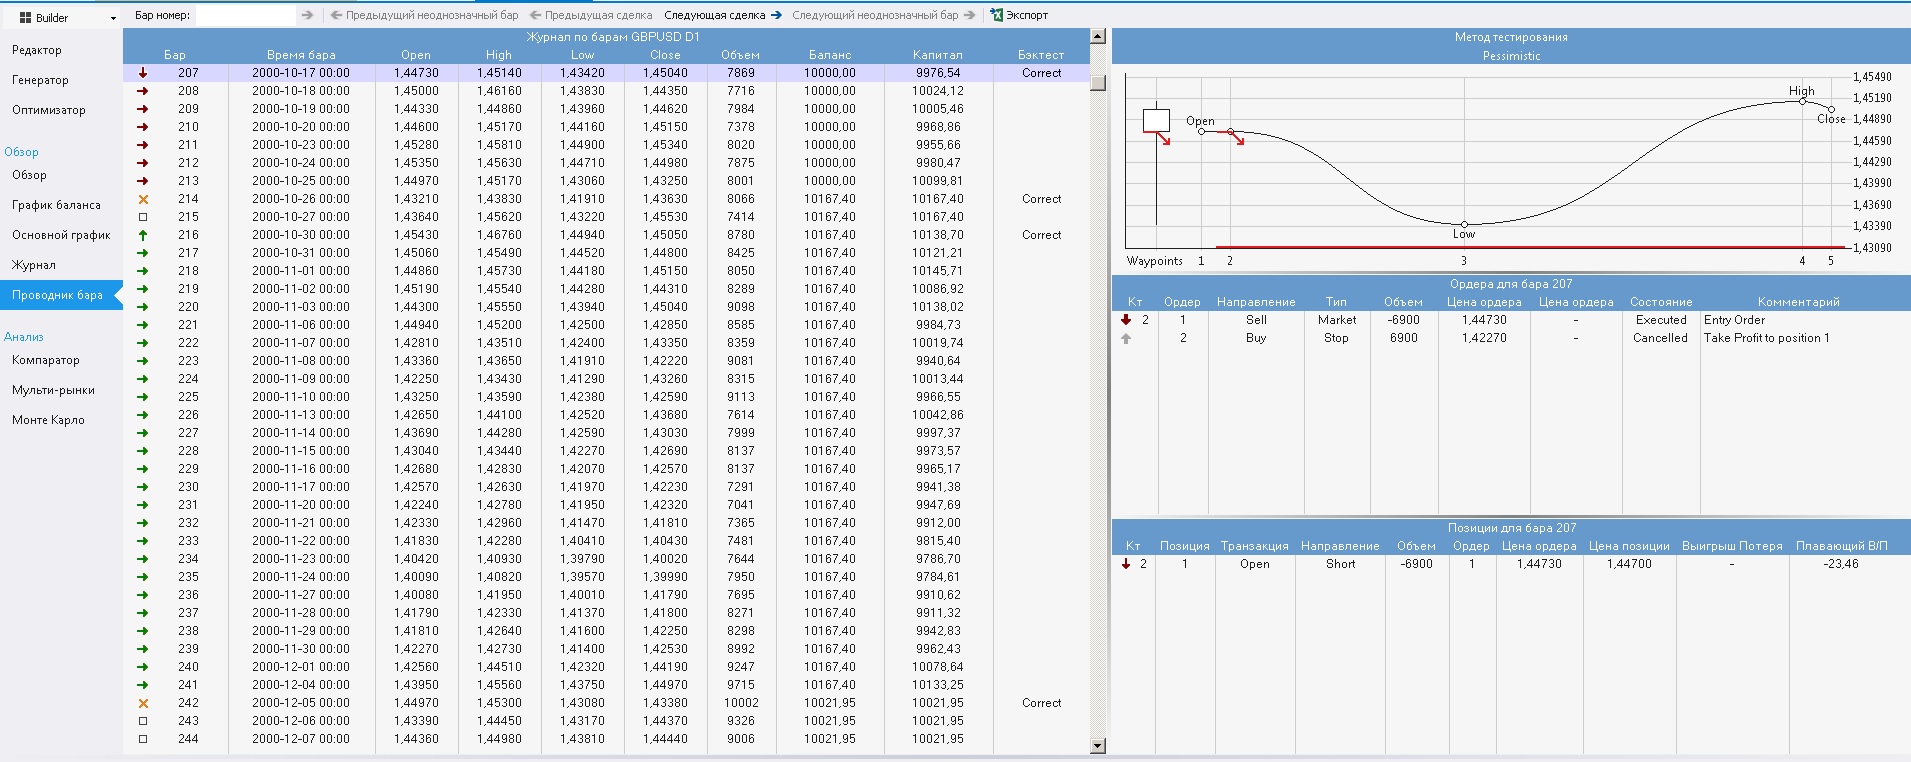
Here you can see how exactly the advisor behaved inside a specific bar, and examine the disputed points that are highlighted in the trade journal and on the main chart (if there are any) in order to assess the degree of influence of the inaccuracy on the overall result.
And now, when we have a working strategy in our hands, we can proceed to the stress tests from the Analysis group.
Comparator

First of all, we need to make sure that testing by different methods, with different quality, gives approximately the same result:
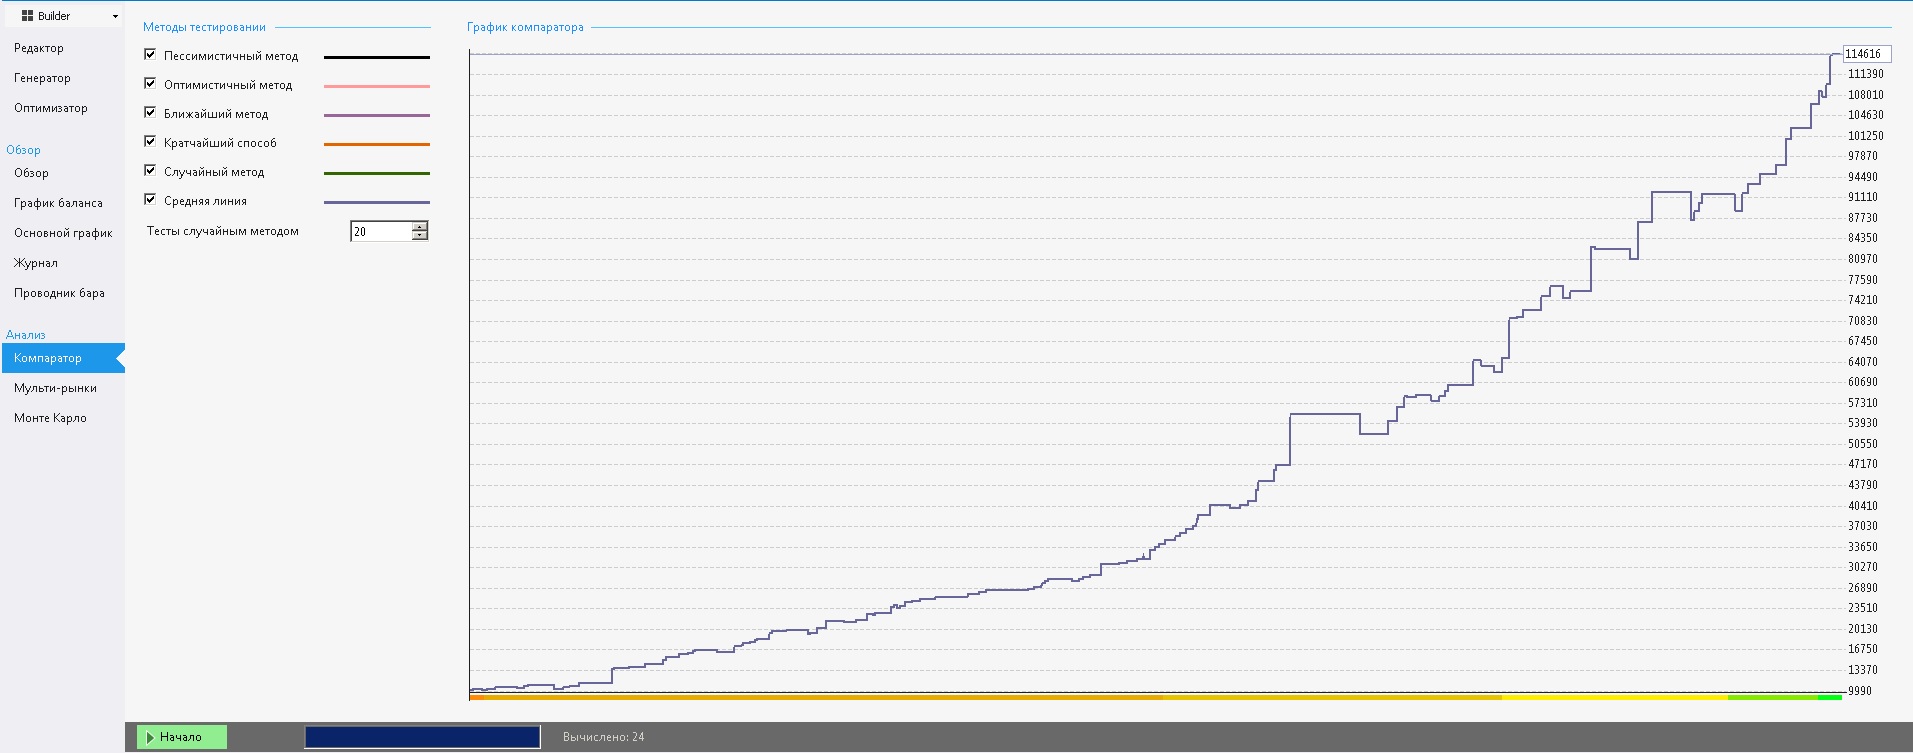
To do this, click the Start button and we will get the balance charts of the system tested in different ways. If there is one chart or all the charts are located approximately next to each other, then everything is fine. If not, the strategy can be deleted, because you did something wrong.
Multi-markets

The next test allows us to determine whether our system will work on other markets. In fact, if it does, you can re-optimize it for another market, and if it does not, that is considered not very good because the system is not stable enough. But if it turned out that your TS did not blow everything on most markets, that is already not bad:
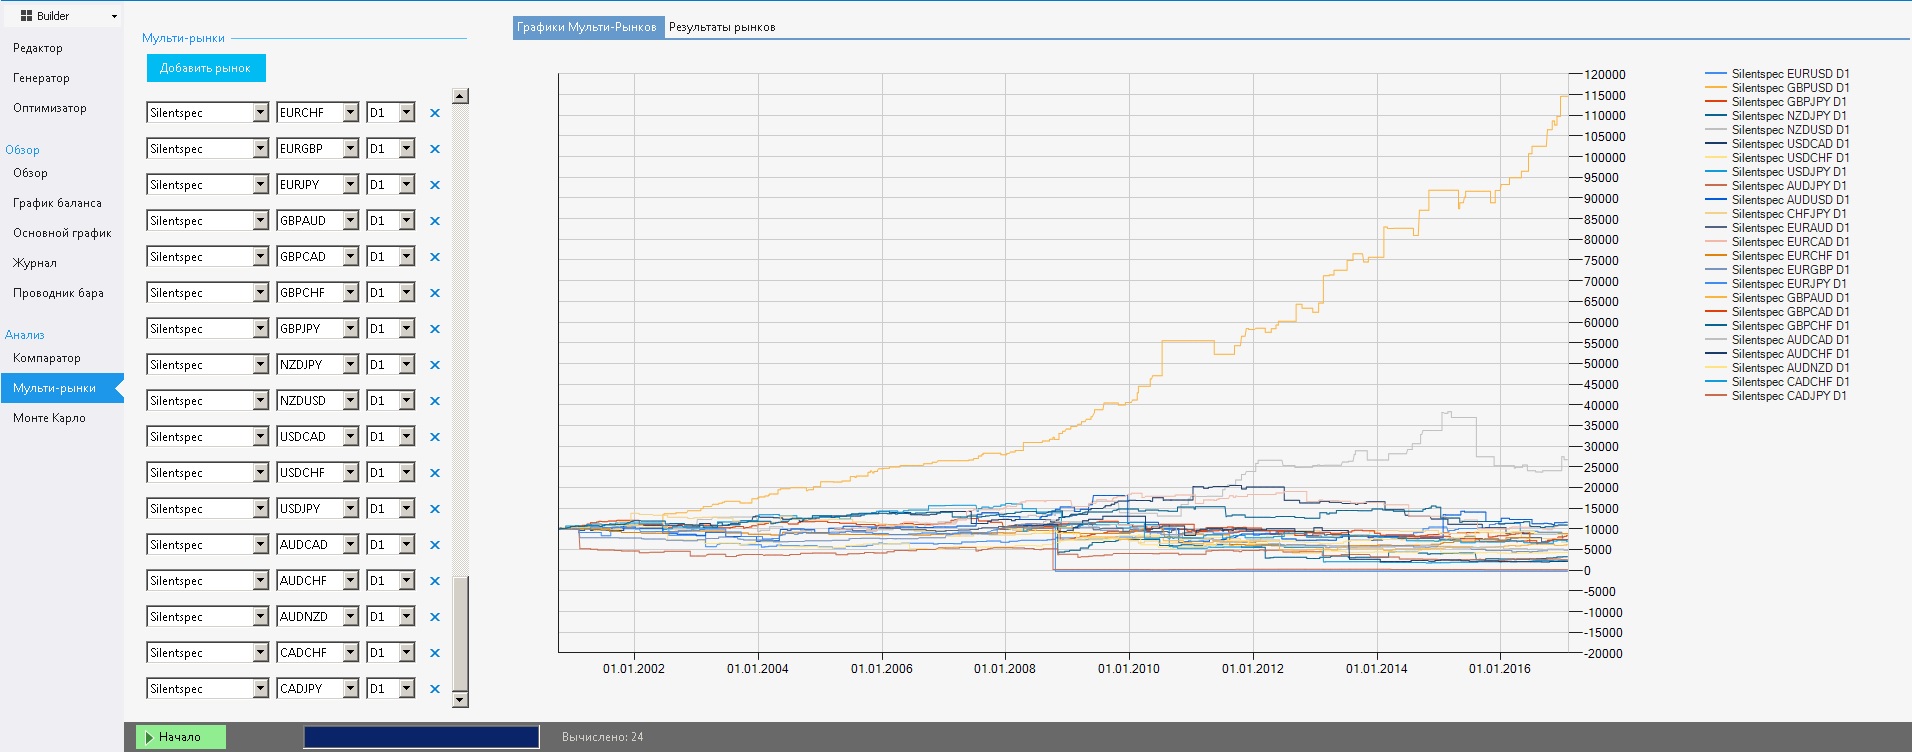
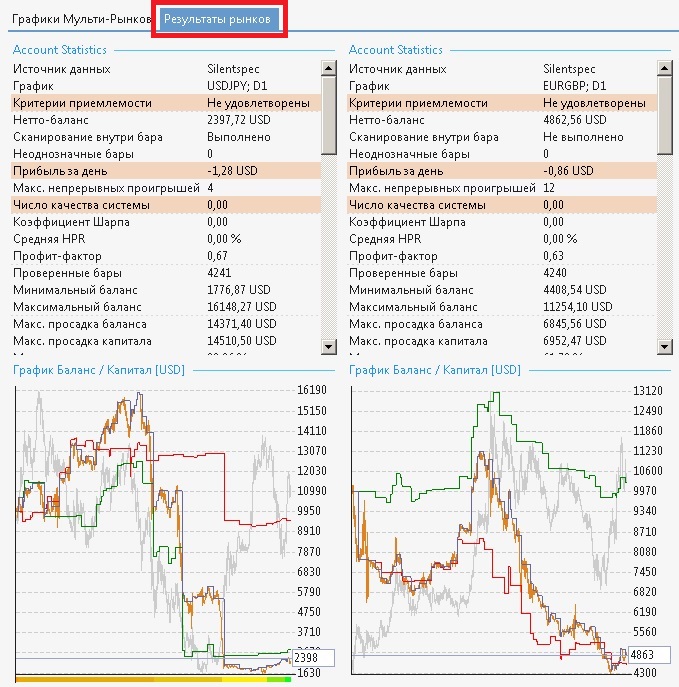
My TS blows up on all markets except the one it was created for. This is a very bad sign, and using the system in real trading is highly discouraged. You can get a more detailed look at the statistics for each market by clicking the Market results button located above the chart:
Monte Carlo

This is the last test of the system before saving it:
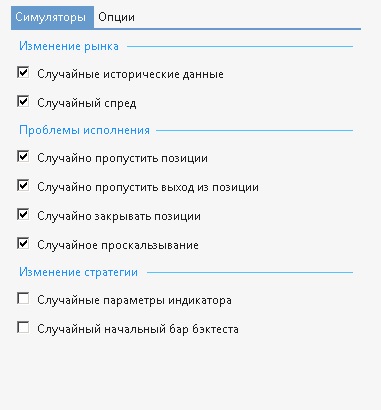
Three groups of simulators are available to us: market change, execution problems, and strategy change. A market change test means the possibility of the market sharply changing its original properties and starting to behave differently. Here we have two options available: adding random historical data to the quotes and a random spread. The remaining positions are, in principle, obvious.
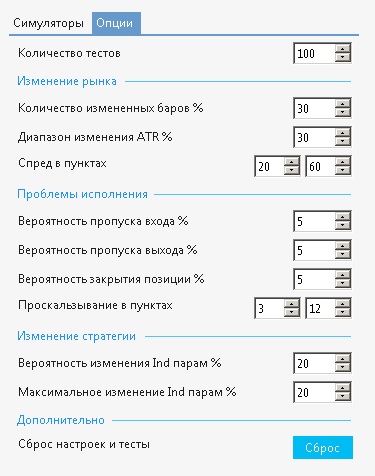
You can also configure all the above options, and then click the by now familiar Start button and get the test result:
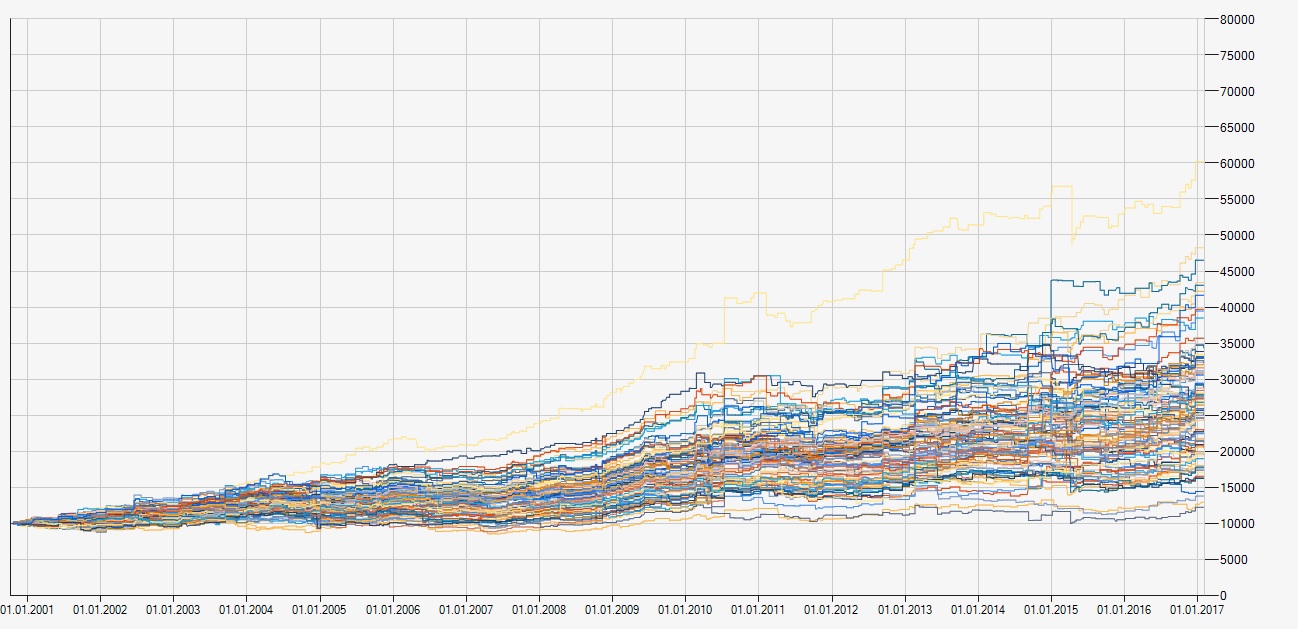
The main value of this test is that you can get the worst possible outcome of your trading with a specific advisor (the bottom line on the chart). If in the worst-case scenario our balance still turned out to be higher than the initial one, then everything is fine. If not, we ruthlessly delete the system. Above the chart there is a Confidence table tab:
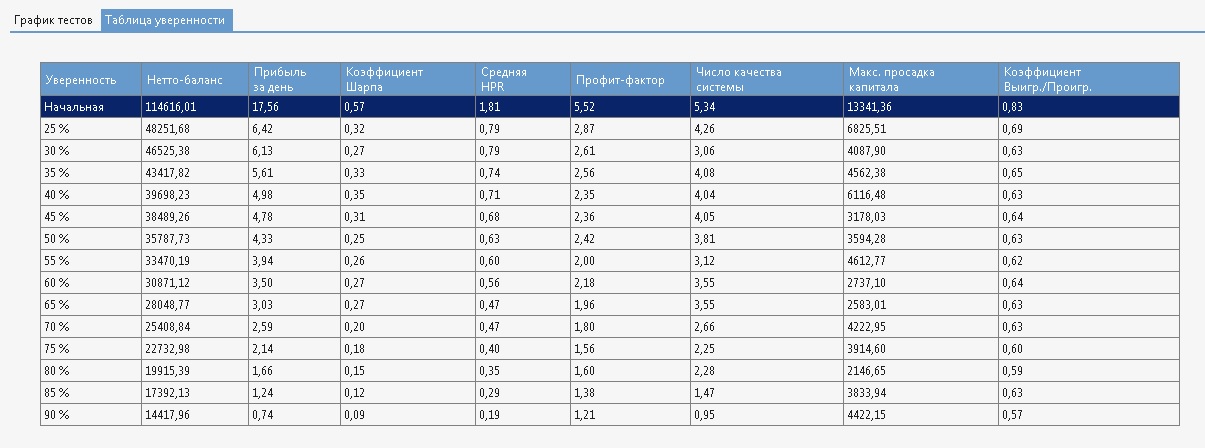
This table gives us very valuable information for further trading with the advisor in real conditions: if our result is worse than the bottom line, then it is time to remove the system from the account.
Automated trading

The program provides the ability to trade without saving the expert advisor as mql4 code. To do this, in the left menu you need to switch from the constructor to trading mode:
But first you still need to install a special bridge into the terminal with your account, which is located in the familiar User Files - MT4 Files folder. This folder contains the bridge installer. After installing the bridge into the terminal, you need to attach it to the chart of the same timeframe and the same pair as your strategy. Next, assign an ID number and copy it from the expert advisor into the program in the Set connection ID field:
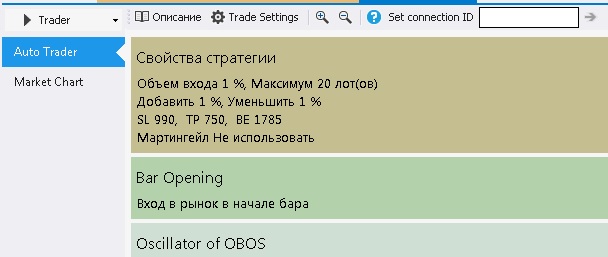
Then click Start and the expert advisor begins trading. In my opinion, this is not a very convenient feature, so I save strategies as mql4 expert advisors:
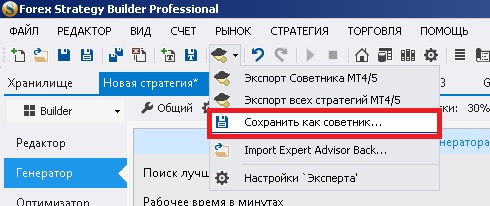
And then there is little left to do: run a final test in the MT4 terminal and move on to preparing the next strategy. I would never trade only one single strategy, because the program allows you to generate strategies painlessly for periods from H4 and above. And on higher periods you can sit for a year or two without updating the previous local maximum of the balance. A much smarter solution would be to create a couple dozen different strategies and run them together on your account. Fortunately, the program has a tool for this, and it is called the Strategy Portfolio:

After clicking this button, the statistics of all strategies currently open in the program will be combined into one single portfolio:
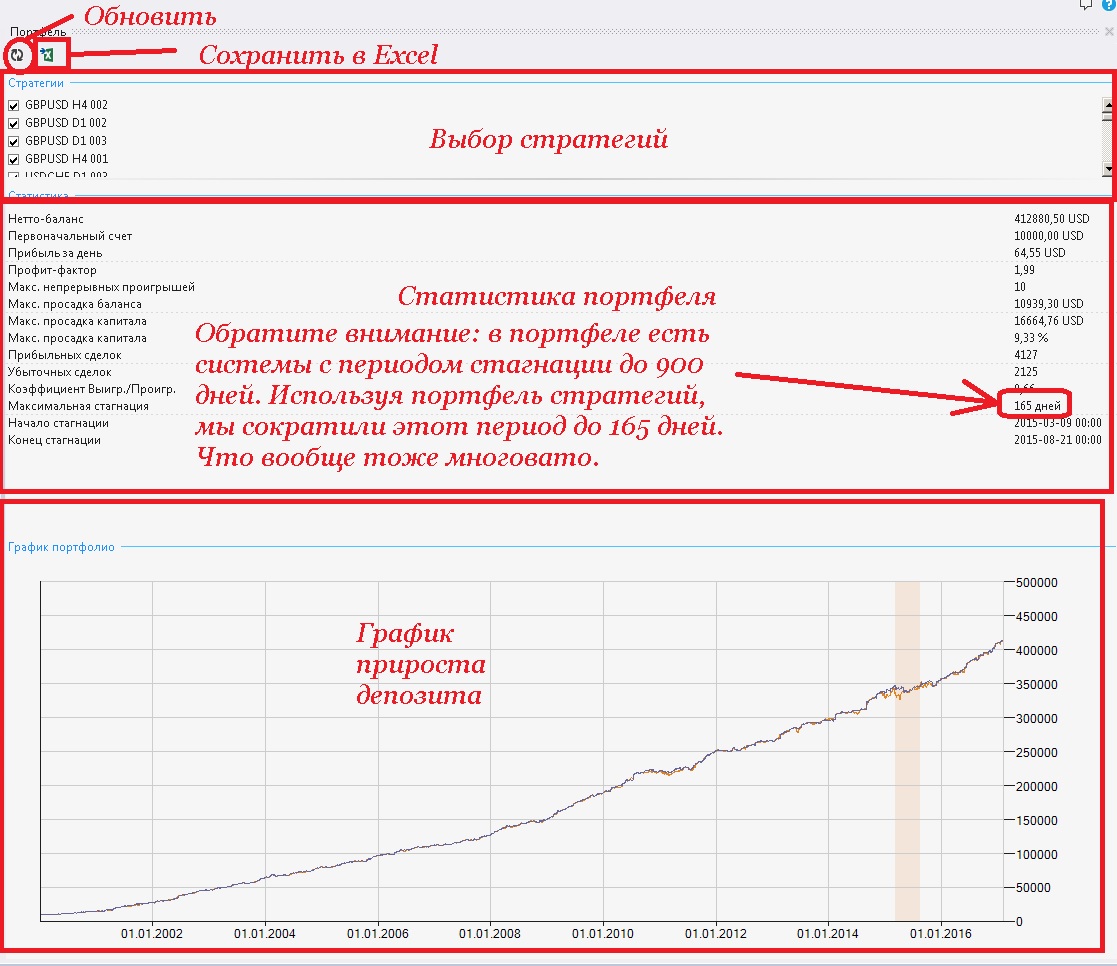
Conclusion

The System Creator program allows people who do not know how to program to create their own trading systems. The program has a great many different capabilities, and everything is done quite simply. Optimization and strategy generation take quite little time. But, unfortunately, the strategy generator is suitable only for strategies with a timeframe of H1 and above, and this is a serious drawback.
For traders who understand programming, truly grand possibilities open up, because you can import hundreds and thousands of your own favorite, time-tested indicators into the program and generate more complex and profitable trading systems. Creating a whole army of your robots with the help of the System Creator program is very simple, and you can cope with this task in a couple of weeks of intensive work - just look at the result of my work in only one week.
Of course, the System Creator program is not a factory of grails and not a printing press. But if you follow the technology of creating trading systems and carefully select them afterward, it is quite possible to obtain a portfolio of profitable strategies that will ultimately allow you to earn decent money on full autopilot.
Download the Program

The program is installed by unpacking the archive. Attention! For correct operation, the path to the program must not contain Cyrillic characters.
Best regards, Dmitry aka Silentspec TradeLikeaPro.ru
