
Studying Price Action Pattern Regularities

Hello, fellow forex traders!
Recently, in the chat traders shared the observation that Price Action candlestick patterns work out with different probability depending on the day of the week on which they were formed. And in today's lesson we will test this idea using mql4 tools. In the course of our research I will introduce you to working with candles and candlestick patterns, and also teach you how to output information to a separate .csv file. This file opens easily in Excel, so we will conduct the analysis in it. We will build various charts and visualize the obtained information in every possible way, such as: the best profit/loss ratio, the distribution of trades by days/months, and many other patterns.
Those who are not interested in the technical side of solving the problem can immediately move on to the results of the identified patterns - they definitely deserve attention.
Goals of the analysis

So, the goal of the analysis is to study the effectiveness of candlestick patterns on history, as well as to identify the correlation between their profitability and the day of the week or month in which these patterns arose. We need statistics for each pattern on each currency pair on timeframes H1-D1 according to the following parameters:
- the optimal ratio of stop-loss to take profit;
- distribution of trades by days of the week;
- distribution of trades by days of the month;
- distribution of trades by months of the year.
We will study the following Price Action patterns:
Programming the expert advisor
Analysis tools

Naturally, our main tools for obtaining statistics are the MetaTrader4 terminal and the code editor. We will also use Excel to analyze the results.
At the same time, we will not use candlestick patterns just like that; they need to be considered in the context of the current situation, namely: the pattern must rest on a level and the entry must be in the direction of the current trend. To determine the trend everywhere and always, we will use a simple moving average with a period of 50. If the price is above it, the trend is upward, and vice versa for a downward trend.
Automatically building adequate levels on the chart is not an easy task and in itself involves an entire study of the effectiveness of various approaches, just as for determining the trend. Our task now is not to write a high-quality expert advisor for earning money, but simply to obtain suitable statistics. To determine levels, we will use the simplest of the options - fractals. We will look for pairs of fractals at approximately the same level with an error of 10 points on a history of 100 candles. At the same time, it does not matter to us whether it was an up fractal or a down fractal - the main thing is that the price reversed. We will also provide the ability to disable trend and level determination and collect statistics without them.
Results

In total, about 90 thousand trades were analyzed on 23 currency pairs across three periods and four candlestick patterns for the period from 2000 to the present day. I cannot even imagine how much time such data collection would have taken if we had not automated it.
H1 period
Profitability charts:
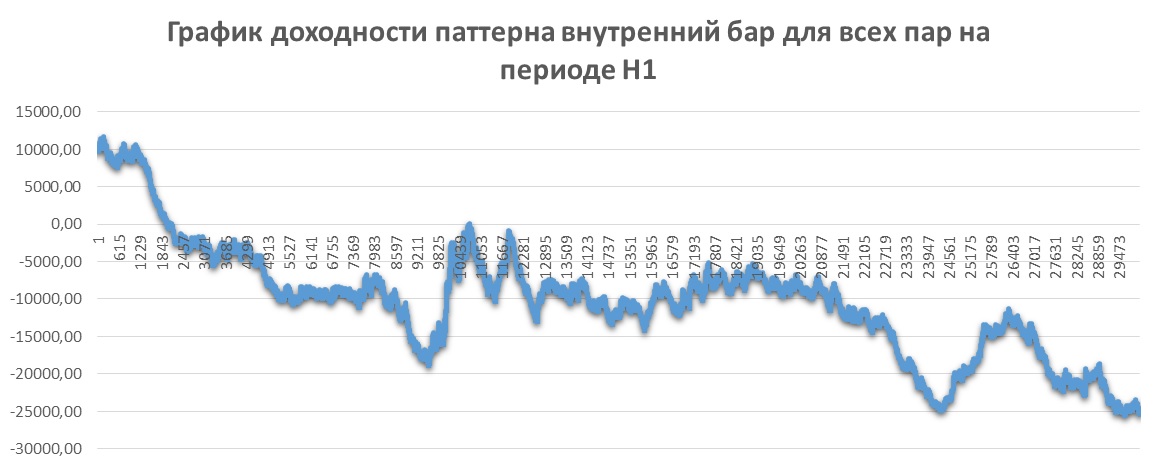
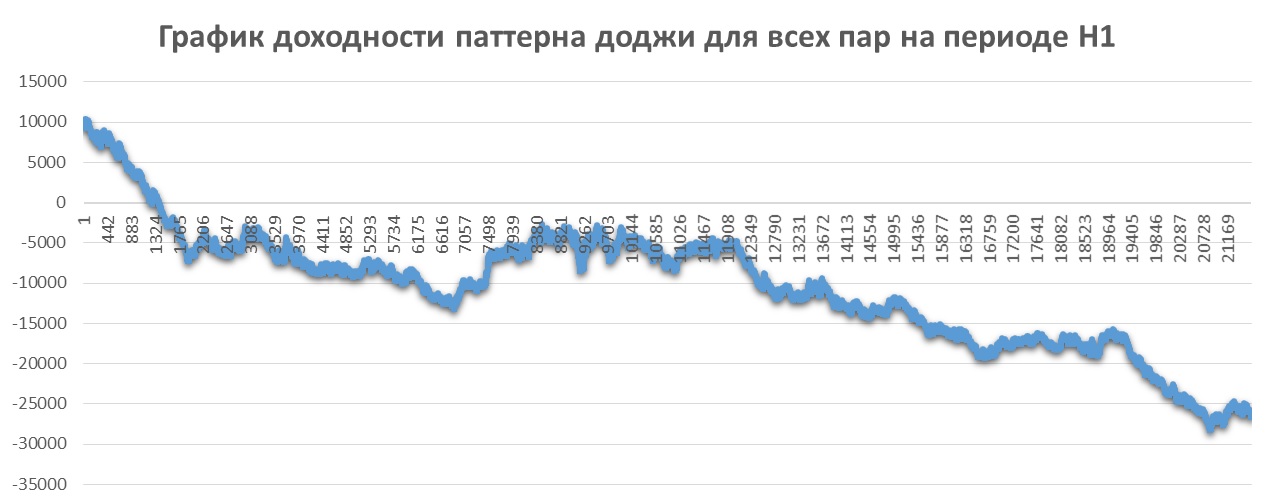
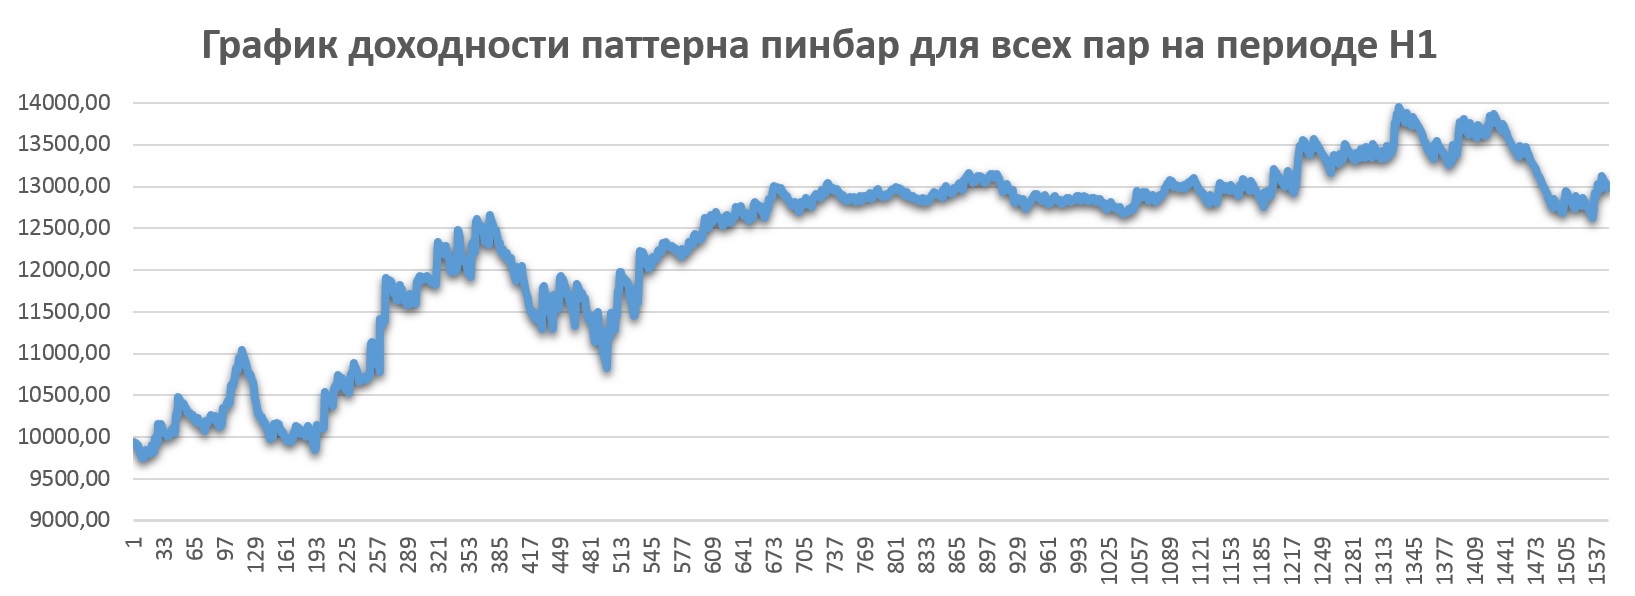
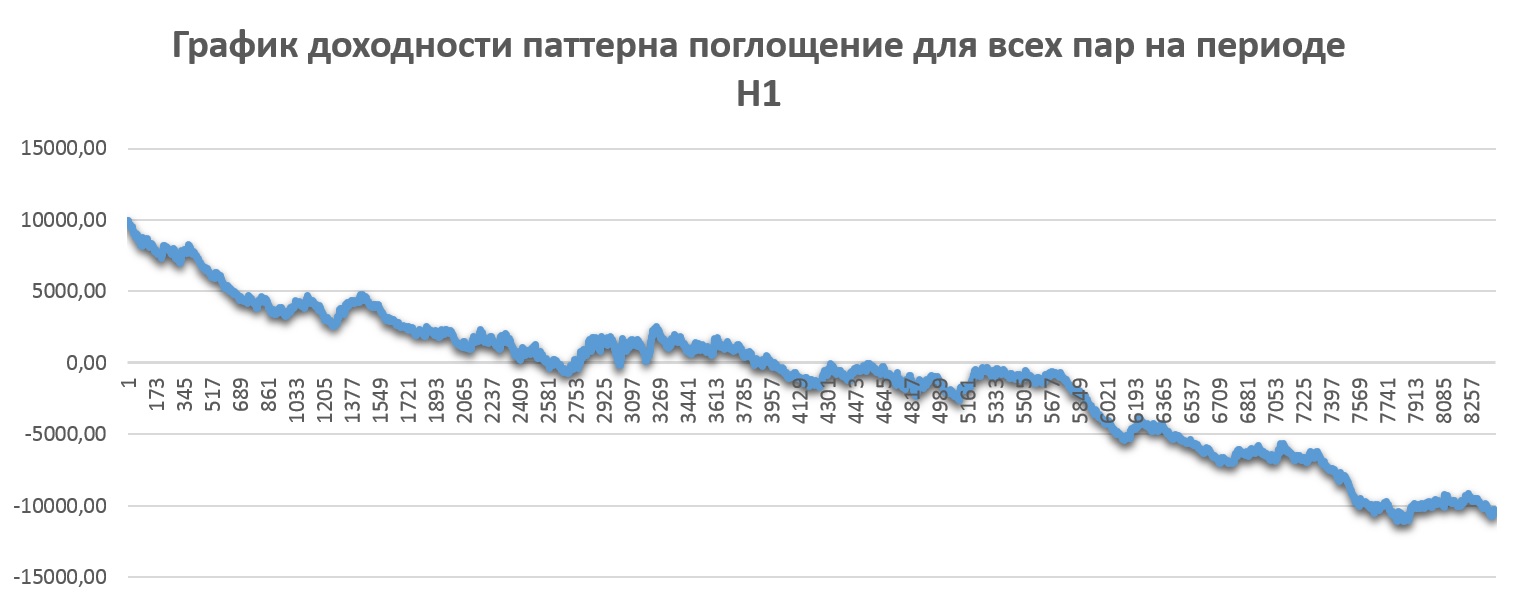
As can be seen from the charts, using Price Action patterns on the H1 period without additional confirmation in the form of levels and trading with the trend will lead to a loss of deposit.
Optimal stop-to-take-profit ratios:
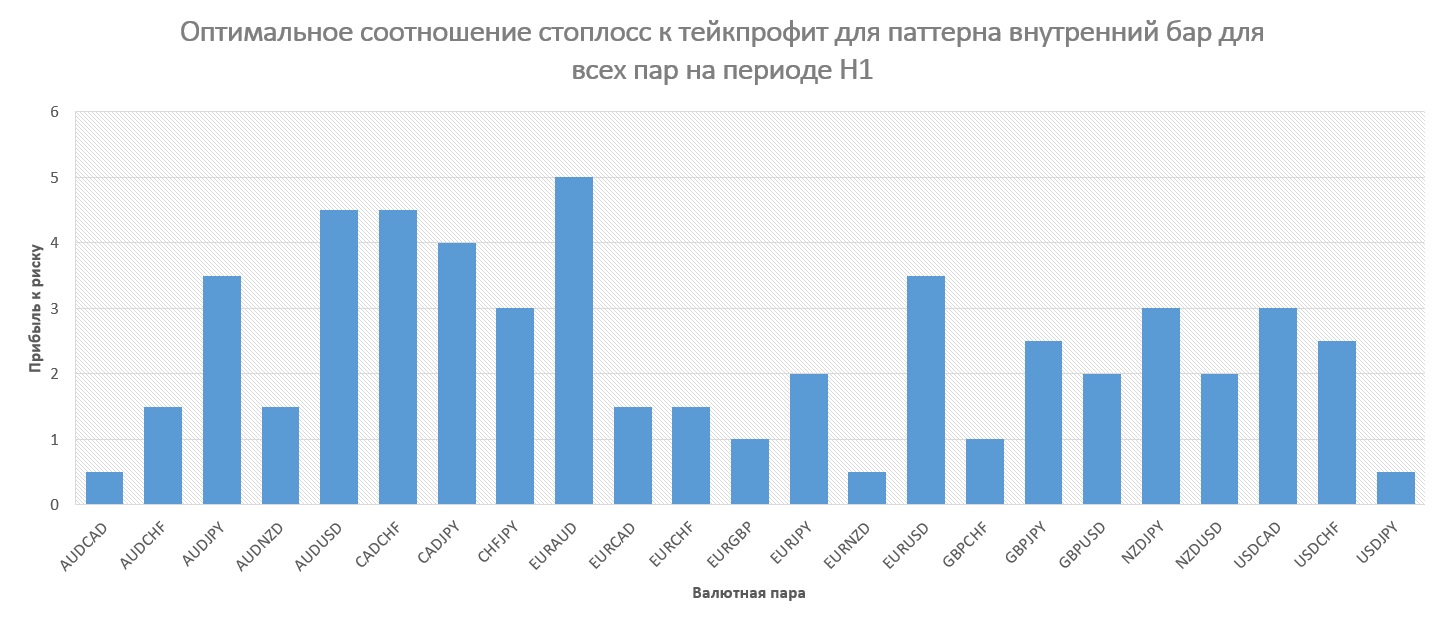
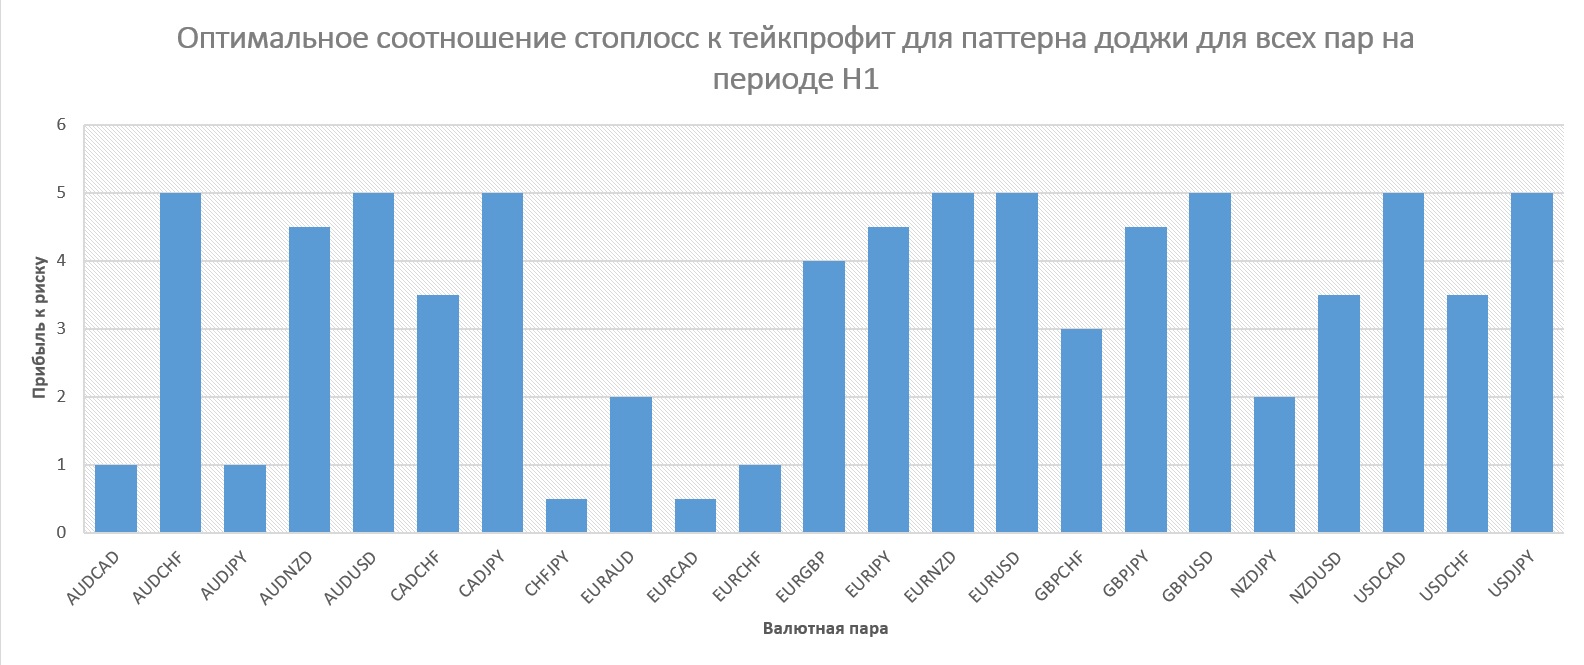
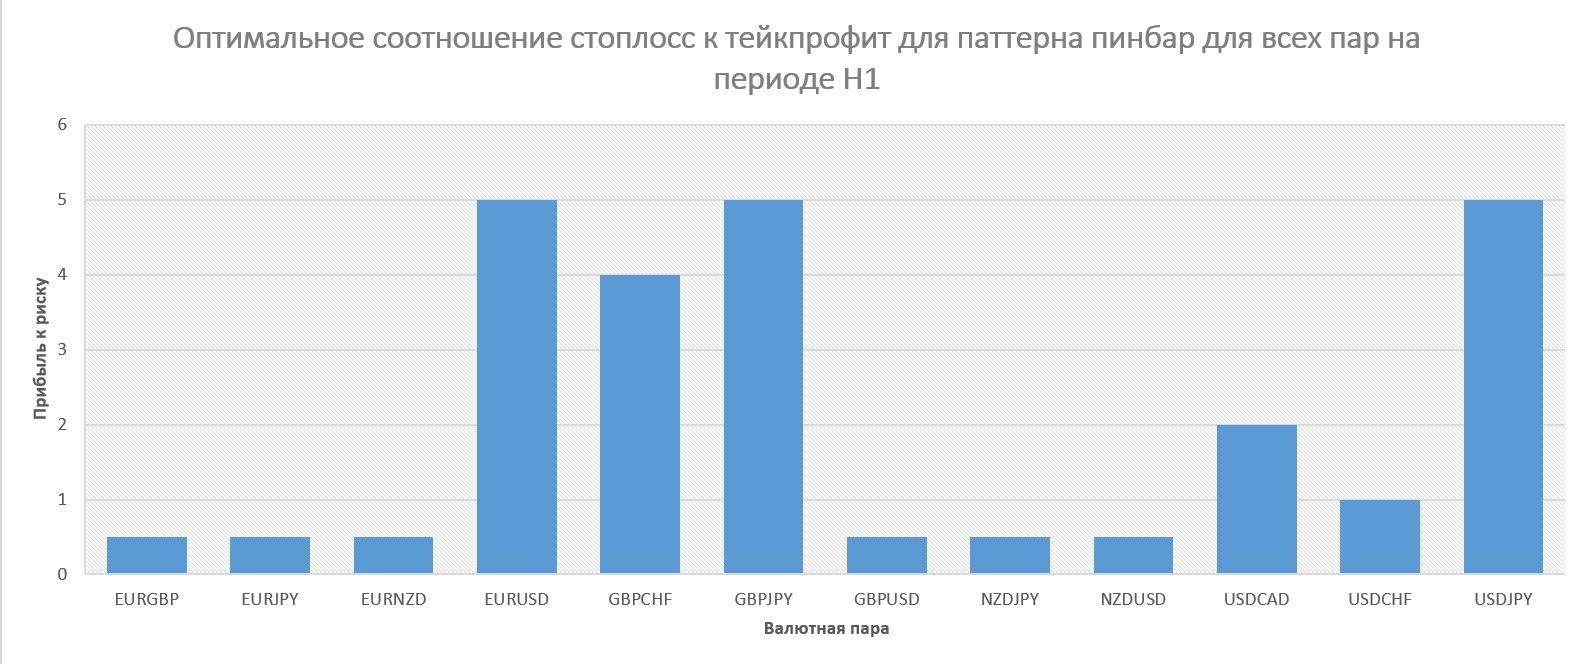
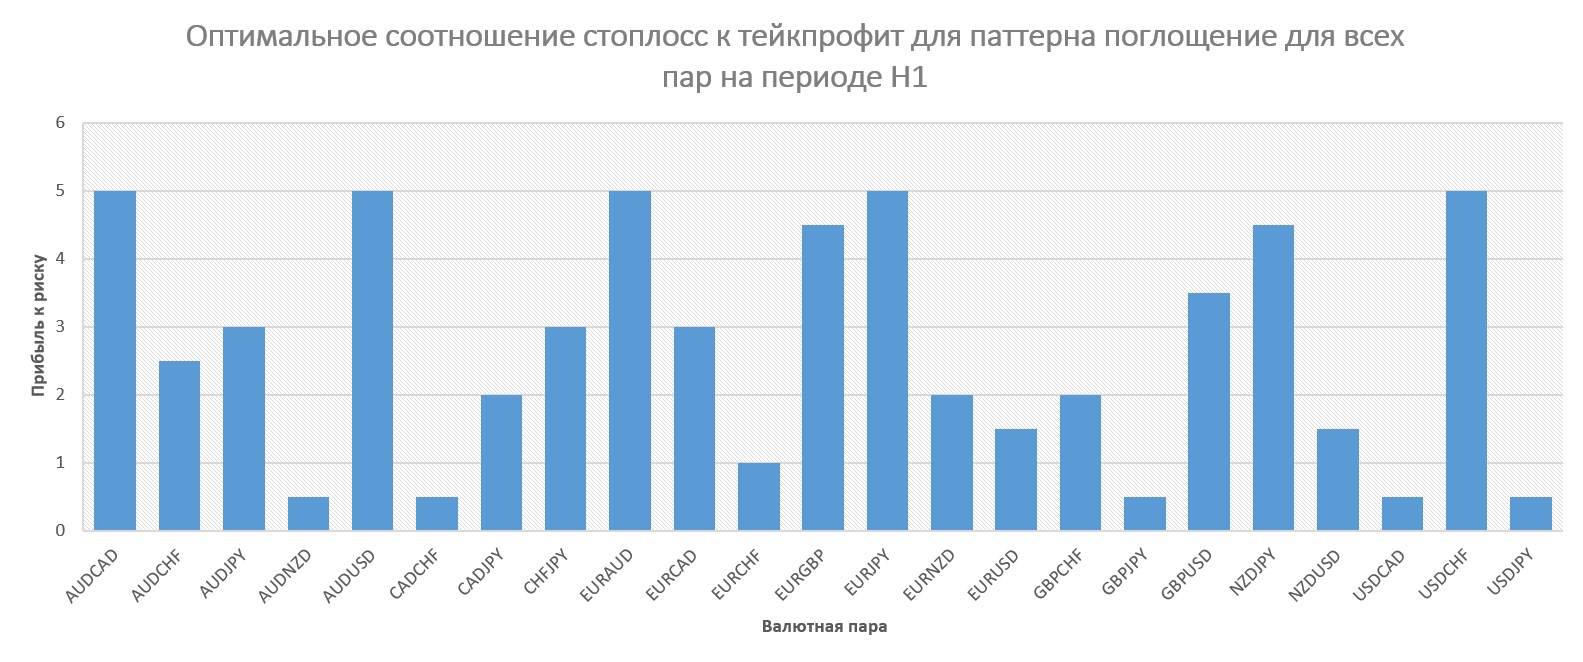
As can be seen, the optimal profit-to-loss ratio averages 3 to 1 - 4 to 1.
Profitability by days of the week:
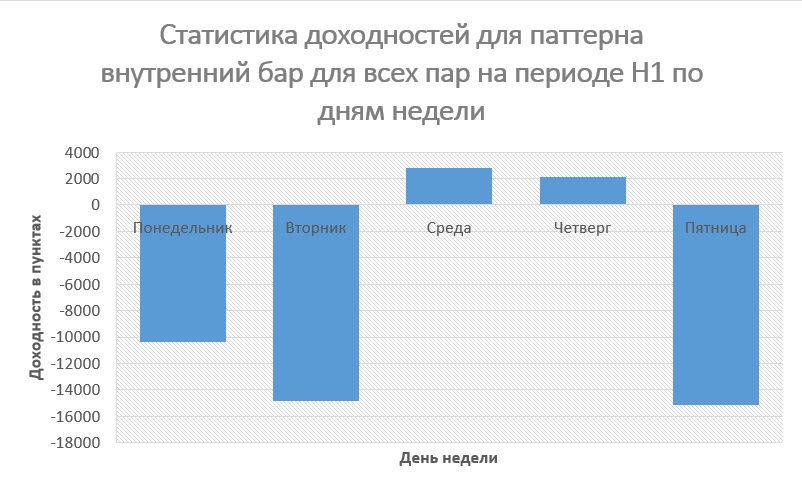
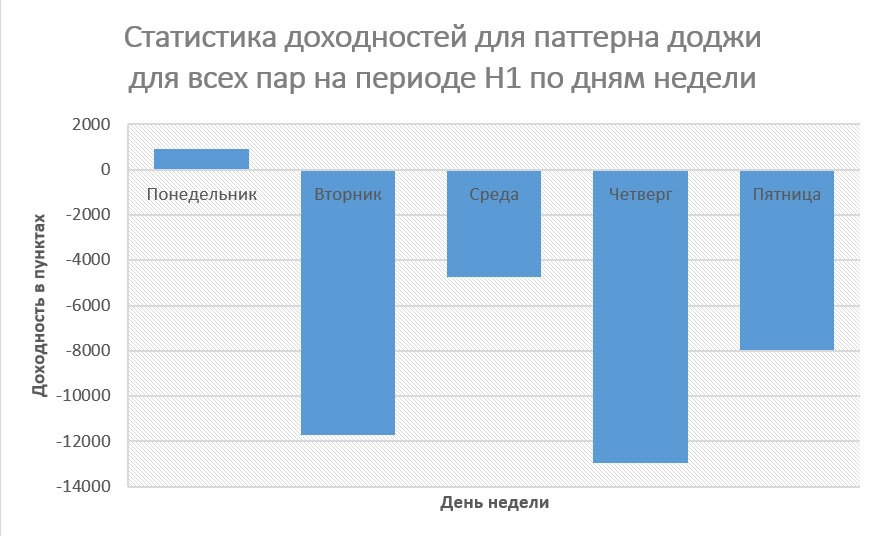
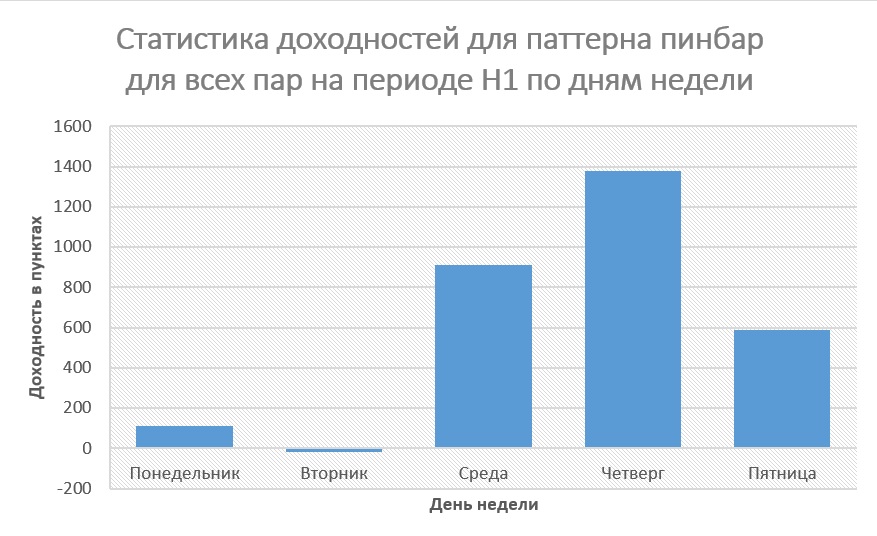
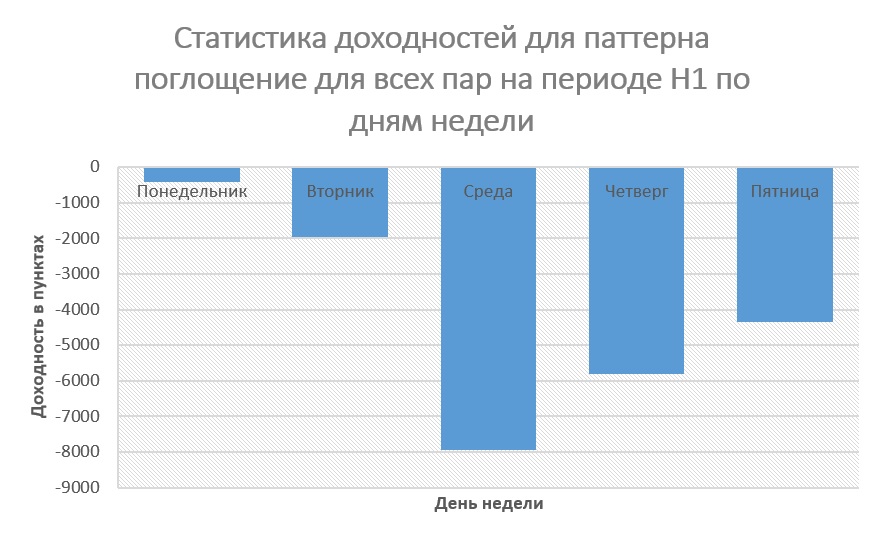
For entry on the doji pattern on the H1 period, the middle of the week is most optimal; when working with the pin bar, the optimal time is from the middle to the end of the week; when entering on the other patterns, the beginning of the week.
Profitability by days of the month
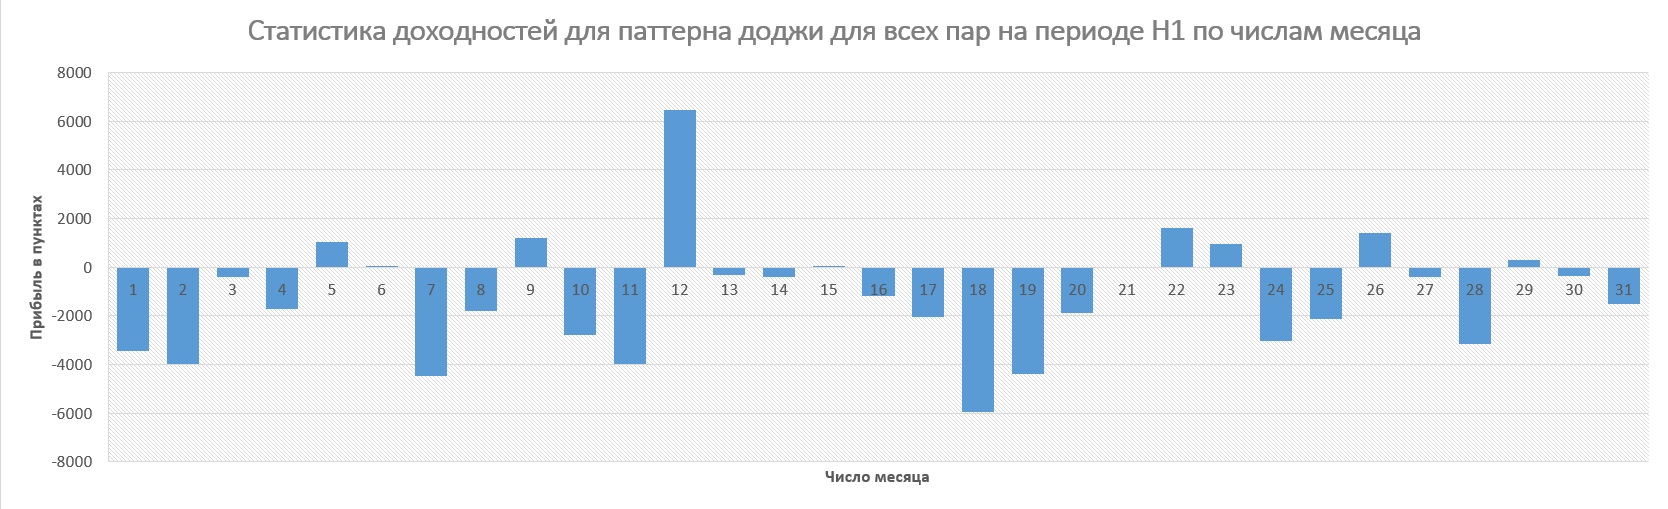
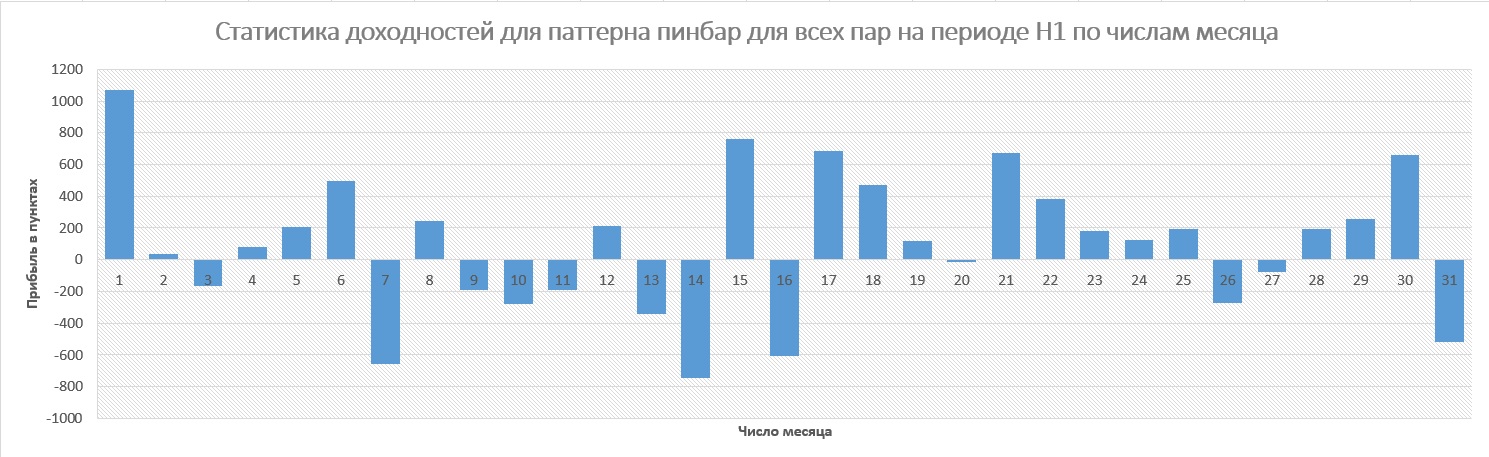
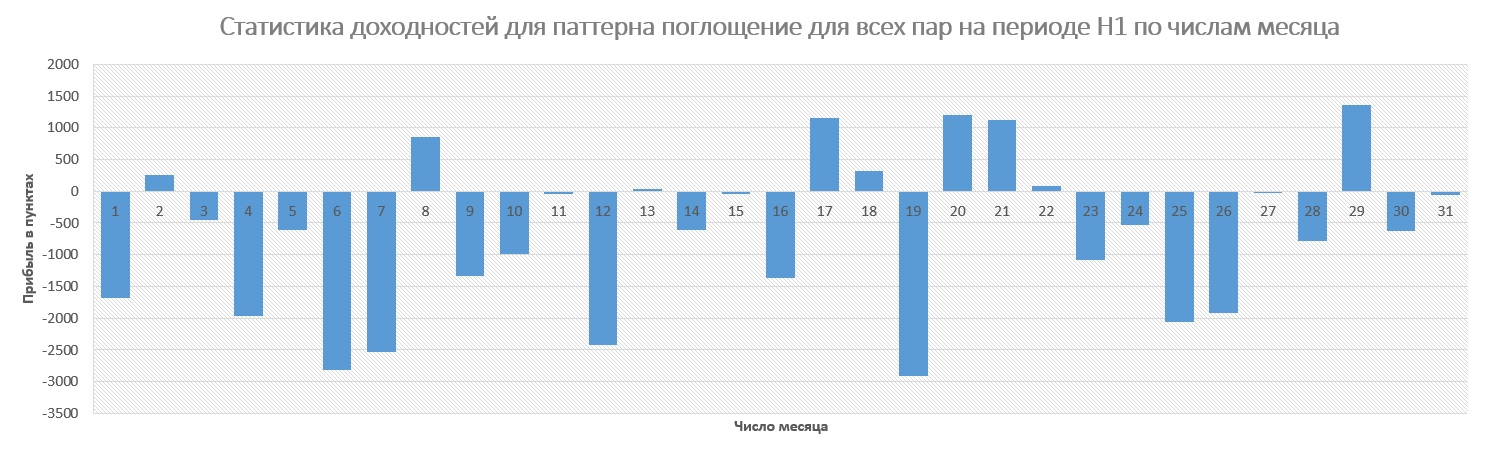
By the days of the month, I do not see any dependence.
Profitability by months of the year:
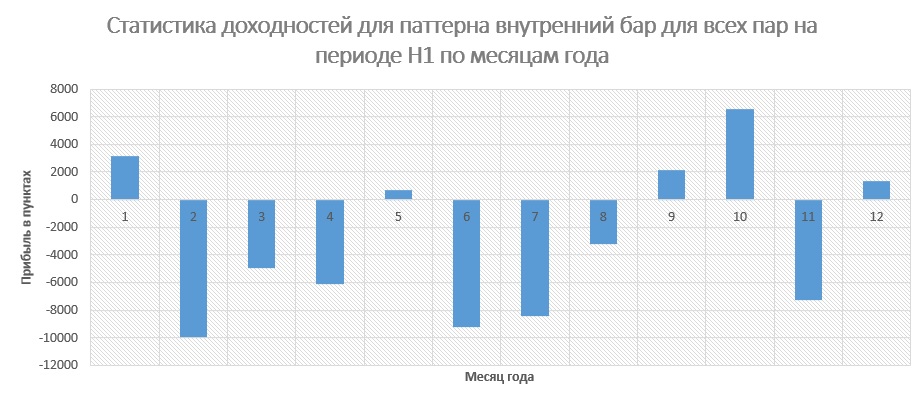
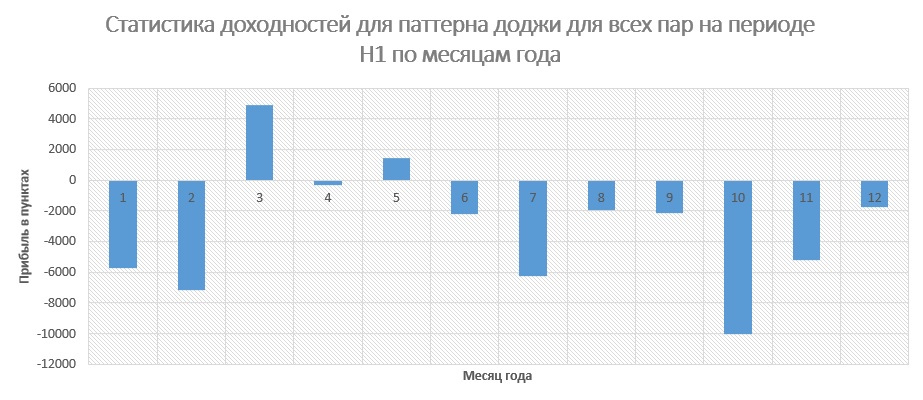
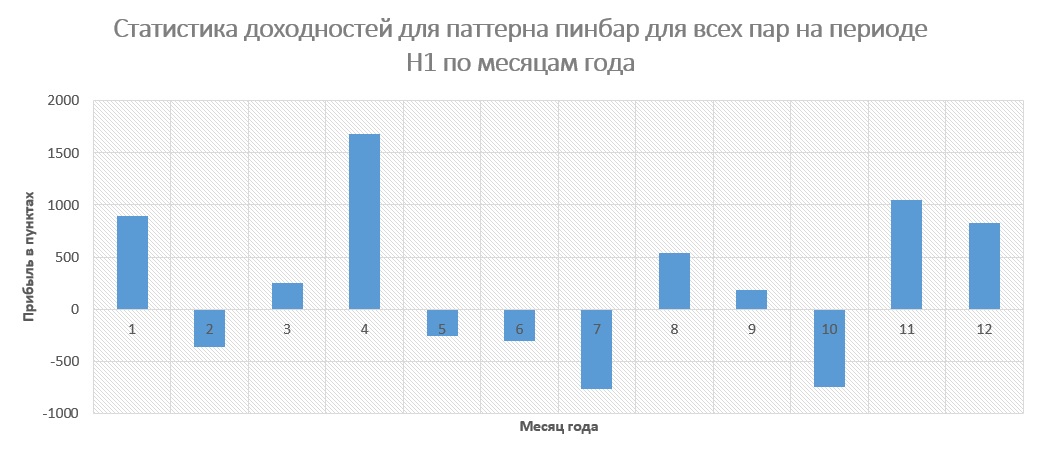
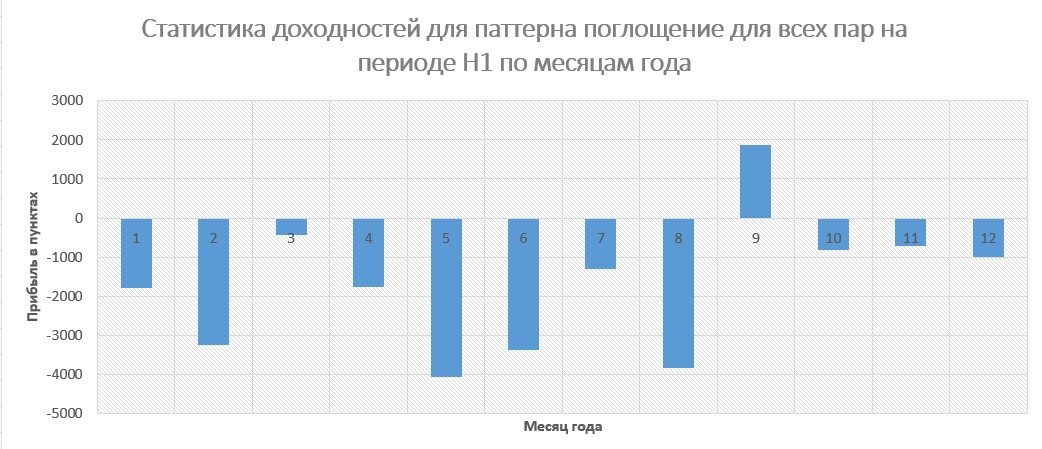
I do not observe any definite correlation by months of the year, except that in the summer months the patterns work worse. Perhaps this is due to the traditional sluggishness of the markets in these months.
On the H1 period, most Price Action patterns do not work without additional confirmation. The only exception is the pin bar, but its profitability is too low.

H4 Period
Profitability charts:
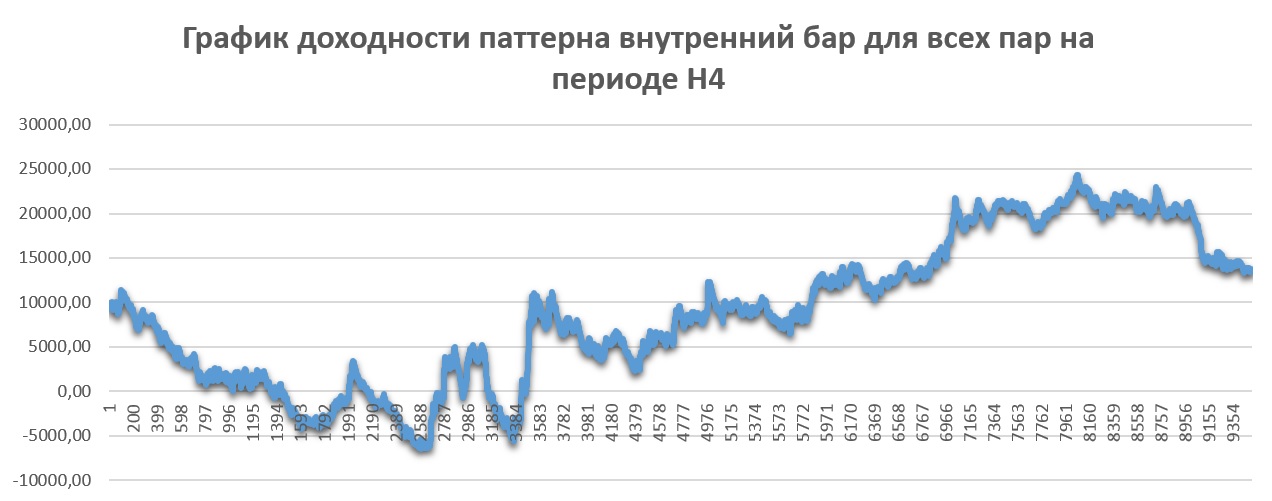
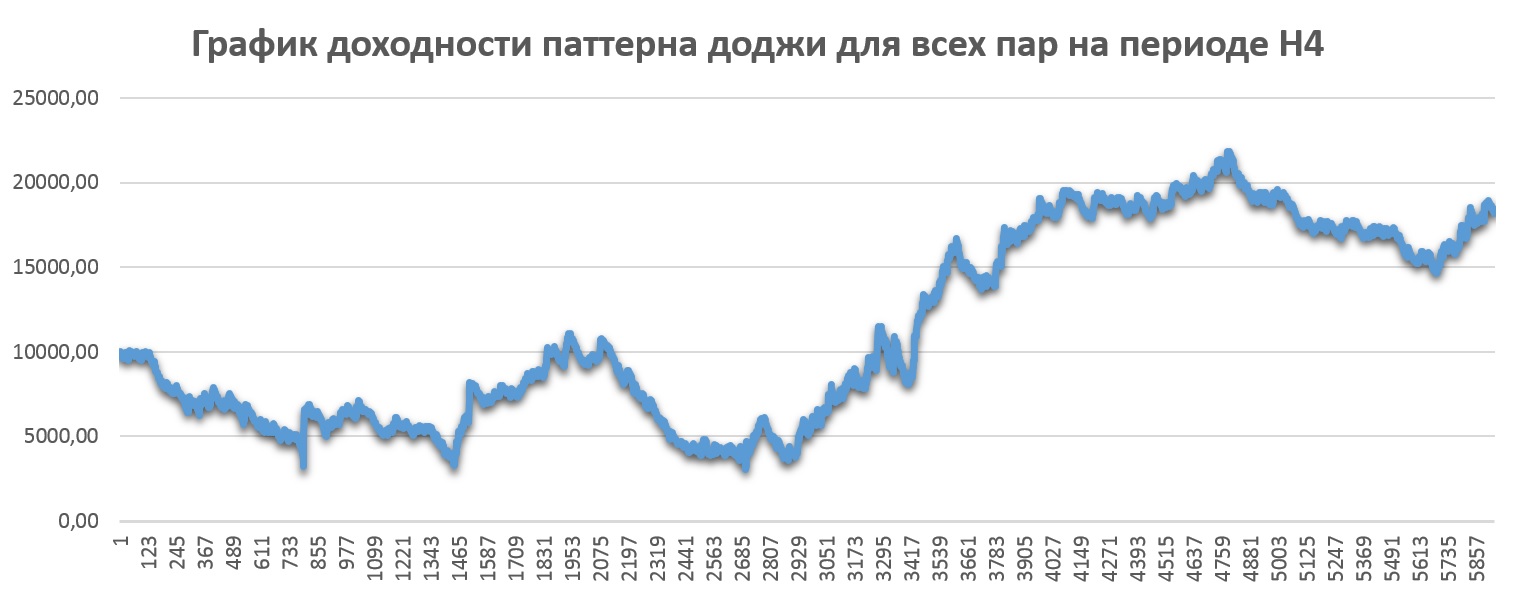
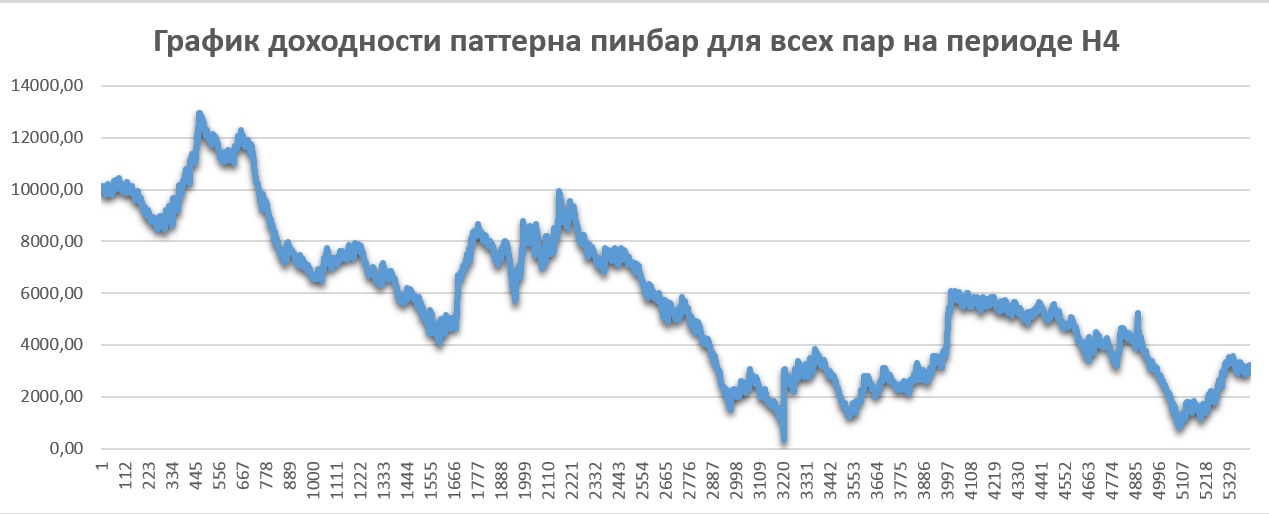
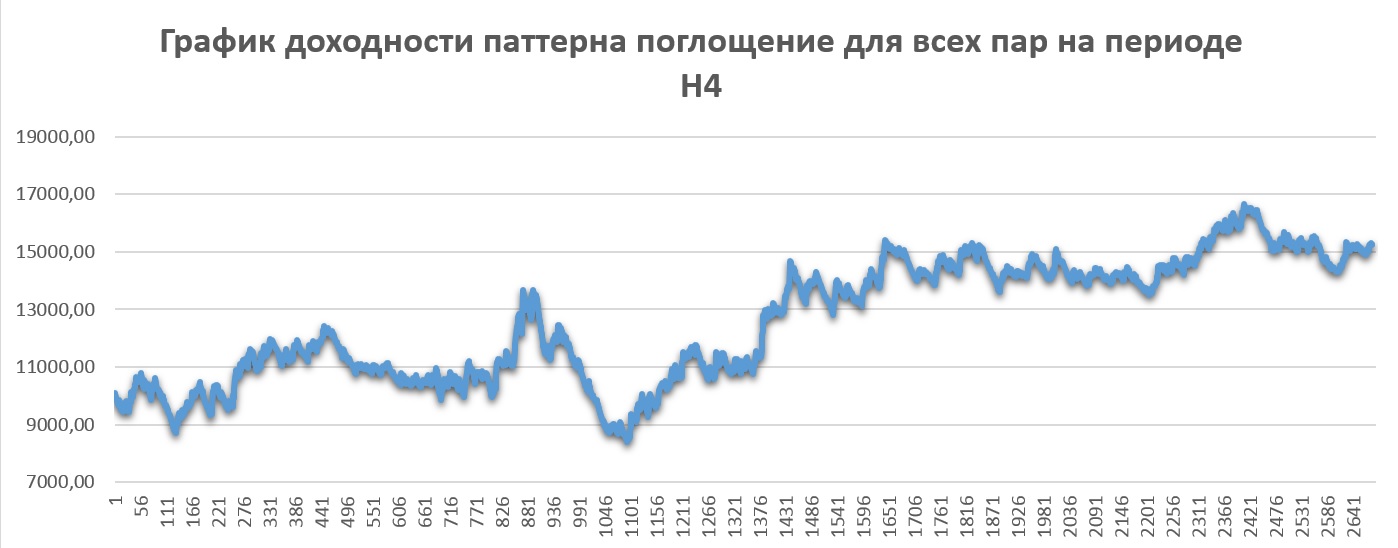
Quite strangely, on the H4 period the picture is the opposite of what we saw on H1. Now the main part of the patterns are profitable, except for the pin bar. Nevertheless, such trading still cannot be called successful - additional filtering is still required.
Optimal stop-loss to take-profit ratios:
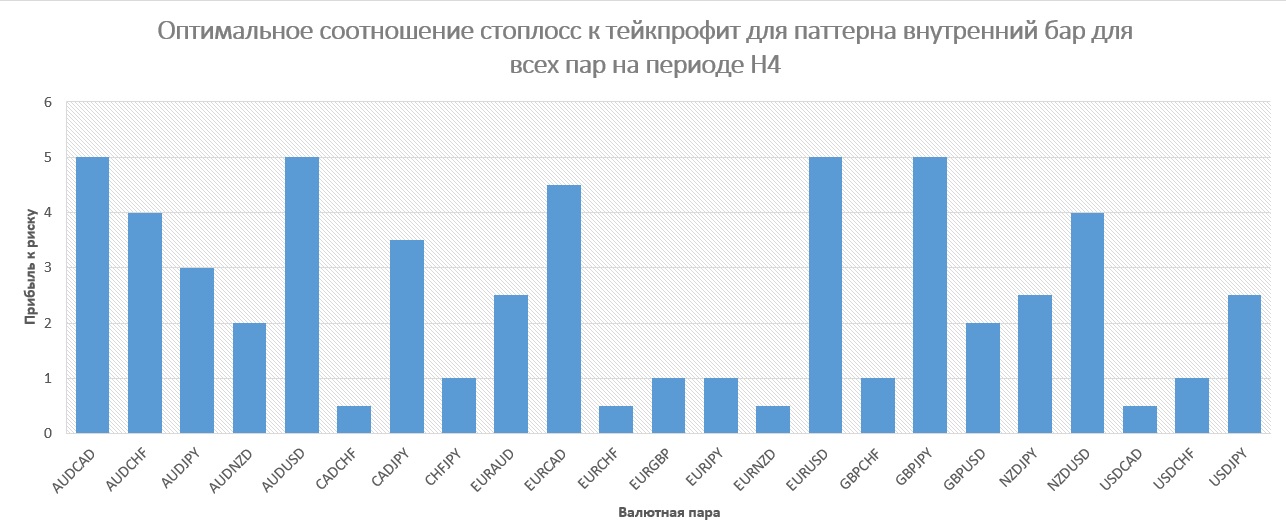
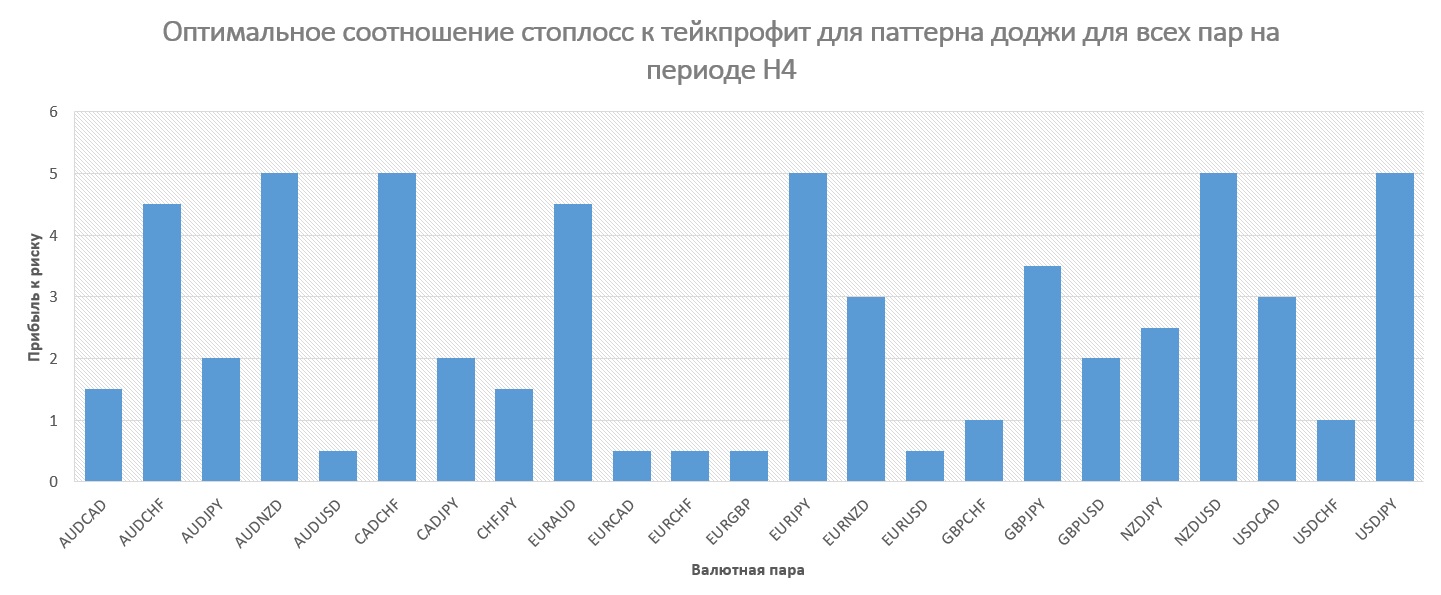
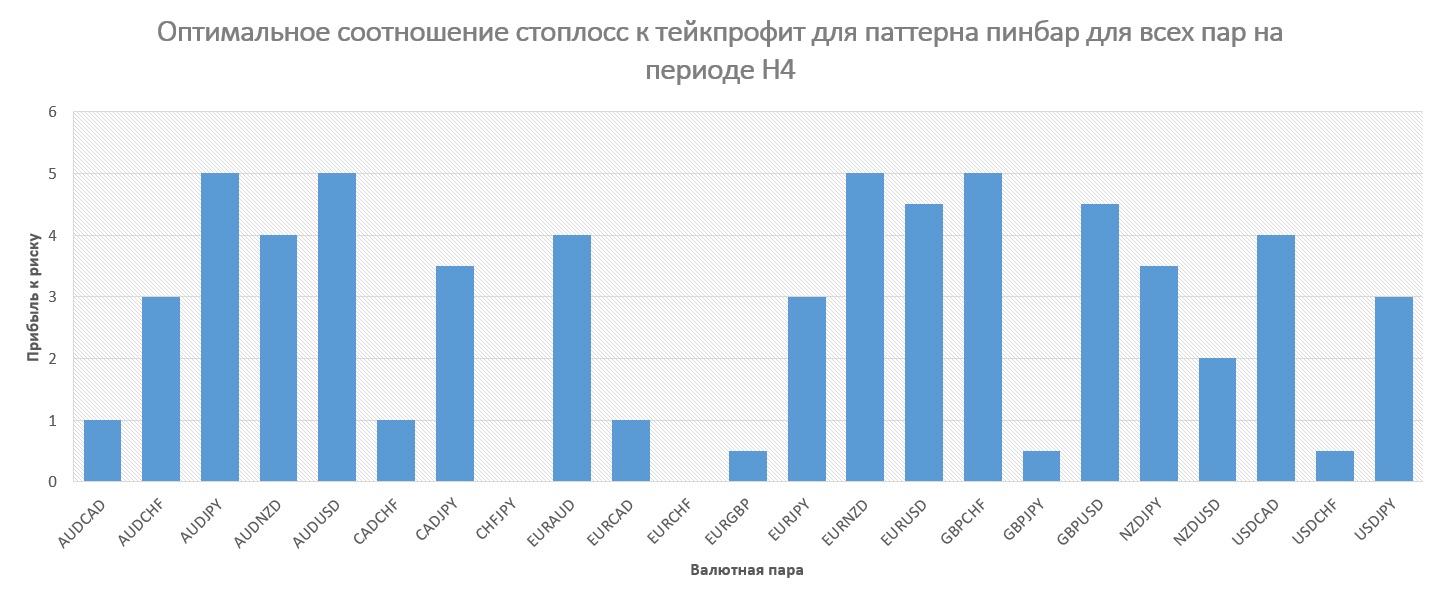
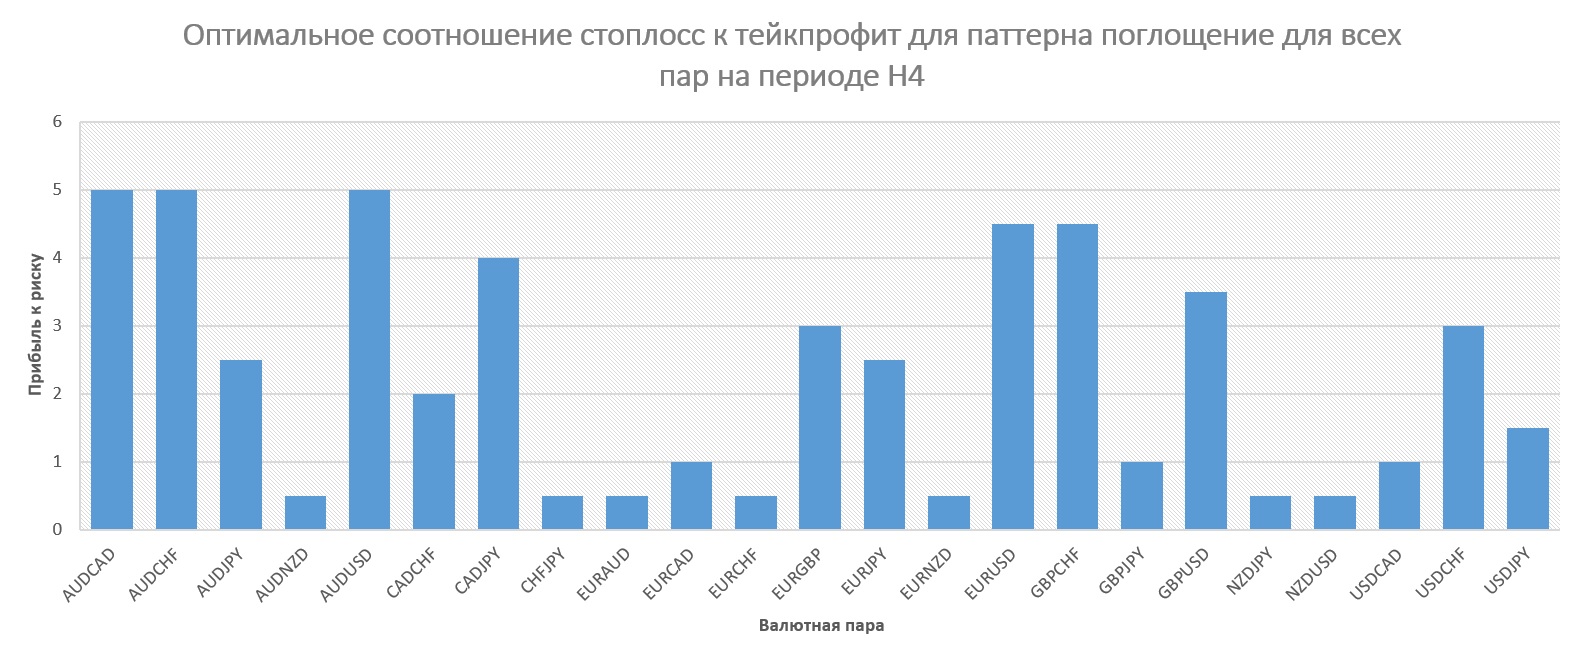
The optimal profit-to-loss ratio still averages from 3 to 1 to 4 to 1.
Profitability by day of the week:
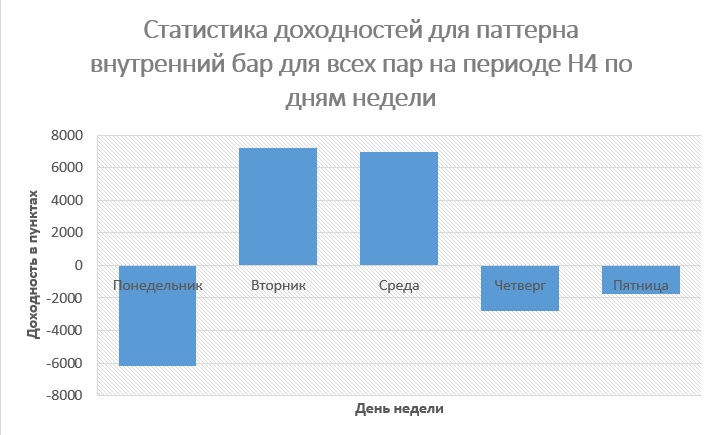
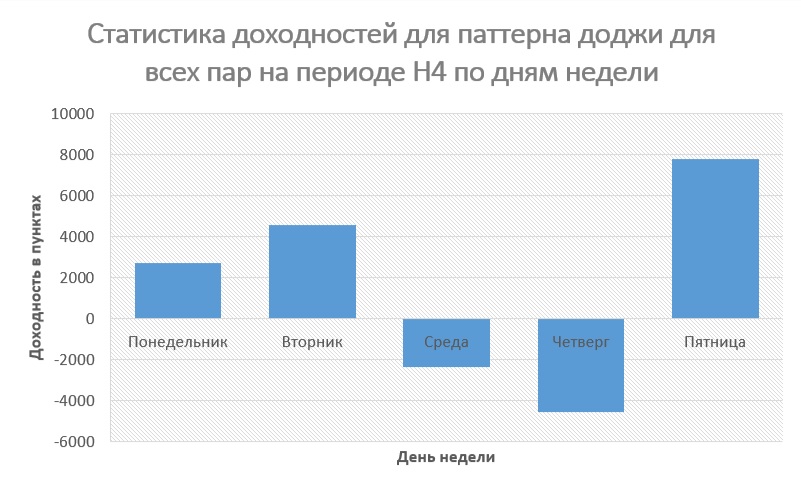
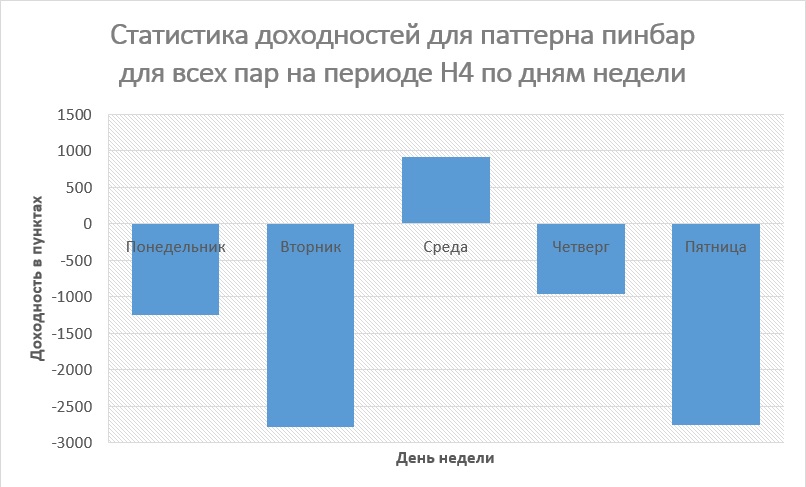
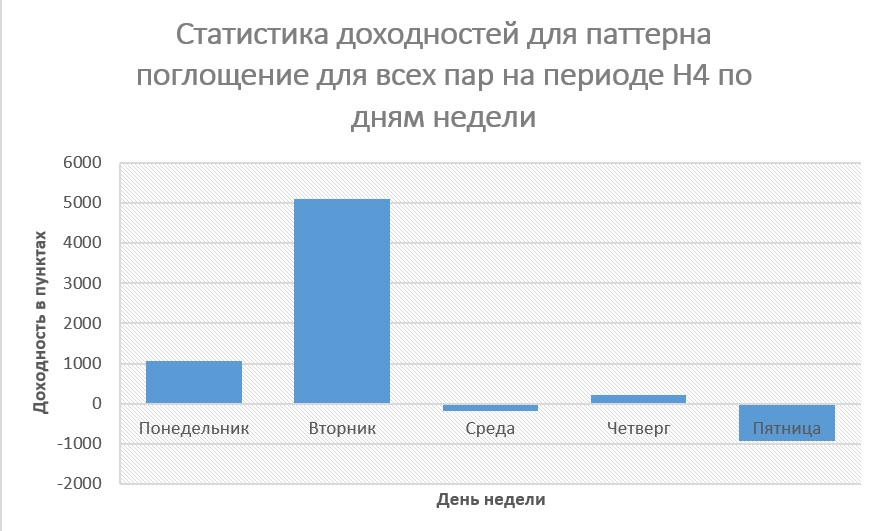
For entries based on the doji and engulfing patterns on the H4 period, Monday and Tuesday are the most optimal; when working with the pin bar and inside bar, the middle of the week is best. The doji pattern also brings good profit when entering on Friday.
Profitability by day of the month:
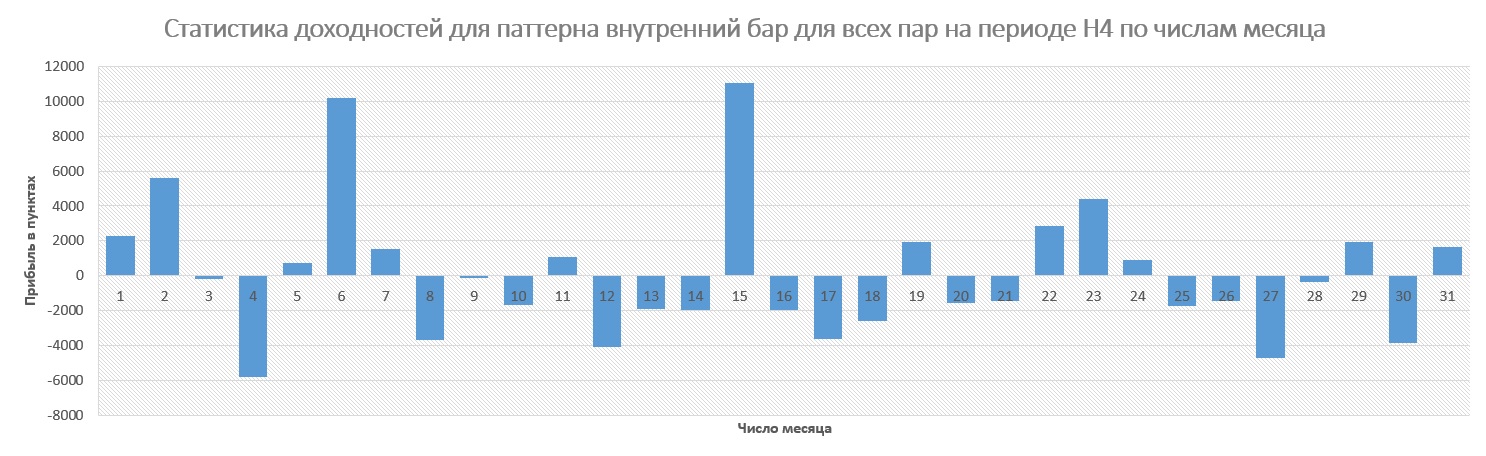
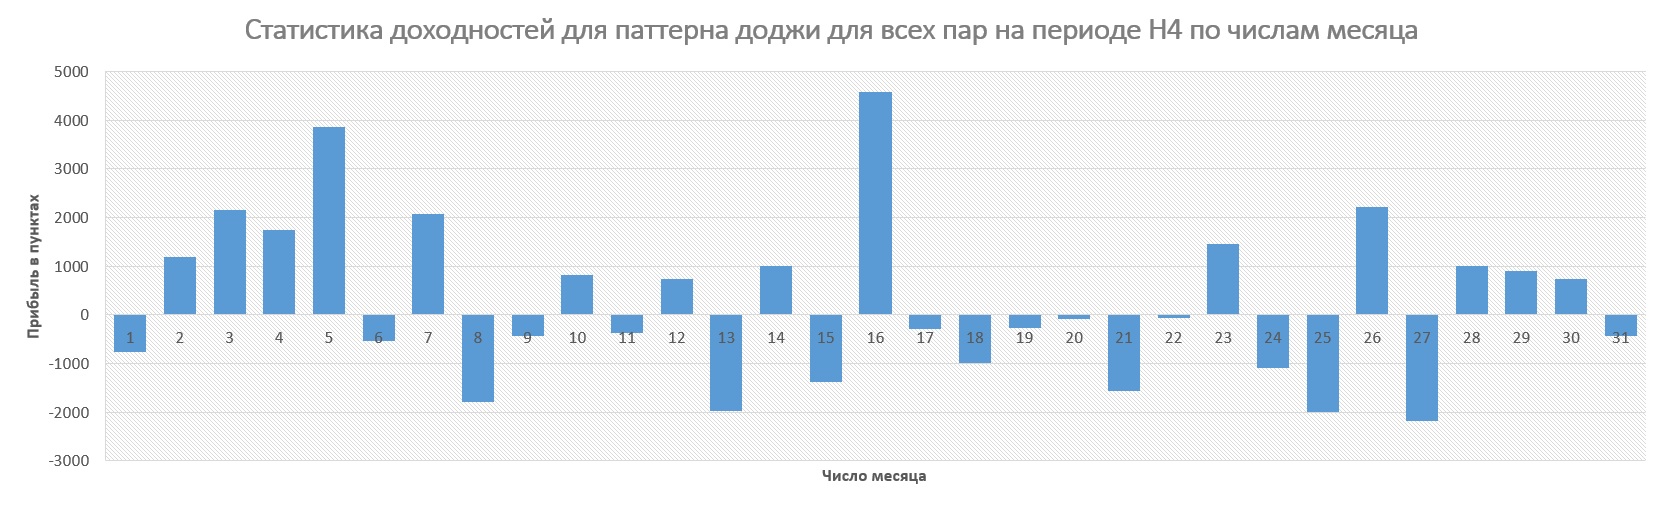
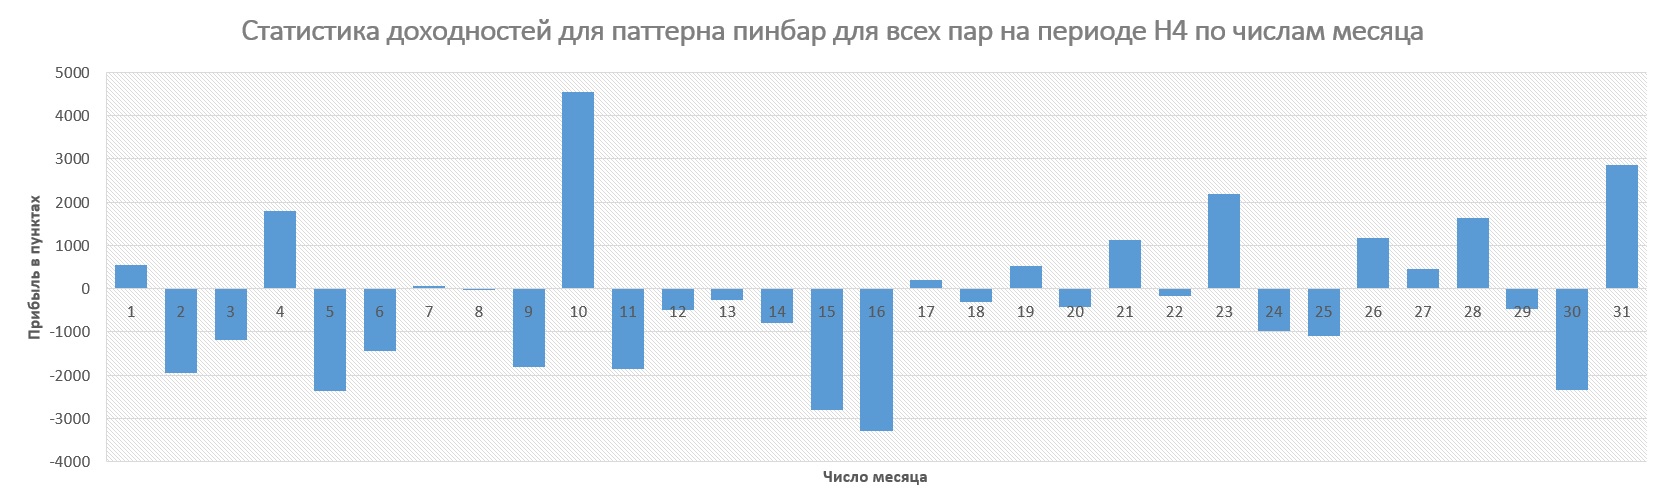
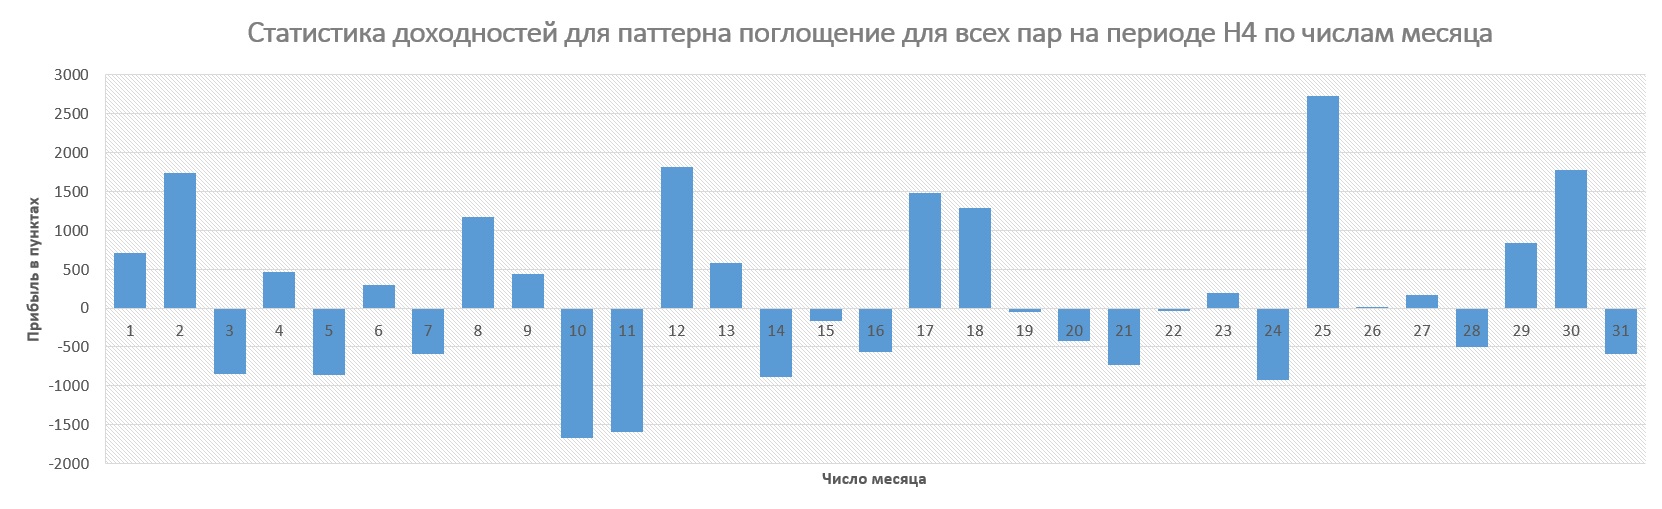
And again, no obvious correlation can be traced.
Profitability by month of the year:
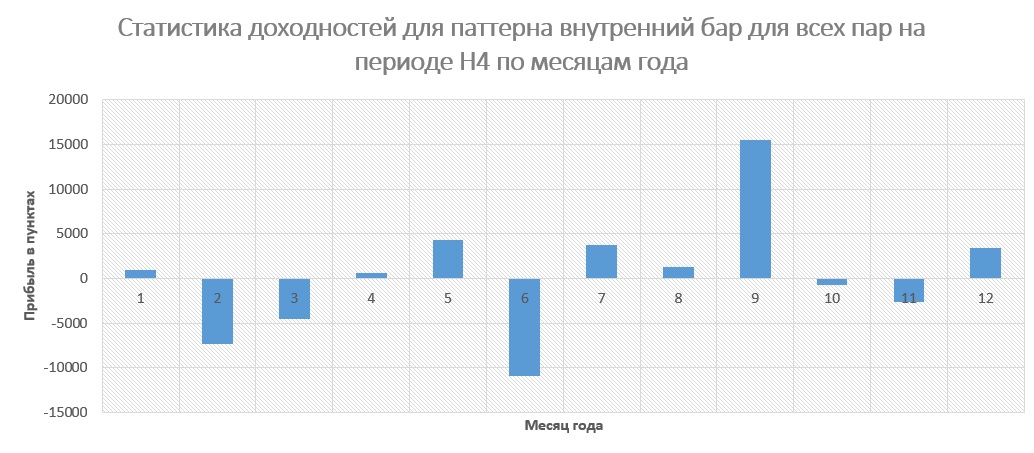
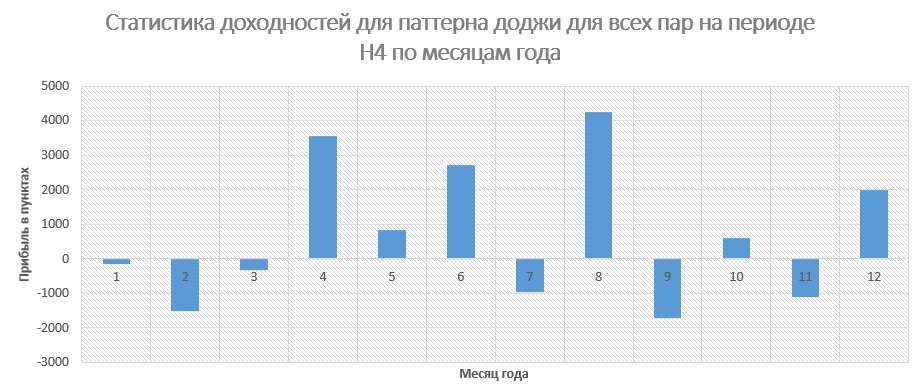
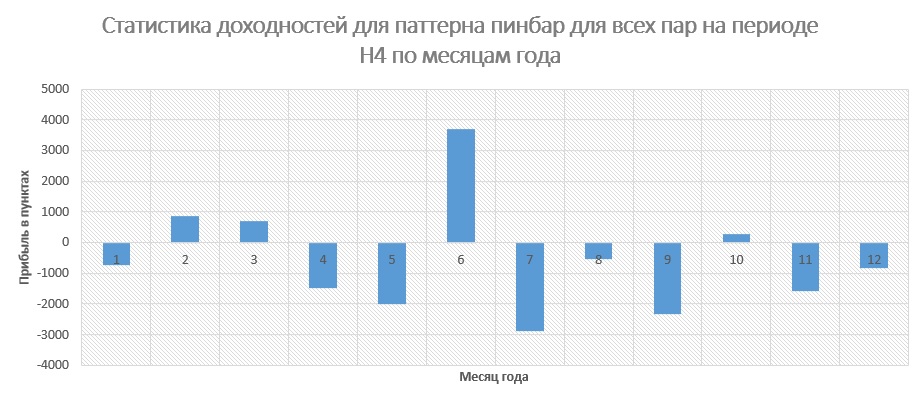
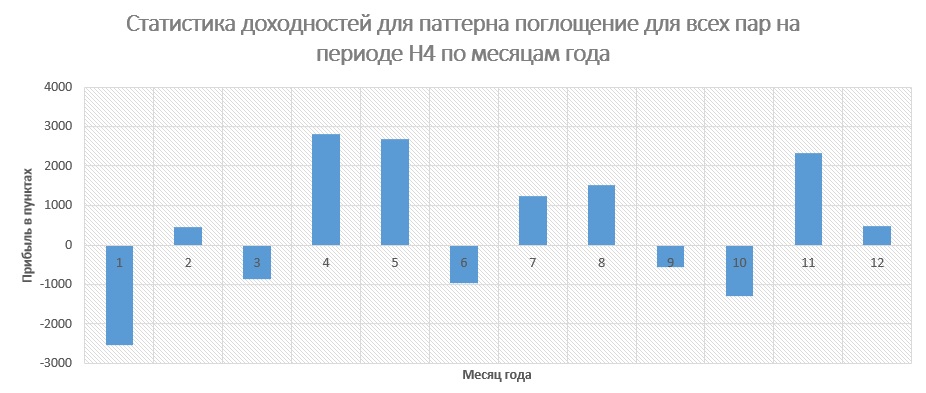
In the case of H4, there is absolutely no dependence of pattern effectiveness on the month of the year.
On the H4 period, most Price Action patterns bring little profit without additional confirmation. Trading the pin bar is completely unsuccessful.

Period D1
Return charts:
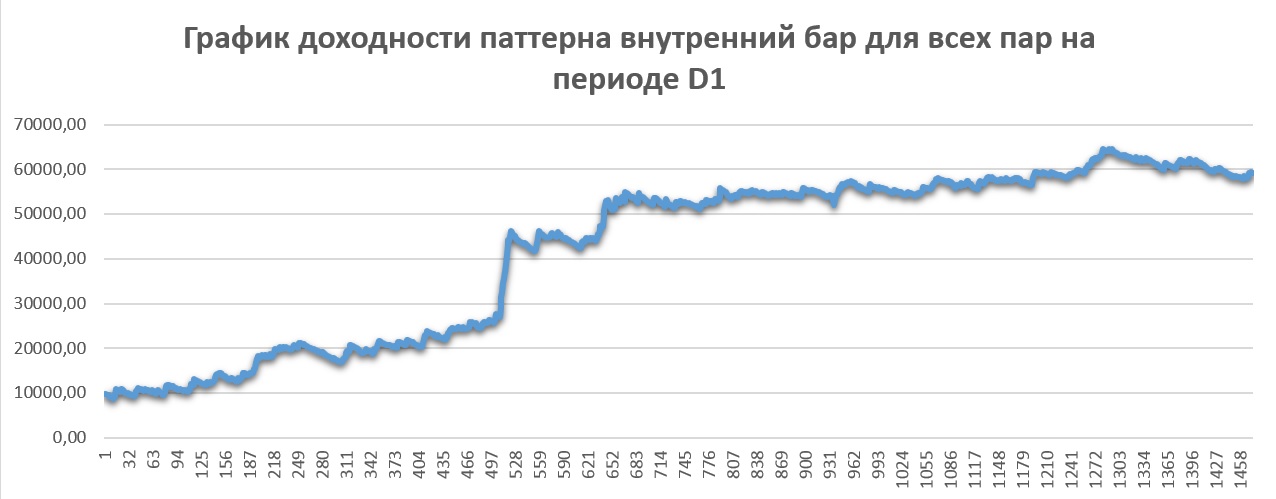
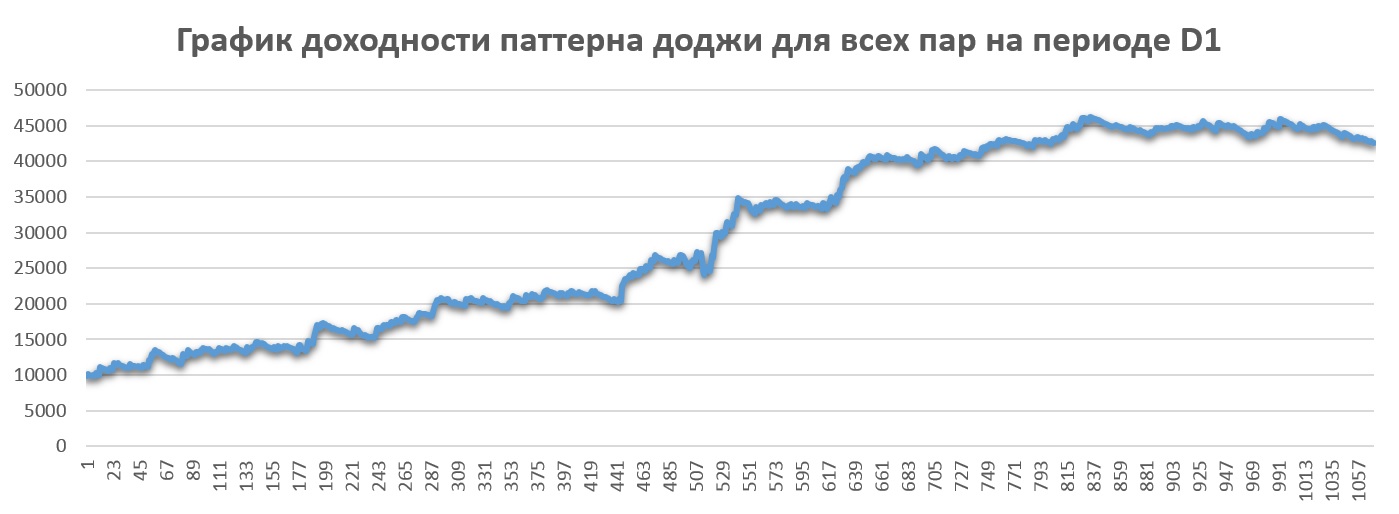
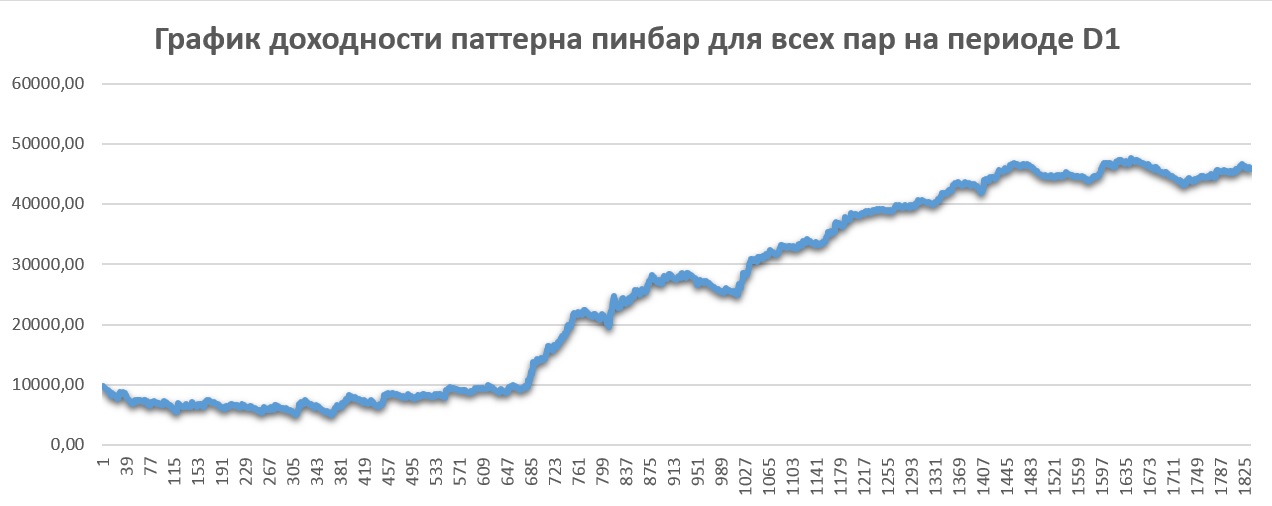
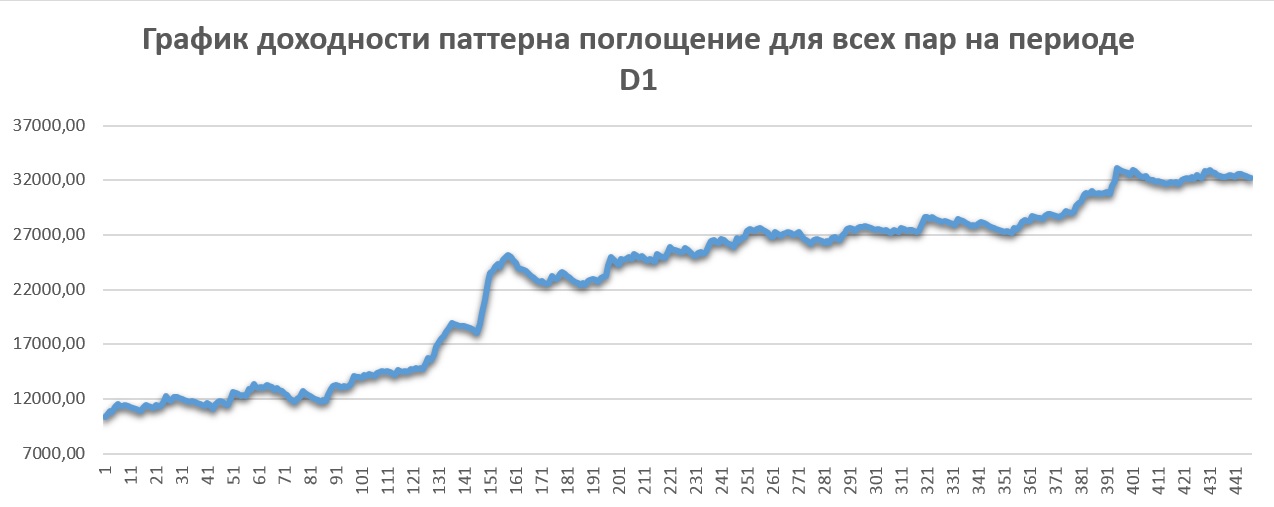
Trading any of the patterns, even without additional filtering and without taking levels and trend into account, on the D1 timeframe can bring stable profit.
Optimal stop-to-take-profit ratios:
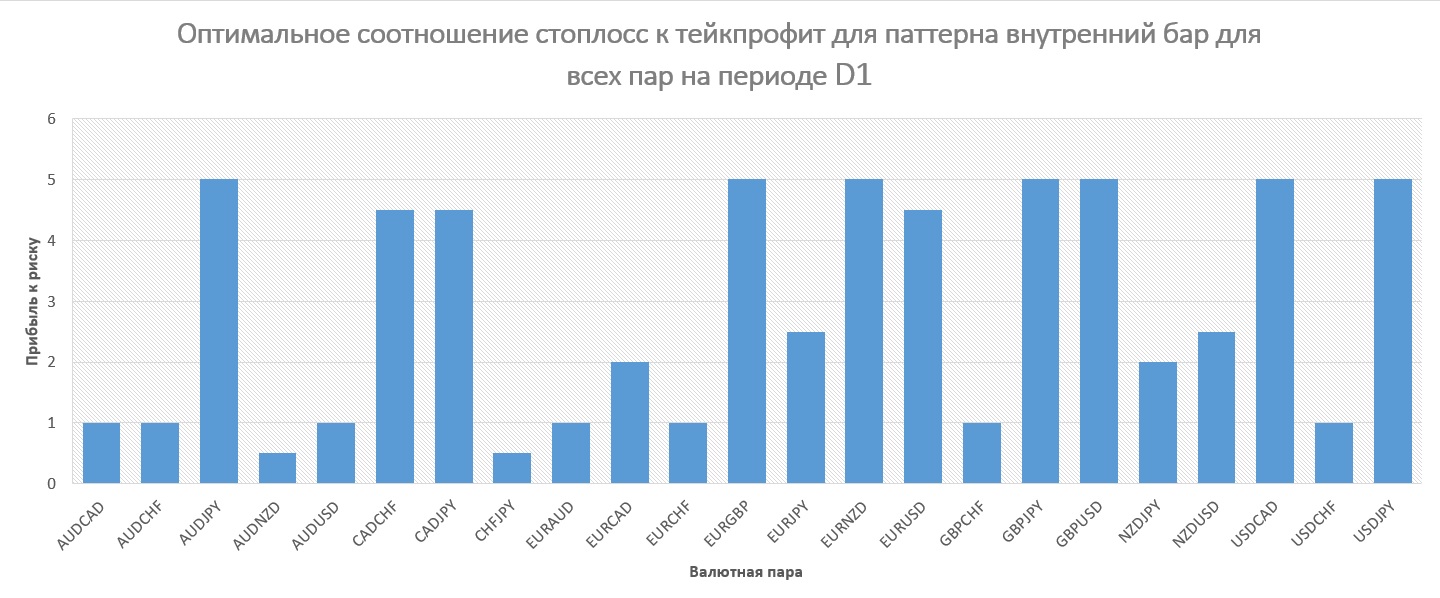
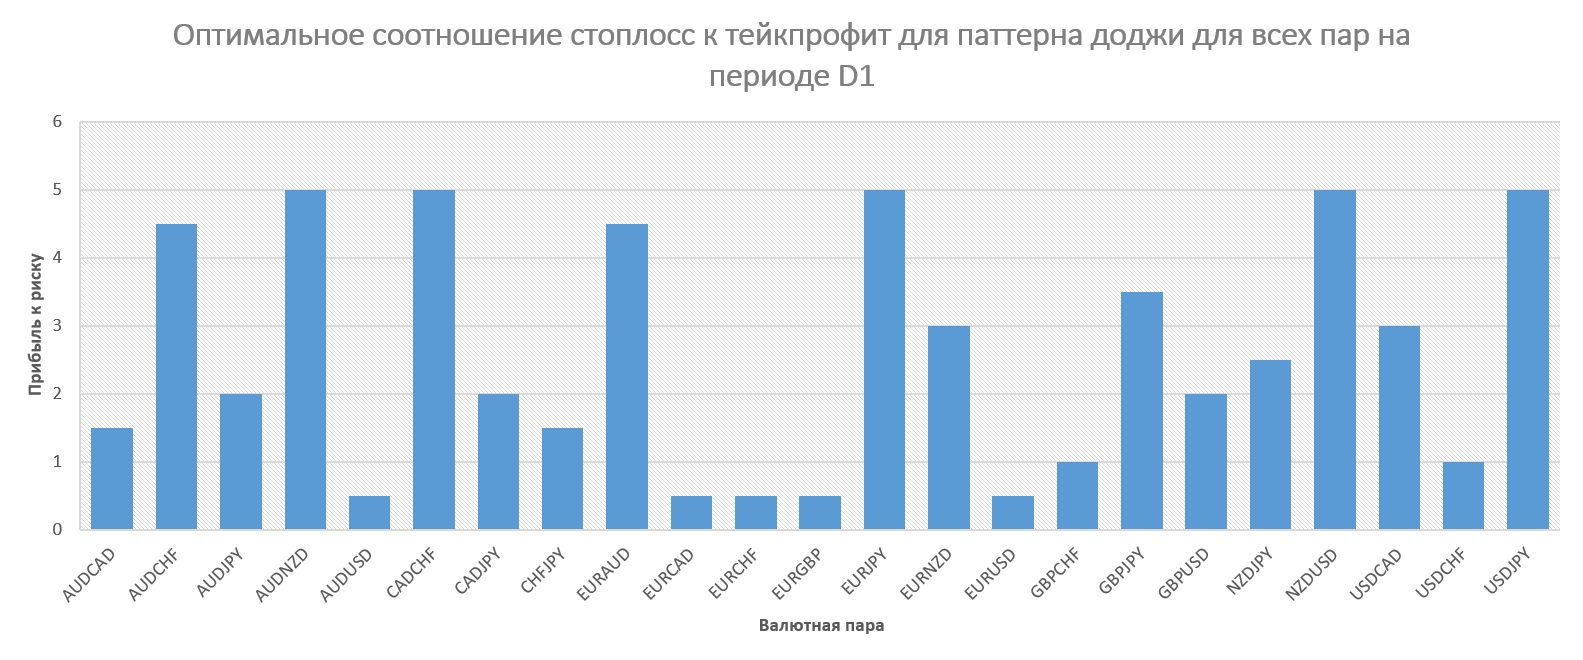
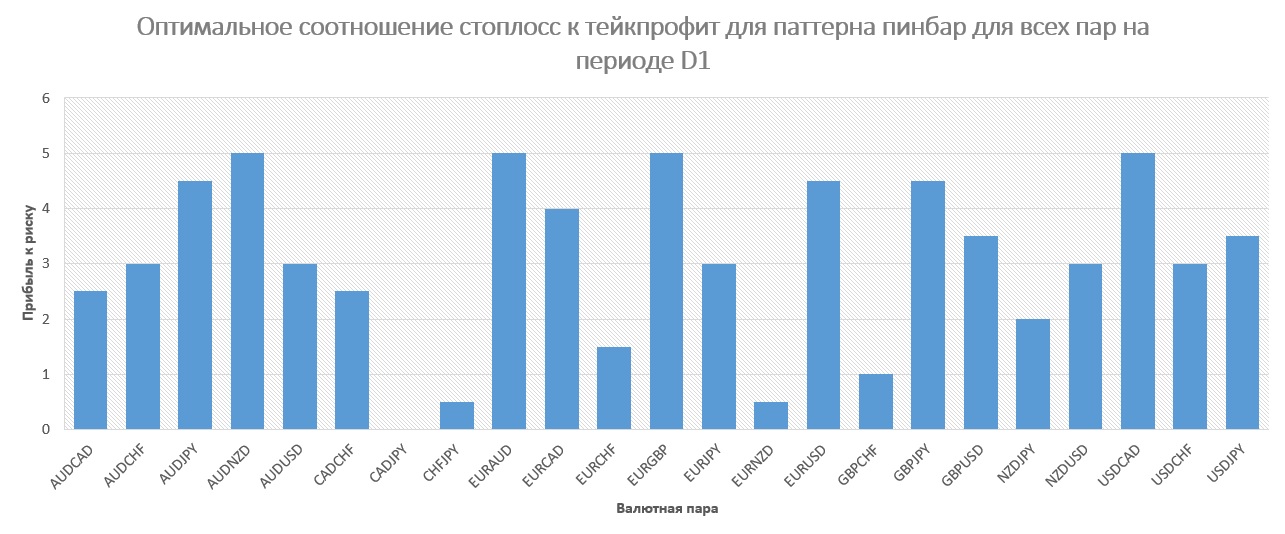
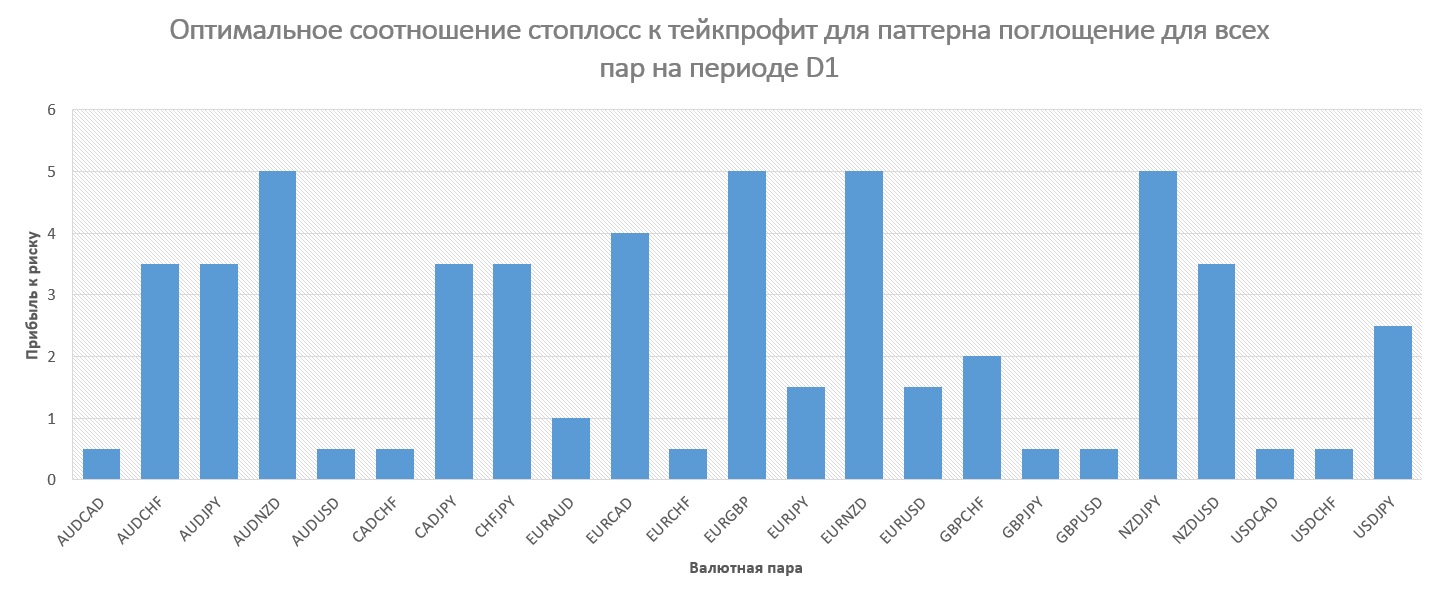
The optimal profit-to-loss ratio has not changed and still averages from 3 to 1 to 4 to 1.
Returns by day of the week:
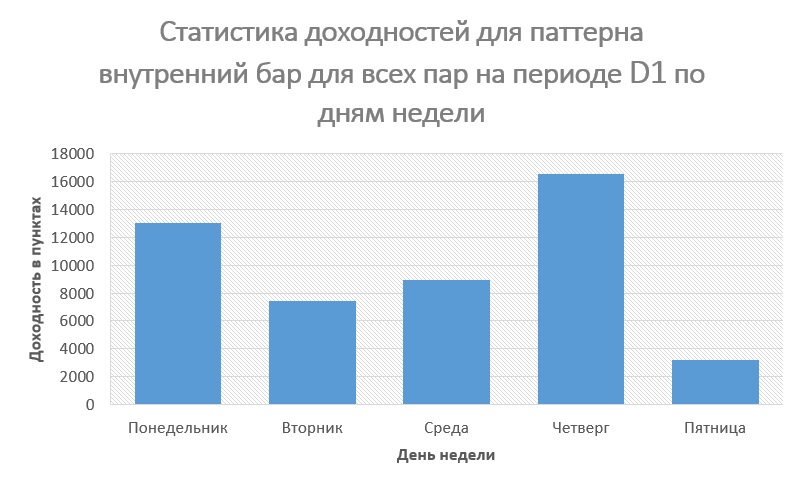
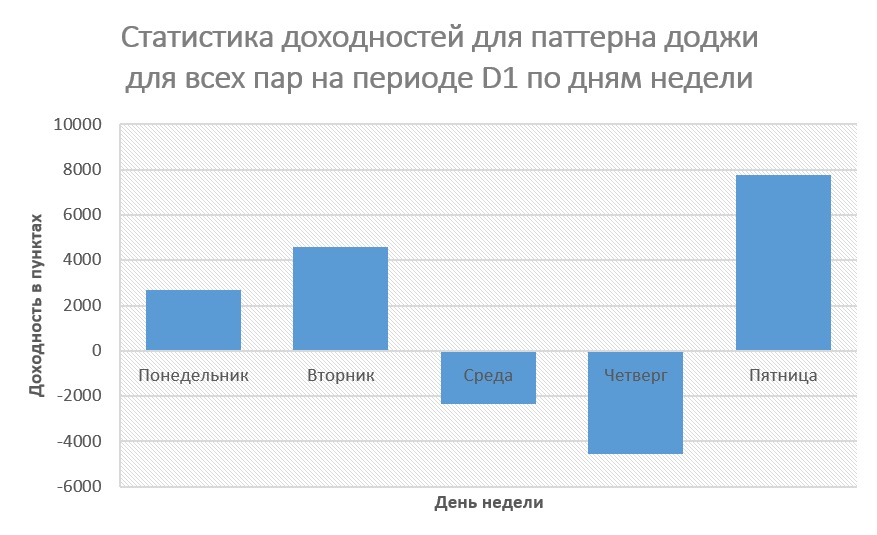
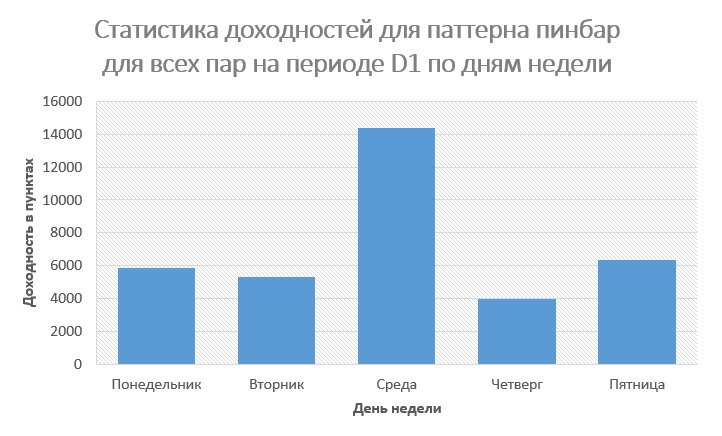
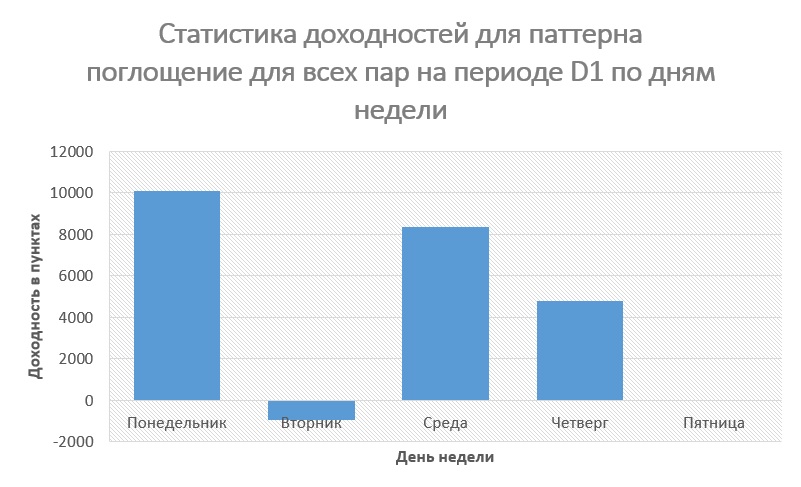
The inside bar on the D1 timeframe works poorly when the signal comes on Friday, while the doji does poorly on Wednesday and Thursday. The pin bar is best taken on Wednesday. The engulfing pattern works properly on Monday, Wednesday, and Thursday.
Returns by days of the month:
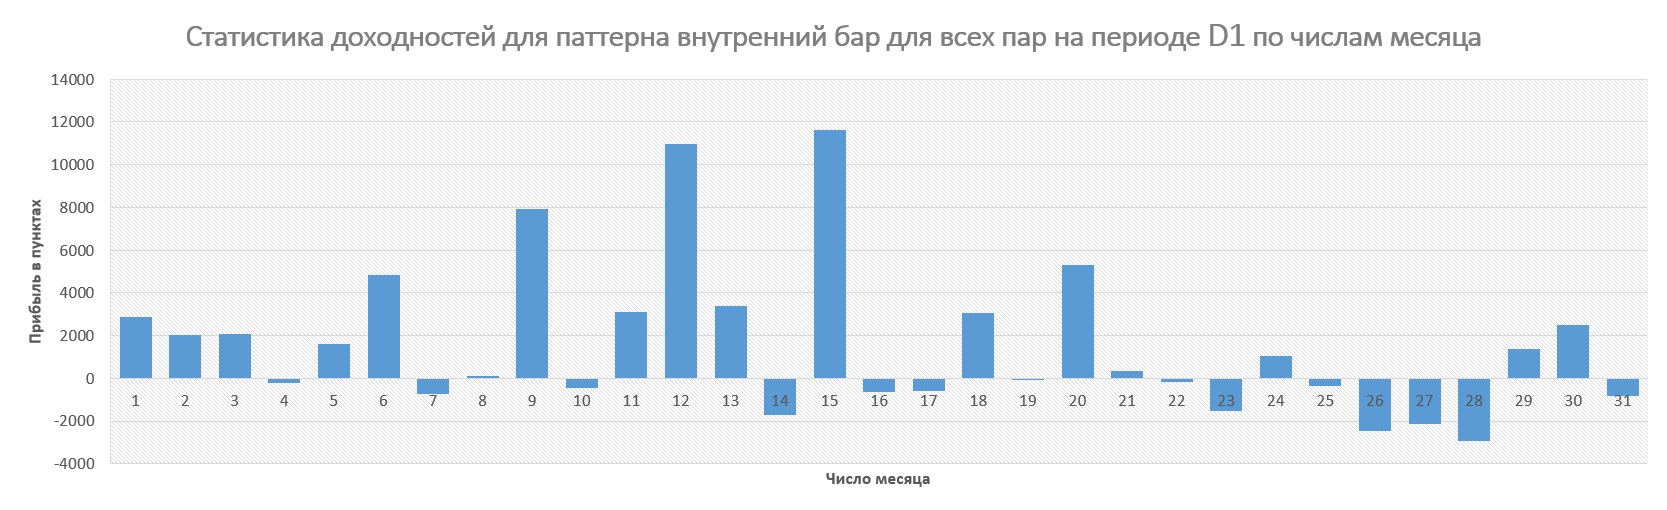
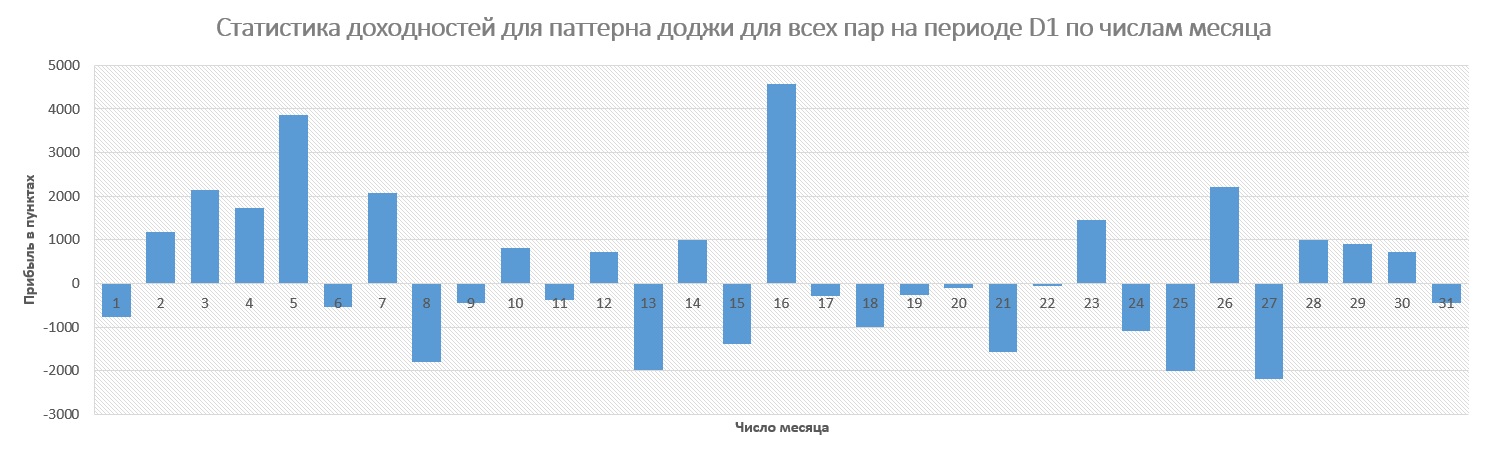
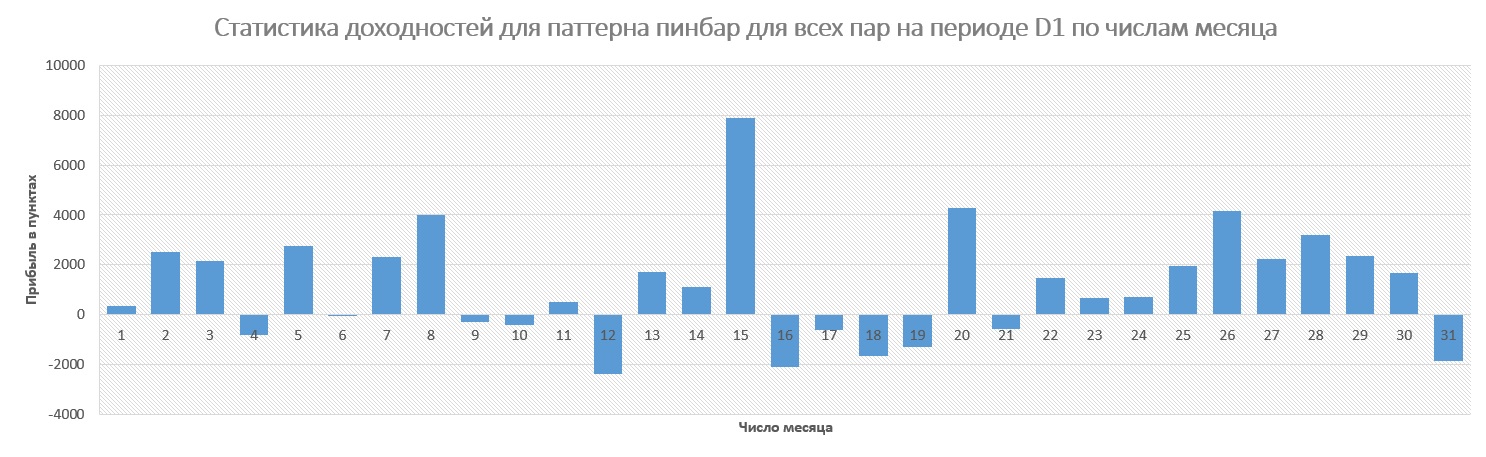
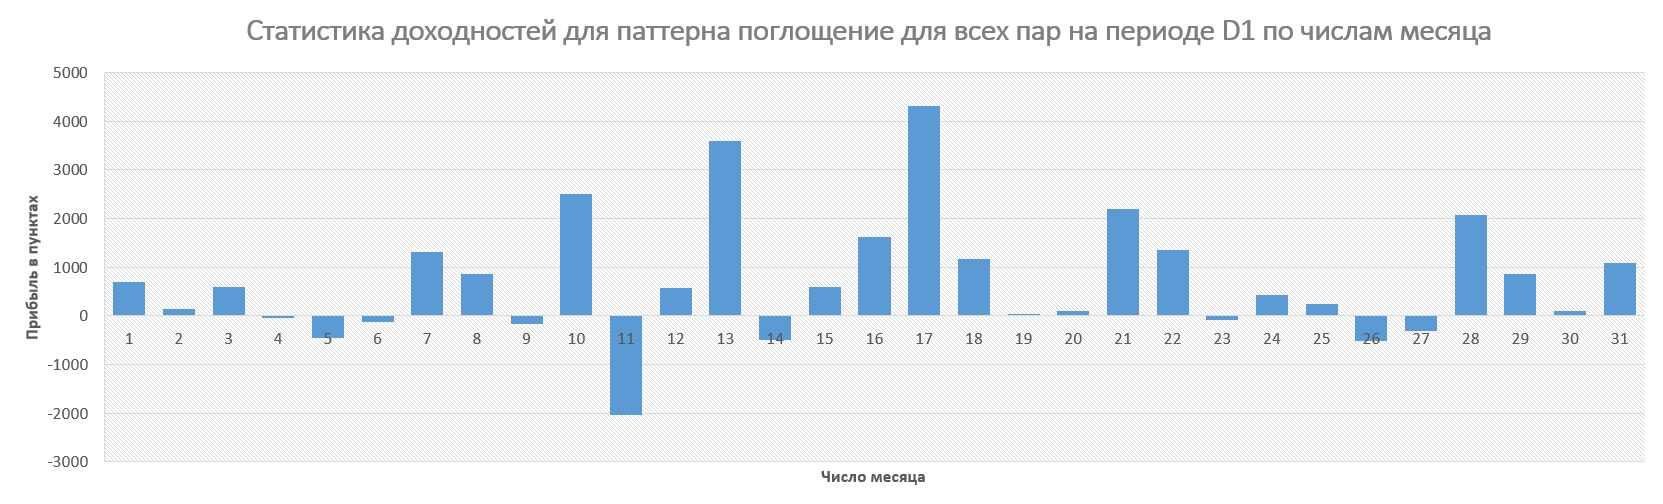
And again I do not see any obvious correlation.
Returns by months of the year:
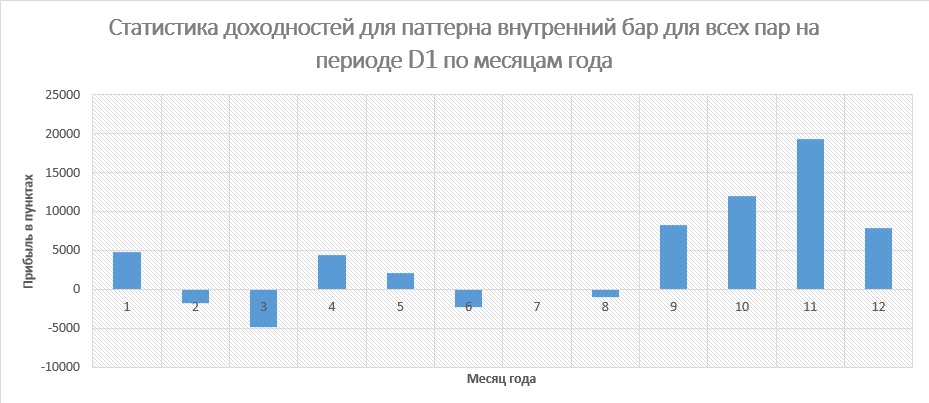
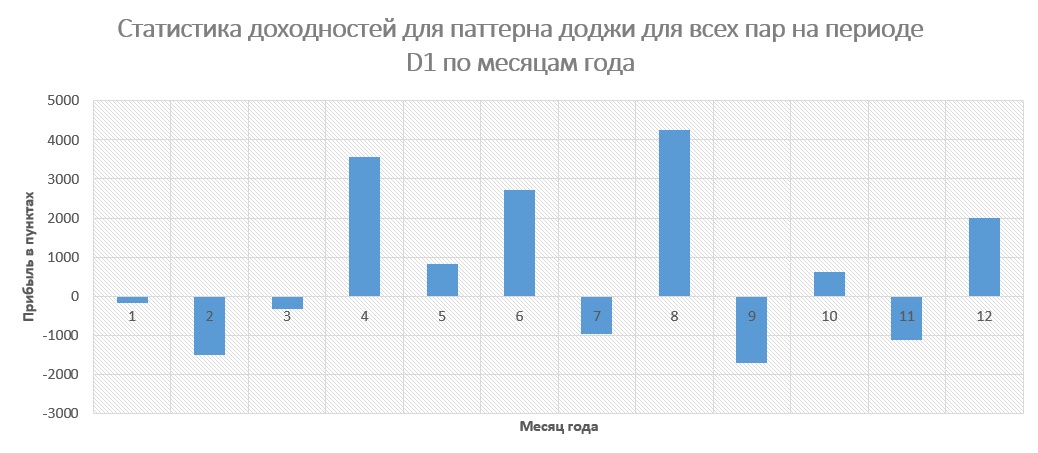
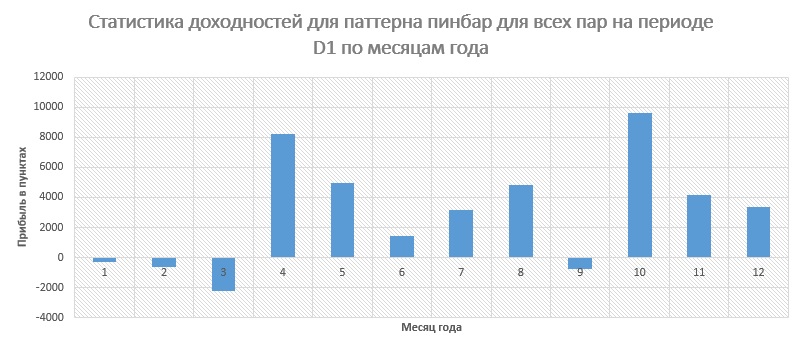
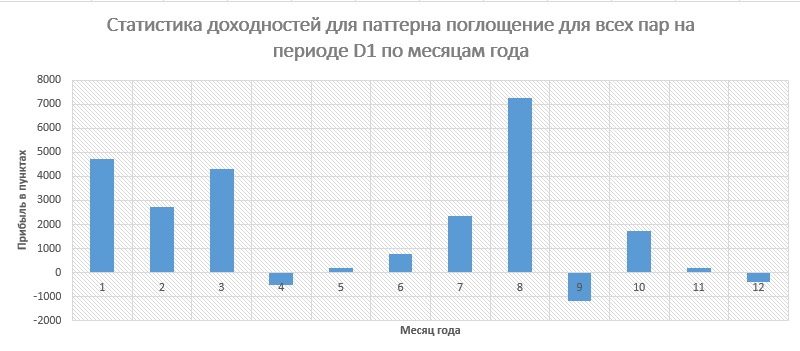
The only pattern that can somewhat be traced when working on D1 in relation to the months of the year is that most patterns really work better in winter.
On the D1 period, all Price Action patterns can be profitable even without additional confirmation. But, of course, better results can be achieved by taking into account the direction of the trend and the main levels on the chart.
Homework

- Create the expert advisor described in the lesson.
- Obtain statistics on Price Action patterns taking into account one of the two filters we came up with at the beginning of the lesson: the level filter or the trend filter.
- Try applying the approach described in the lesson to another market phenomenon that currently interests you.
Conclusion

Today we conducted market research with the help of our knowledge of mql4 programming. It took me two and a half days to collect and analyze the data presented in the article. A similar study without auxiliary tools, such as the expert advisor we wrote today, would have taken more than one month, and a large volume of data provides wide room for errors. We learned that the correlation depending on the day of the week really exists, learned to write the simplest level filter, and also to use mql4 for market research and excel for processing the obtained results. And most importantly, we became convinced of the effectiveness of using candlestick analysis on higher timeframes.
Best regards, Dmitry aka Silentspec
TradeLikeaPro.ru