
Stress Free TDI System - relax and make profit

Hello, ladies and gentlemen forex traders!
Today we will talk about a system based on the TDI (Traders Dynamic Index) indicator with the Stress Free prefix. That is, a system that offers trading without stress, without tension, and without wearing out your pants in front of the monitor. Overall, this is a fairly simple strategy built on the so-called market "inefficiencies."
Stress Free TDI System characteristics
Platform: MetaTrader4
Currency pairs: any
Timeframe: H4-D1
Trading time: once a day / around the clock
Recommended brokers: Alpari, Roboforex, Exness
The system is installed according to the standard instructions.
System description

The strategy uses fairly simple indicators. Of those that are not in the terminal by default, Heiken Ashi and TDI have been added. In addition, the classic stochastic with marked levels 20, 50, and 80 is used.
A detailed review of Heiken Ashi is available on our website. In short, Heiken Ashi candles give us the opportunity to see the trend more clearly by removing market noise. We have already covered the TDI indicator in a separate article, so we will not describe it in detail here.
The system can work on any instruments, whether currency pairs, stocks, or indices. Essentially, any trending instrument will do for the job.
Choosing a larger TF allows you to spend less time in front of the monitor. For D1, for example, you only need to check for a signal once a day.
The strategy was first published on the forexfactory forum and is based on the well-known Trading Made Simple. We briefly covered it in the TDI review. In essence, this strategy is its direct modification in, so to speak, the Stress Free version. Although, almost the same indicators are used. This system will suit those who are looking for a calmer version of Trading Made Simple.
How the trading system works

First of all, we look for a strong trend. Then, we wait for a slight correction. You could even say not a correction, but a corrective impulse, which we will determine using TDI. After that, we will determine the continuation of the first strong push, again using TDI.
We will determine the very first push by the stochastic. Stochastic is, as you know, an oscillator and it has levels - 20 and 80. Usually these levels are called oversold and overbought levels. If you are at least a little familiar with stochastic and its basic rules of use, then you know that if the price is in the overbought zone, then we only sell. That is, it is considered that there is no longer any point in buying. And conversely, when the indicator value drops below 20, into the oversold zone, this means a signal to buy.
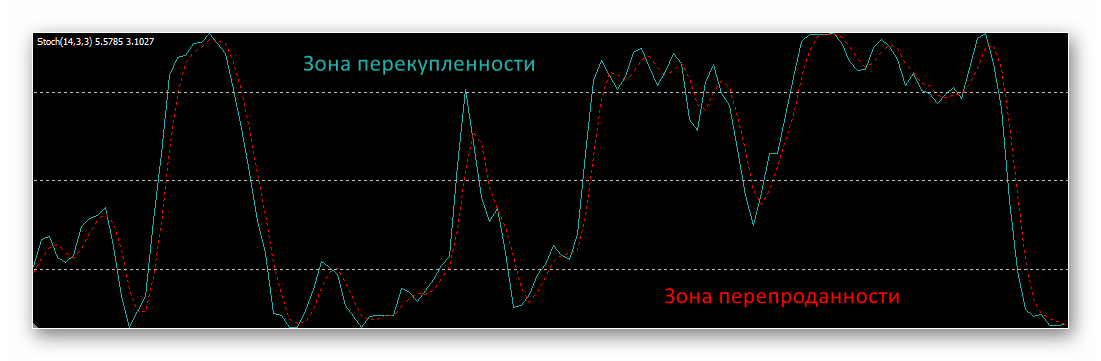
In this system we will use the reverse signal. That is, upon reaching 80 we will consider buys, and when approaching 20 - sells. You could say it is a somewhat non-standard technique. That is, in this case, if there is an impulse upward and the stochastic is above 80, then we expect that very small pullback and the further continuation of the first strong push.
We are looking for a push strong enough that it can break through higher levels and take out the stops of other players / activate their orders. That is, roughly speaking, we enter against the crowd.
First method

According to the strategy, there are two entry methods - one for D1, the other for H4. The rules for both options are fairly simple.
Sell signal
- The stochastic must be below the 20 level, that is, in the oversold zone.
- After that, the green TDI line must cross the red one from top to bottom, and both lines must be below the yellow one. Or the green line must bounce off the red one without crossing it.
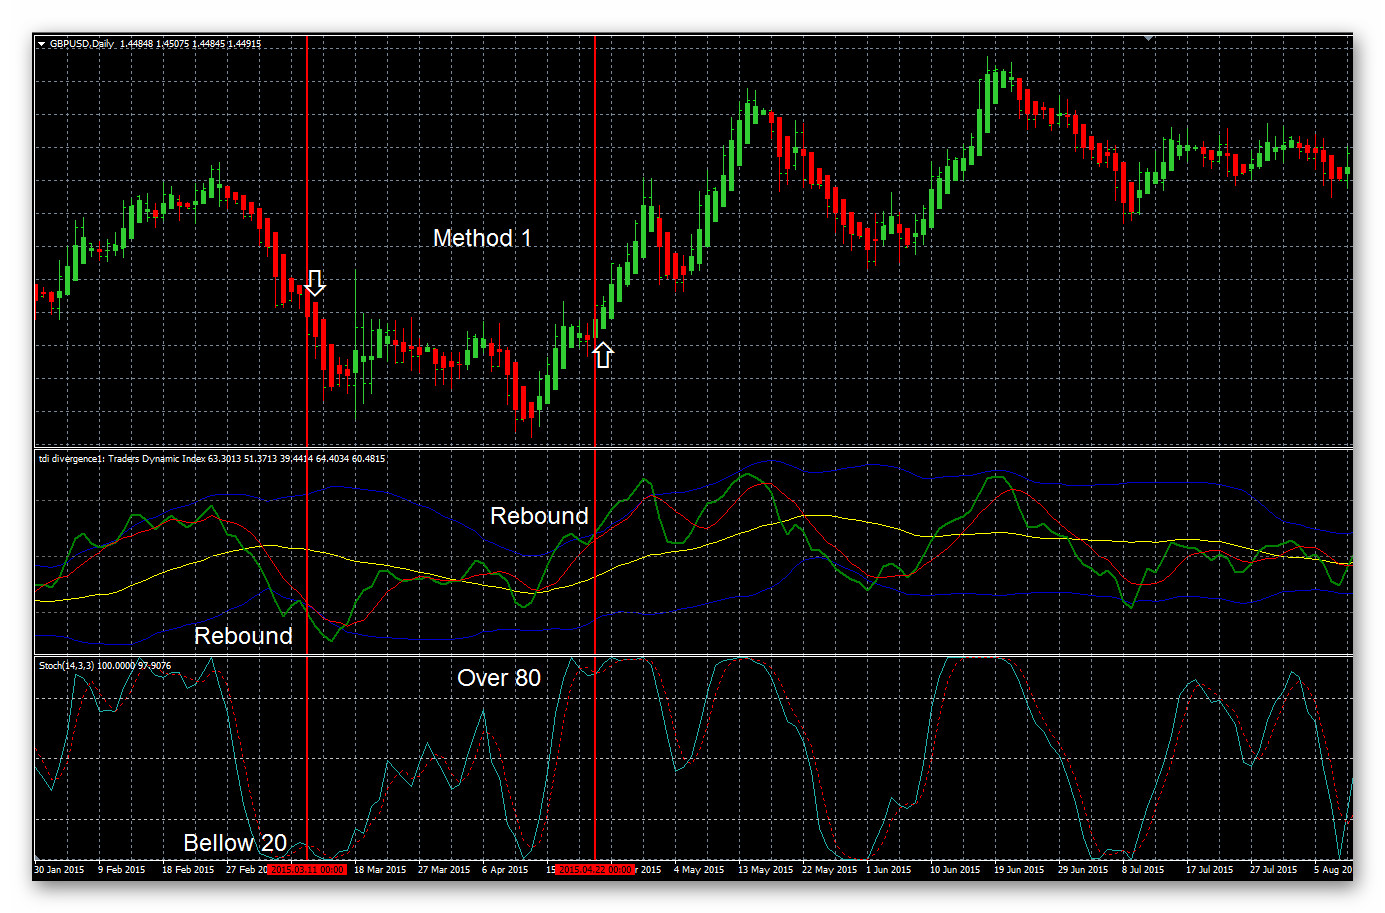
Here it is important to clarify what counts as a bounce and what does not. What we essentially need is to capture a situation where the green line came close to the red one and bounced off it. Here we are dealing precisely with a bounce. That is, the lines did not cross, but came close enough to each other, after which the green one sharply changed direction.
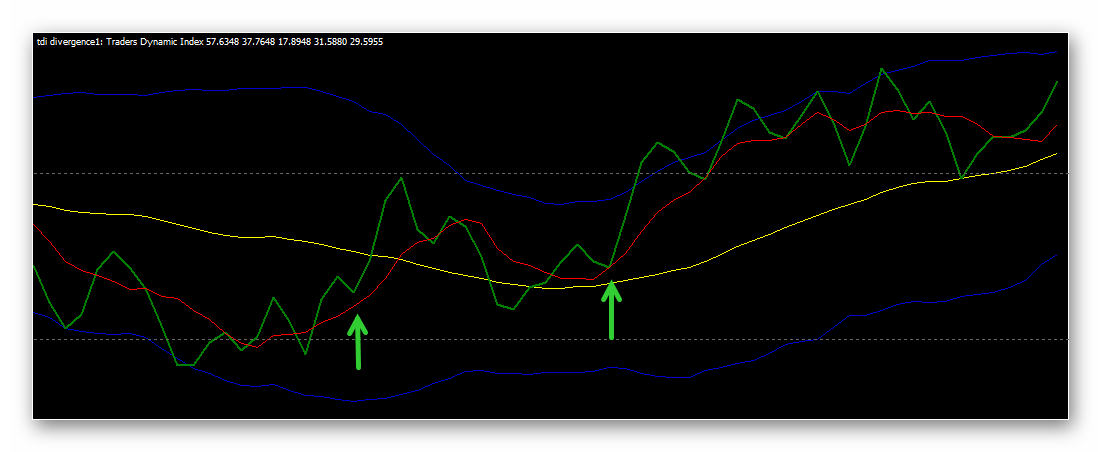
So, the red line is the trade entry. Here we have the stochastic in the oversold zone and the initial strong price impulse. After that, a small correction occurs and the green line crosses the red one from top to bottom. We place the stop loss slightly above (or below if these are buys) the signal candle.
We exit the trade in one of three cases:
- A Heiken Ashi candle of a different color appeared
- A reverse crossing of the TDI lines occurred
- The stochastic left the 20 level
On the chart below, the possible exit points are marked with green lines.
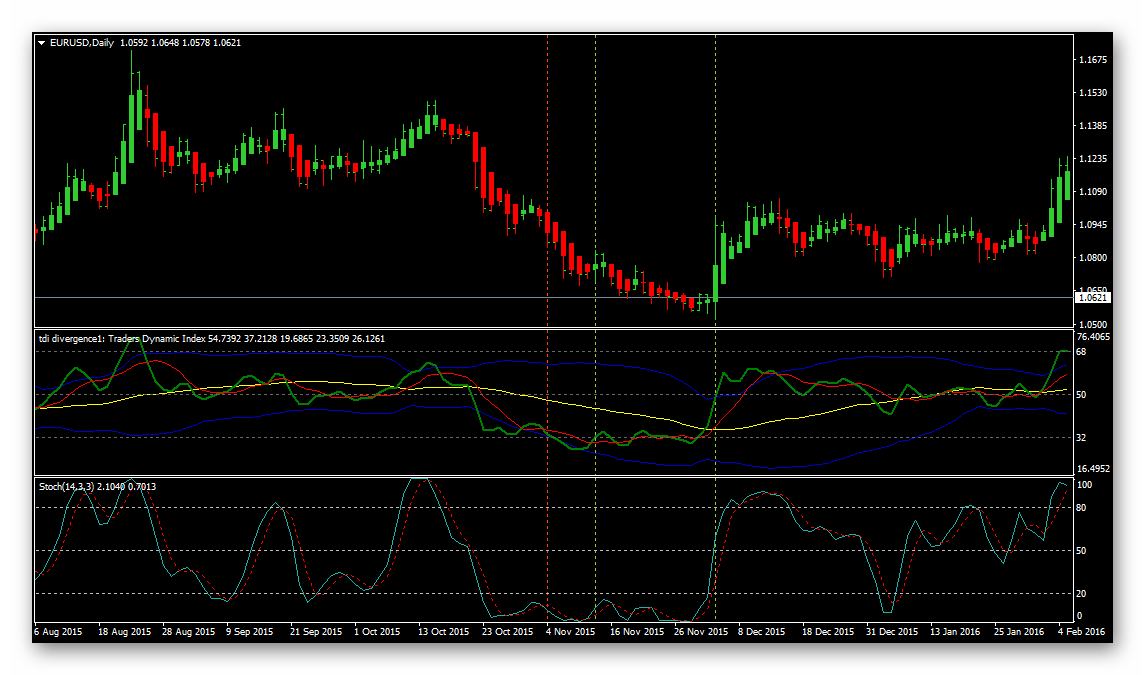
Buy signal
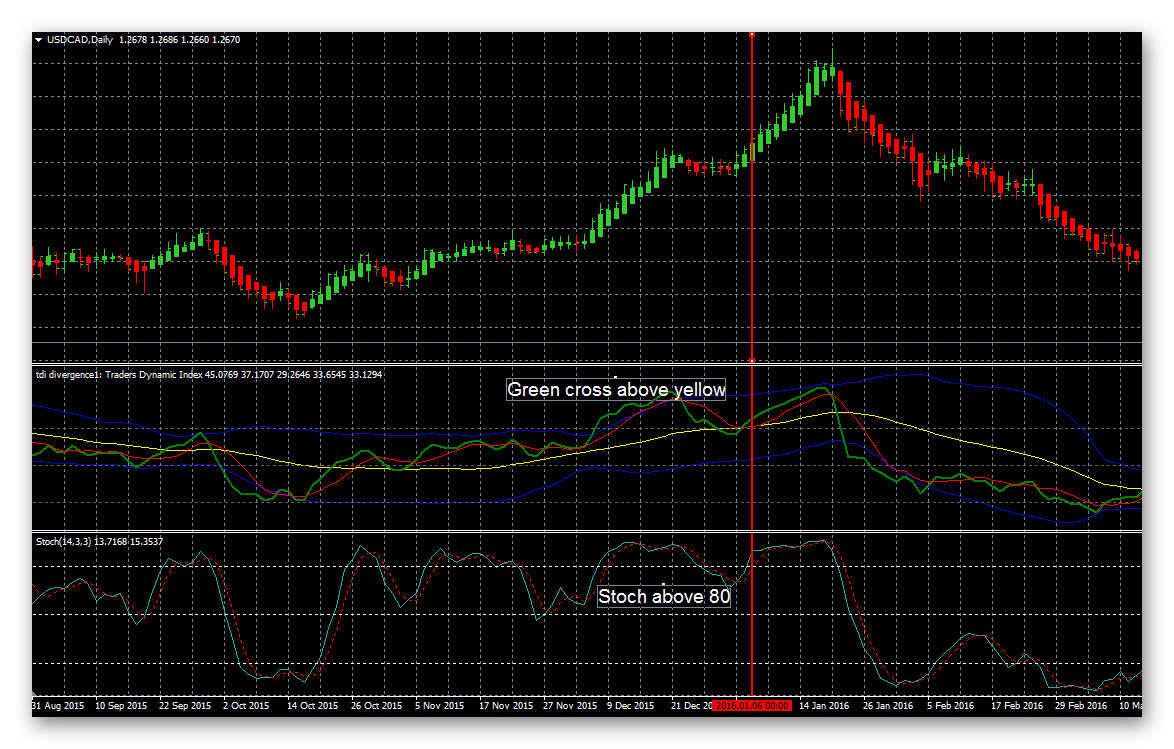
- The stochastic is above the 80 level, that is, it is in the overbought zone.
- The green TDI line crosses the red one from bottom to top, while both lines are above the yellow one.
We exit when:
- A red Heiken Ashi candle appeared
- A reverse crossing of the TDI lines occurred
- The stochastic left the overbought zone
If you look at the examples of trading from the author of the strategy, we will see that most often he enters literally for 2-3 candles. At the same time, he has about 80% profitable trades. So it makes sense not to sit in the position for too long. Maximum 2, 3, 4 candles, and then exit.
The point of the Stress Free strategy is not only that we spend little time in front of the monitor. But also that we do not stay in a trade for long, testing ourselves with greed and fear. If you use many pairs in trading, there will be enough signals coming in. The author, for example, uses 28 pairs.
Also, after 25 points it is recommended to move the stop-loss to breakeven.
Another example directly from the author of the strategy. Here we see an example of that very bounce off the red line. In fact, the lines do not cross. The green one comes right up to the red one and then bounces off.
Another example from the author. We have the stochastic above 80 and the green line crossing the red one from bottom to top. We exit on the first red Heiken Ashi candle.
Second method

This method is used on H4 charts; it is not recommended to use it on daily charts. Also, the second method should be used only if there are no signals under the first method.
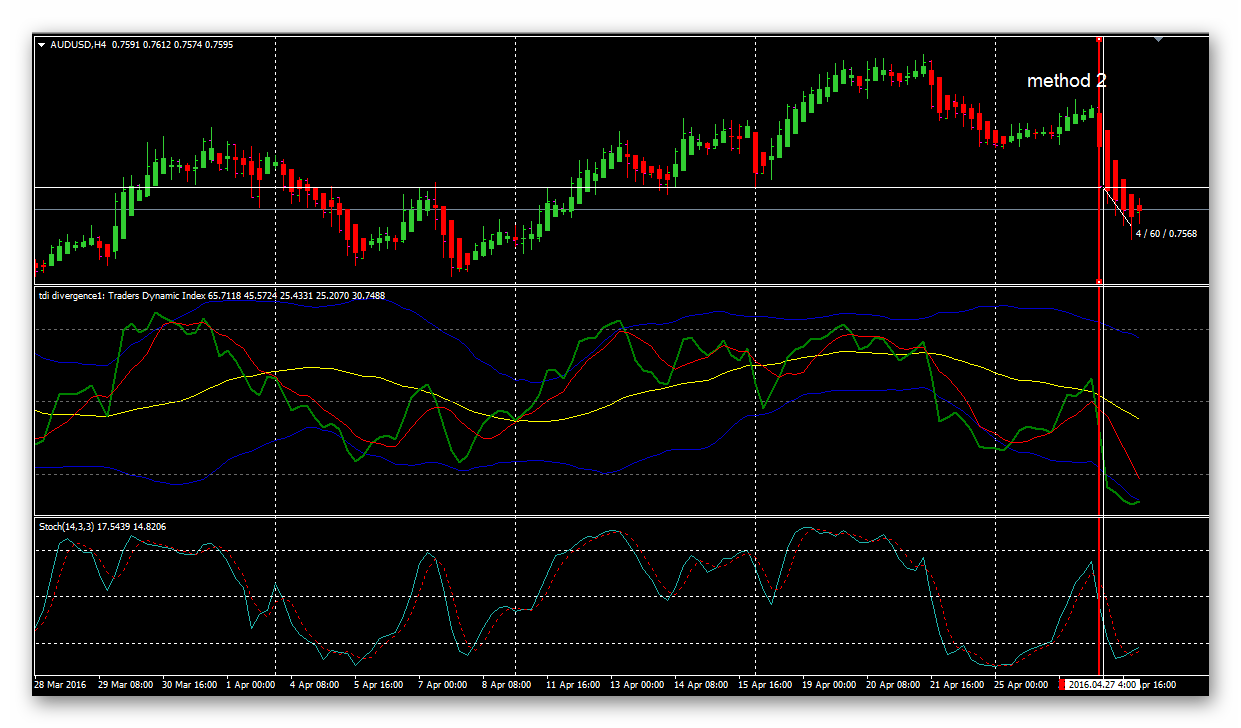
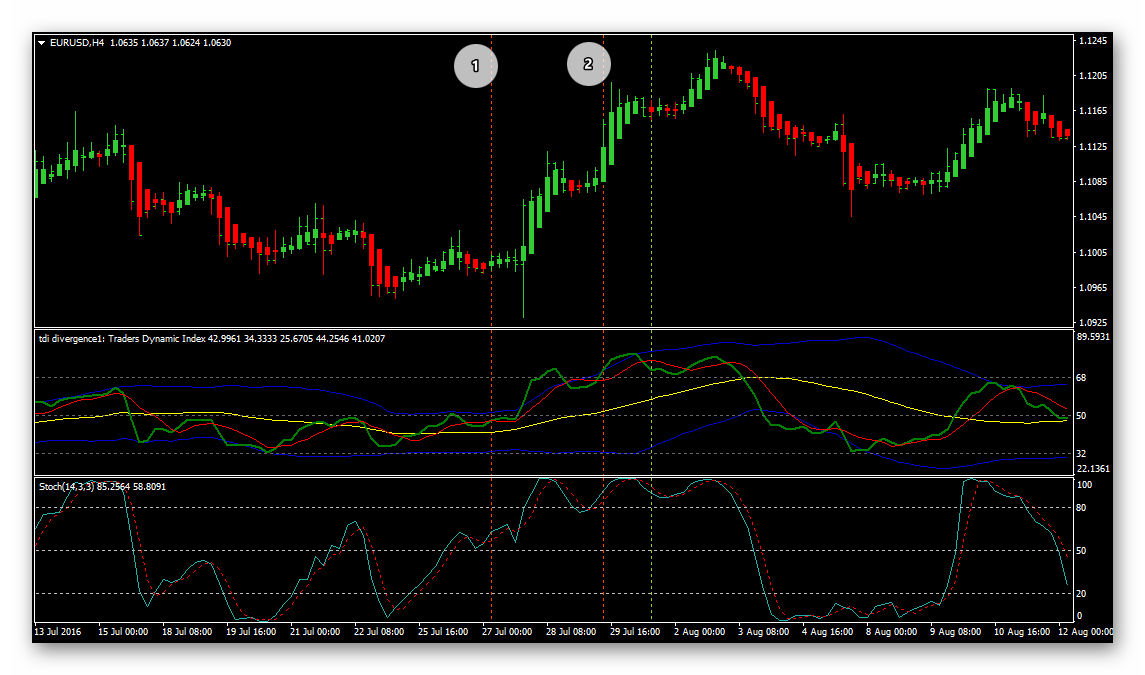
So, what is the difference from the first method? All indicators and exit rules remain. But, taking into account the specifics of H4, in particular, as a faster timeframe, we will use different stochastic levels. For a buy, the stochastic must be near the 50 level or higher. The TDI rules remain.
- So, here we have a fairly strong initial impulse. We make sure that the stochastic is above the 50 level and the correction ends with a crossing of the TDI lines. The signal candle is marked with a red line, and we enter on the candle after it. The stop-loss, as we remember, is placed below the low of the signal candle. In this case, the trade would have been stopped out.
- By exactly the same rules, we enter on the next correction. The stochastic is above 50, and the green line crosses the red one from bottom to top. We exit the trade when a red Heiken Ashi candle appears, or when the TDI reversely crosses.
Additionally

You can also exit based on time. For example, if the trade is in profit and 3 candles in a row close in our direction, we close the position.
Money management in the strategy is absolutely classic. You can use our lot calculator to calculate the lot size. We recommend the classic 2-3% per trade.
Conclusions

The strategy is simple and built on clear principles. The author of the strategy kindly provided a special template with all the necessary indicators, so all that remains for you is to install it on the chart. Applying the strategy in practice should not cause difficulties, considering the high timeframe. Because the simpler the strategy, the harder it is for time to break it. In other words, the greater its chances of holding up over a long period of time and the much lower the chances of simple human error. After all, the simpler the mechanism, the harder it is to break. The strategy is also notable because we go against the stereotypes of the stochastic. That is, we go against the crowd, and the crowd, as is known, loses in most cases. Such are the laws of the market.
Download the Stress Free TDI System strategy files

Discussion on the forum
Respectfully, Pavel Vlasov TradeLikeaPro.ru
