
Stochastic RSI - the forbidden love child of classic indicators

Good afternoon, ladies and gentlemen! Many of you use an indicator such as RSI in your trading. But the well-known traders Stanley Kroll and Tushar Chande, authors of the book "The New Technical Trader" and several other books, were bothered by the fact that RSI very often stays between the 20 and 80 levels for a long time without crossing them, and therefore they invented the Stochastic RSI indicator, which according to their idea should have been free of this drawback. Perhaps the respected traders overdid it, or perhaps it was intended that way, but the resulting indicator ends up in overbought/oversold zones very often. So what did these two successful people actually come up with? Today we will try to sort it out.
Characteristics of the StochasticRSI Indicator
Platform: Metatrader 4
Currency pairs: any
Timeframe: any
Trading time: around the clock
Installation

The indicator is installed according to the standard instructions, so there should be no problems.
Settings Description

The indicator has only 4 settings:
RSI_Periods – the period of the RSI oscillator;
Percent_K – the %K parameter of the stochastic oscillator;
Percent_D – the %D parameter of the stochastic oscillator;
NumOfBars – the number of history bars that will be included in the indicator calculations.
As you have probably noticed, the "slowing" parameter typical of the Stochastic oscillator indicator is absent here. That is, unlike the classic stochastic, this indicator has no additional slowing.
Working with the Indicator

Stochastic RSI – is an ordinary stochastic that is calculated not from price values, but from the values of the RSI indicator. Here it is worth briefly recalling how Stochastic and RSI are calculated for a fuller understanding of the essence of the indicator itself.
RSI compares the average magnitude of price increases with the magnitude of decreases over a certain period of time. Stochastic, on the other hand, compares the closing level of a candle with the maximum/minimum price range over a certain period of time. Accordingly, StochasticRSI compares the RSI level relative to its range over a certain period of time. In other words, it takes RSI as a basis and applies the stochastic formula to its readings.
The conclusion immediately suggests itself: the resulting indicator adapts better to the current state of the market, to current volatility, unlike RSI.
Naturally, since the indicator is created from two oscillators, it should also be used as an oscillator.
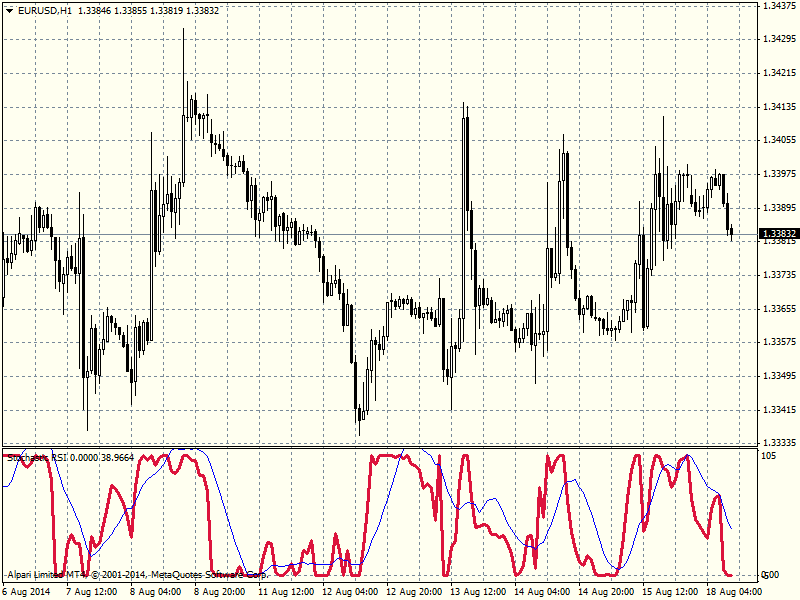
As you can notice, the indicator outwardly resembles the classic stochastic, but unlike it there are no overbought/oversold zones here. Instead, there are clear levels - zero and one hundred. When RSI reaches a new minimum, StochasticRSI will be equal to zero. When the RSI indicator reaches a new maximum, we will see our indicator at the 100 mark.
Let us compare the StochasticRSI indicator with the basic indicators. As you can see, it is in overbought/oversold conditions much more often than the basic indicators. In addition, it is indeed more sensitive and often reacts to price changes earlier.
Entry and Exit Rules

So, how should we use this indicator in trading?
It is used in the same way as any other oscillator.
- The first and most obvious way to use it is overbought and oversold levels. For this, you can add the extra levels 20 and 80, the same ones used for the stochastic. In this case, we will consider only the thick main line, ignoring the signal line. As with all other oscillators, you should not take any action when the oscillator enters these zones: the indicator is very sensitive and can remain there for a very long time. The signal to act is the indicator exiting these zones. But be careful: due to its particular sensitivity, the indicator gives many false signals!
- Level 50 also works very well, helping protect your deposit from entering too early. The signal generated by crossing level 50 gives fairly good entry signals that are not too delayed and are also quite reliable. In addition, the indicator being above or below level 50 can be used in your system to filter entries: above 50 means buys only, below 50 means sells.
- You can also use crossings of the indicator's main line with the signal line. It is much more reliable to consider such crossings in overbought and oversold zones.
Which signals typical of oscillators should not be used for this indicator:
- The well-known and most reliable type of oscillator signal, which many traders use in their systems as a signal to enter a position, divergence, unfortunately works poorly with this indicator. Therefore, it is better not to use it.
- Many people draw levels, trend lines, and look for technical patterns such as Head and Shoulders on the RSI chart. Despite the fact that Stochastic RSI was created on the basis of the indicators of the same name, these methods of getting signals also work poorly here.
Conclusion

Well, it looks like Chande and Kroll accomplished the task set before them.
However, it is important to remember that Stochastic RSI is an "indicator of an indicator". It predicts extreme RSI values well, staying ahead of the base indicators, and yet it is farther removed from price itself. In any case, do not forget that no indicator should ever be used alone, only in combination with other indicators and methods of technical analysis.
Download the Stochastic RSI indicator

Respectfully, Dmitry aka Silentspec
TradeLikeaPro.ru