
Stairstep Breakout System - when the Flat market is your friend
 Hello, ladies and gentlemen Forex traders! Once again I am glad to welcome you to the TradeLikeaPro.ru website, and today we will talk about a system called The Stairstep Breakout System (SSBO).
Having thousands of fans all over the world, this strategy can without exaggeration be called a classic. Unlike other systems, where we wait for something to start happening in the market, here we do the opposite: we wait for calm and only then move to action. Another interesting point is that over the years this strategy has existed, no one has complained about its ineffectiveness.
System Characteristics
Platform: MetaTrader 4
Currency pairs: any
Timeframe: M15-D1
Trading time: around the clock
Recommended brokers: Alpari, Roboforex, Instaforex
System Description

First of all, I would like to express my gratitude to the author of the strategy, a user with the nickname forexhard from the ForexFactory forum. The strategy has long been actively discussed in the original thread. Notably, the strategy rules have not changed even after many years. It often happens that the original rules change significantly and become more complicated, causing the very basis of the approach to be lost. Here the rules have not changed; the only addition was a helper indicator developed to simplify routine processes for the trader.
So, we know that there are trends in the market, and most trading systems are devoted to capturing them. There are also quiet periods in the market when nothing happens. We are all familiar with them: these are some of the most dangerous periods for a trader, because this is exactly where the greatest number of false signals is formed. In this strategy, on the contrary, we look for such periods when nothing happens in the market, that is, when a consolidation zone is formed.
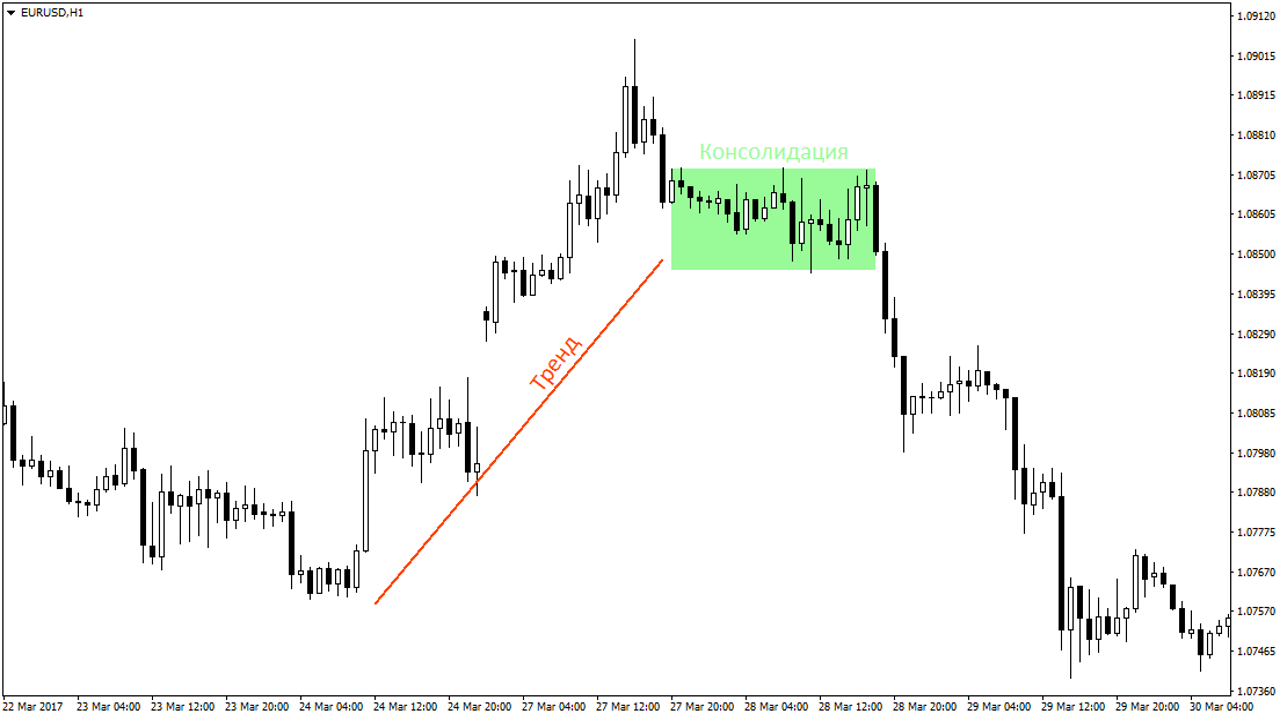 The reason for consolidation is similar to the reason an inside bar appears. In general, the principle of the Stairstep Breakout System strategy is very similar to this Price Action pattern, as the author of the strategy himself also says. Calm forms during a period of temporary price agreement between buyers and sellers, a truce between bulls and bears. But since the war never stops, sooner or later one of the sides will win, which will result in some movement. During such a “truce” we can enter the market and follow the established trend, go against it, or wait to see which side wins.
As you have probably already guessed, the first thing we do is wait for the formation of those very consolidation zones. At the same time, it is worth considering the shape of the formed zone. The narrower and longer the consolidation zone, the stronger the breakout from it, which is exactly what interests us. For example, for the M15 timeframe the length should be 20 bars or more, and for H1 even 10 may be enough. A normal height for a consolidation is approximately two average candles.

If you trade through MT4, you can manually mark consolidation zones on the chart through the Insert menu – Shapes – Rectangle. At first, if you are not fully sure whether there is a consolidation zone or not, it is better to skip the entry and wait for a more proper formation. The attached files include a pdf document from the strategy author (consolidations.pdf), where you will find examples of consolidations under various market conditions.
For those already familiar with chart analysis, consolidation zones will often resemble familiar patterns such as a narrowing flag, triangle, and so on. But in this strategy we do not consider figures. In any case, the way consolidation zones are identified can be very subjective, which is why it is better to use a helper indicator for this task.
Dynamic Breakout Box Indicator

The indicator is installed in an absolutely standard way. To launch it, simply drag the indicator from the navigator window onto the chart, after which the settings will open. The settings need to be selected individually for each pair and timeframe.
- BoxLength – duration of the consolidation zone;
- BoxTimeFrame – timeframe for calculation (default is 15 minutes);
- BoxRange – height of the zone;
- AutoBoxRange – we will use this setting only for the first launch in order to determine the correct consolidation height;
- AutoBoxRangeDailyADRperiod – ADR period for determining the average candle size; that is, the last N days are taken and their arithmetic mean is displayed
- AutoBoxRangeDailyADRfactor – ADR multiplier for automatic determination of the consolidation height; that is, what percentage of daily volatility we take for the box. The higher the timeframe, the larger this number should be.
- BoxBufferPips – distance from the consolidation boundary that will not be considered a breakout;
- DaysBack – over what period to perform the calculation;
- MinBarsClosedOutsideBO – minimum number of bars that closed beyond the boundary before entering a trade (default is 2 candles);
- ShowDisplayPanel – display of the information panel on the chart;
- ShowTPLevels – display of profit-taking levels;
- ShowTPLevelsOnLastBoxOnly – display of levels only for the latest signal;
- TP1… TP9 – take-profit levels (default is Fibonacci levels );
- SignalMail – email notifications ;
- SignalAlert – terminal notifications.
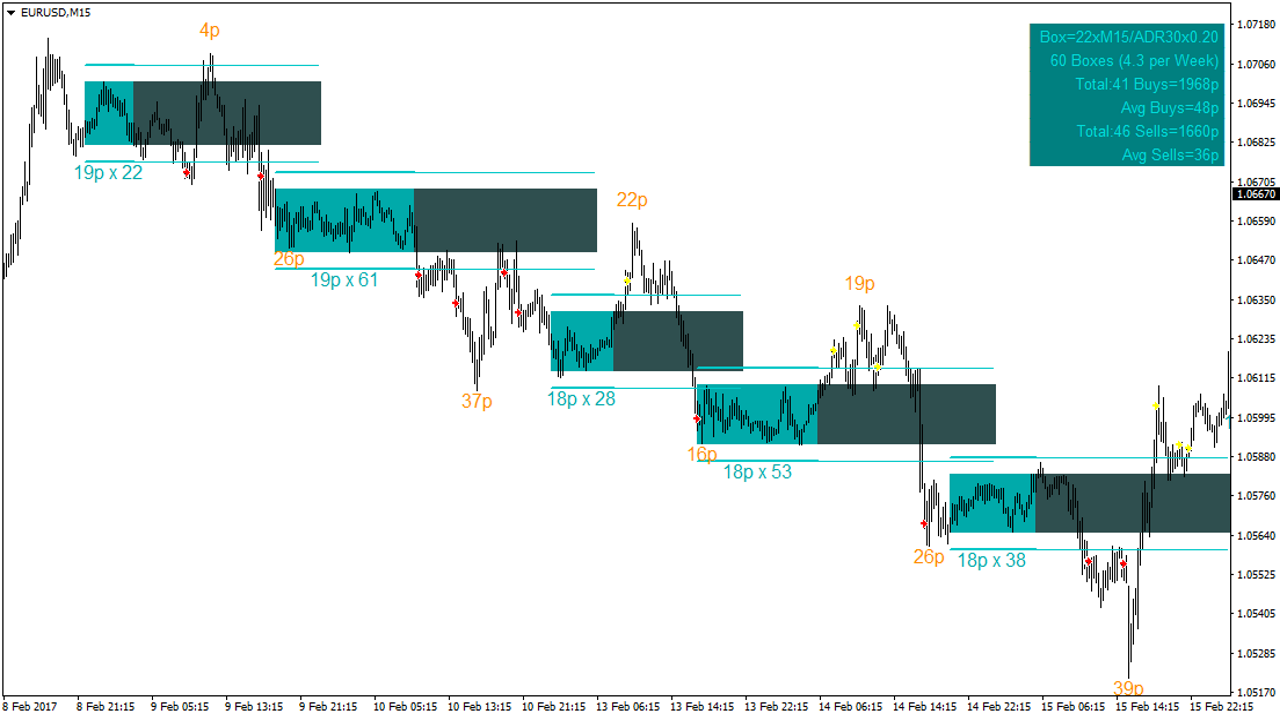
The indicator automatically identifies consolidation zones that correspond to the specified parameters. The drawing of the consolidation zone also extends into the future to see how price will react to it. On the chart we can see that price really remembers these levels and periodically tests them.
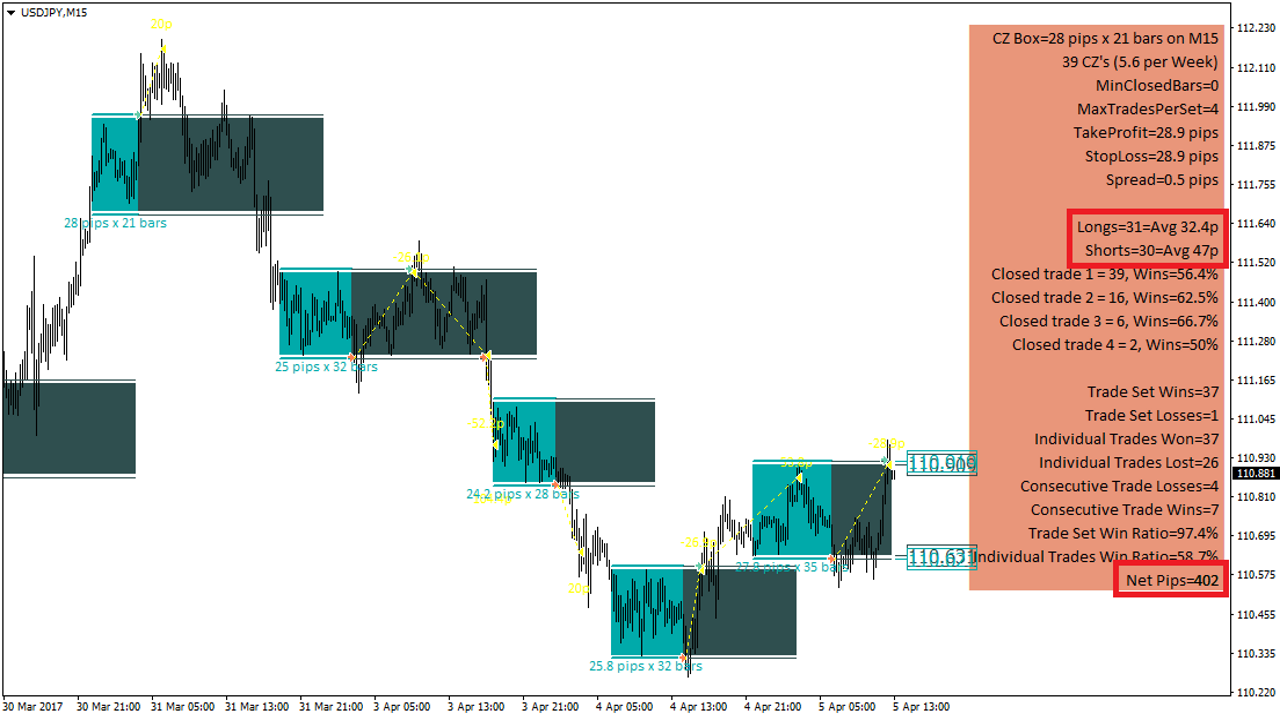
 In addition to the consolidation zones themselves, the Final Edition version of the indicator also builds statistics on possible entries and exits. For example, here we can see that over the last 50 days (the period is specified in the parameters), 31 long and 30 short trades were made, and overall 402 points were earned.
 Next, let us try to determine the optimal size of our “box.” Volatility is different everywhere, and for each pair/timeframe an appropriate value needs to be selected. So, to begin with, set AutoBoxRange to true (do not forget to specify the box length in the settings). Now look at which number is most often written under the “box” and determine the average. For EURUSD at the moment this is 15 points. Now go into the indicator parameters, turn off AutoBoxRange, and change BoxRange to 15 points. You can save a template with the optimal parameters for a specific instrument and time period.
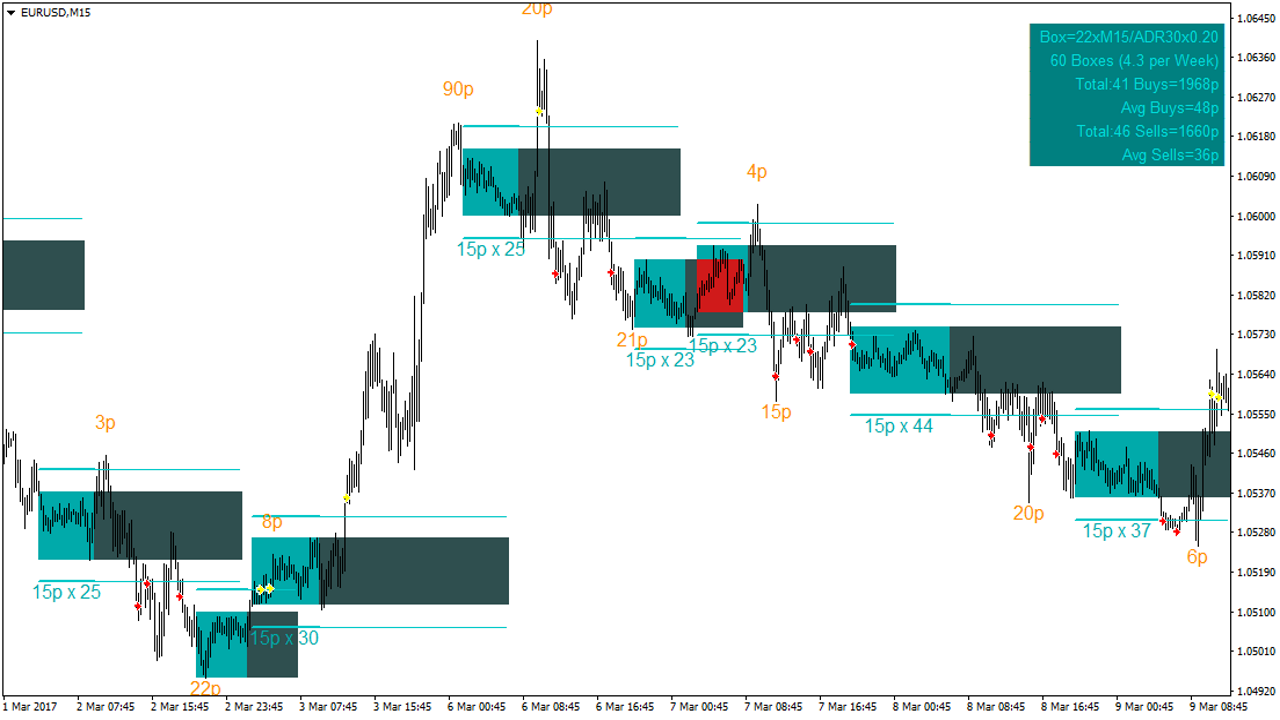 The horizontal lines show those very buffer zones that price can freely enter. Again, if for M15 a buffer size of 5 points is quite sufficient, then for larger timeframes the size will be completely different.
In addition to entries directly on the breakout, the indicator shows entries on a retest of consolidation levels. That is, when after entry the price returns to test the level and again breaks through the buffer zone.
Entry Rules
As you have already guessed, we enter on a breakout of the consolidation zone + buffer. That is, we treat as a breakout not the boundary of the “box” itself, but the boundaries of the buffer zone. At the same time, we wait for two candles to close beyond the buffer boundary for confirmation. We enter either with pending orders or at market if you constantly monitor the chart. On one consolidation zone, we enter a maximum of two times, and ideally once. If the trade does not work out, we wait for the next consolidation.
Stop Loss and Take Profit

Take profit is always larger than the stop loss (by at least 10%) - we try to stick to this. A stop loss can be placed on the opposite side of the consolidation zone. Take profit, accordingly, is also equal to the size of the box + some additional number of points.
You can also use a fixed stop and profit size. The orange labels on the chart show the number of points that price traveled from the last breakout. When setting fixed levels, you can use these values as a guide. Also, you can use support/resistance levels as reference points. And finally, you can enable the display of profit-taking levels in the indicator (ShowTPLevels).
Additional Tricks
- You can use certain tricks to recover a losing position. As an option, on the next signal we can set a take profit equal to the stop loss of the losing order, thus offsetting the loss. Also, we can enter with a double lot, intending to cover the loss and make profit on top. And we can also split the take profit and stop loss in two, covering the loss with a doubled lot on the position.
If the second signal is also losing, we wait for the next signal on the next consolidation and enter again with a doubled lot. Naturally, such a strategy is dangerous in itself, so this scheme should be repeated no more than 3-4 times. The point is that sooner or later consolidation will lead to a strong surge, and our task is to catch it.
- Instead of stop losses, you can use the principle of locking. For example, if we entered on a buy, then instead of a stop loss we place a pending Sell Stop order. When the price reverses and the order is triggered, we are left with two positions in opposite directions. After that, if we see two candles beyond the buffer zone on either side, we remove the extra order. The result is that while the price has not decided on a direction, we stay in the market and our losses do not grow and remain at the same level.
- Money management here is standard - 2-3% per trade. If you use martingale or locking, reduce it to 0.5%, or even less.
Conclusion

Overall, this is a universal system for any timeframe and currency pair, which is also easy to test on historical data. The only difficulty lies in the initial setup of the indicator, since it must be configured separately for each pair and timeframe. On the other hand, the number of settings, in particular the ability to specify the number of candles beyond the buffer, make the indicator a much more practical and flexible assistant in trading.
Download the Stairstep Breakout System strategy files

Best regards, Pavel Vlasov
TradeLikeaPro.ru