
Sharpe Ratio: Evaluating the Effectiveness of Your Strategy

Good time of day, fellow Forex traders! More often, when evaluating strategies in Forex, traders look at profitability in percentage terms. The more there is, the better, right? But % profitability depends heavily on risk and does not reflect the system's effectiveness. So what metric should be used? The standard among financial analysts is the Sharpe Ratio, derived by Nobel laureate William Sharpe.
Below we will look at how to calculate the Sharpe ratio to assess a strategy's effectiveness, understand what it actually means (many know how to calculate it but do not understand its meaning), and also draw conclusions about when it is useful and when it is not.
Sharpe Ratio in Forex

The Sharpe Ratio was invented by the well-known American economist William Sharpe. Today, it is one of the most frequently used measures of the risk-to-return ratio. The ratio gained even greater importance when, in 1990, Sharpe was chosen as a Nobel Prize laureate for his capital asset pricing model (CAPM).
It will not be difficult for a person from the financial sphere to understand the principle of calculating the Sharpe Ratio and what it is supposed to reflect. In essence, the task comes down to finding out how much excess return you will get from holding a riskier asset. I think it is no secret that extra risk should always be fully compensated by corresponding returns. The greater the value of the ratio, the more profit there is per risk for the same amount of money.
The calculation formula looks as follows:
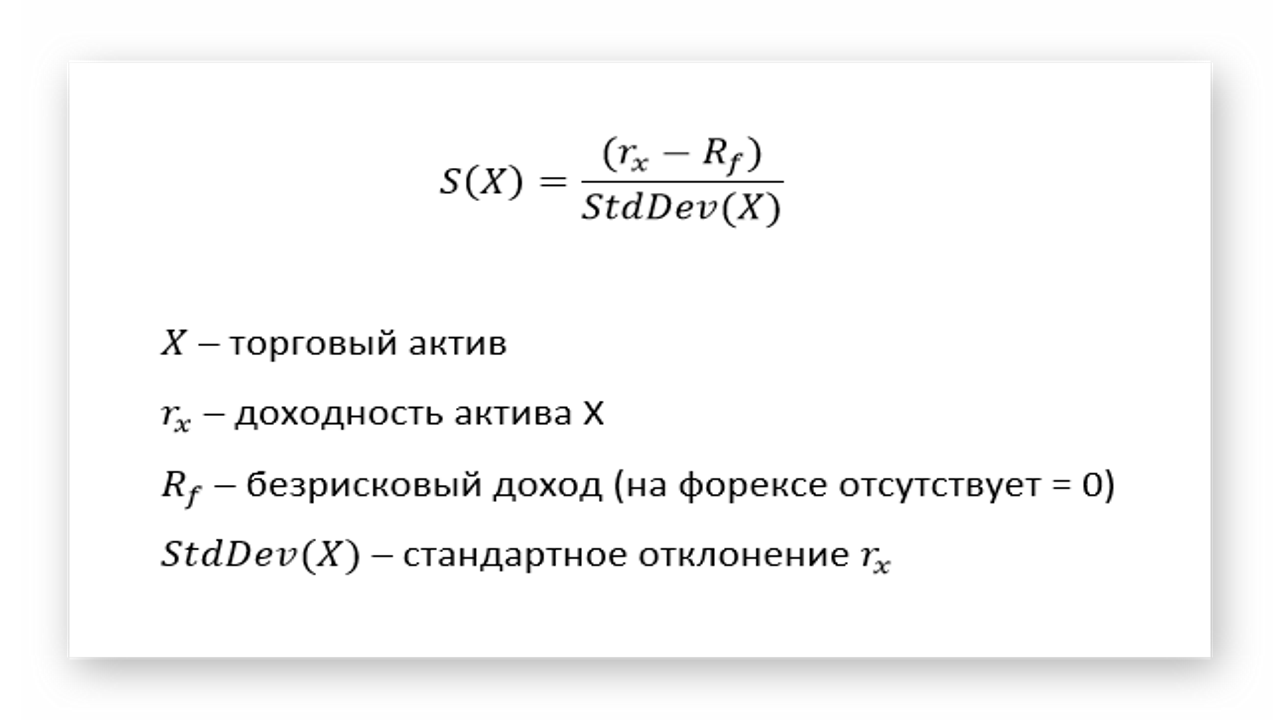
Asset Return

Return can be measured with any frequency: it can be a day, a week, a month, or a year. Also, the average increase per trade can be taken as the return indicator. The only thing is that it is desirable for the original return data to be normally distributed. This is where the main weakness of the ratio comes from. Sharp spikes in a sample of 3 or more standard deviations and an asymmetric distribution (a visible tilt of the chart) can cause a false assessment.
Risk-Free Return
Risk-free return is a theoretical return with zero risk. That is, it is the return an investor can receive with absolutely no risk over a certain period of time. In theory, this is the minimum return an investor expects to receive from any investment. By comparing this indicator with actual return, you can determine how good the compensation is that you receive for additional risk.
In practice, the concept of an investment with zero risk does not exist, since even the safest investments carry some share of risk. Nevertheless, risk-free return can include a savings bank deposit or money invested in U.S. Treasury bonds. The Forex market is always a high-risk investment, so the risk-free return in our case will be zero. But if your deposit is kept in a bank, you can substitute the current base rate into the formula.
In the MT4 terminal, the Sharpe indicator is calculated as the ratio of the arithmetic mean trade return to the standard deviation, with a zero value for the risk-free rate.
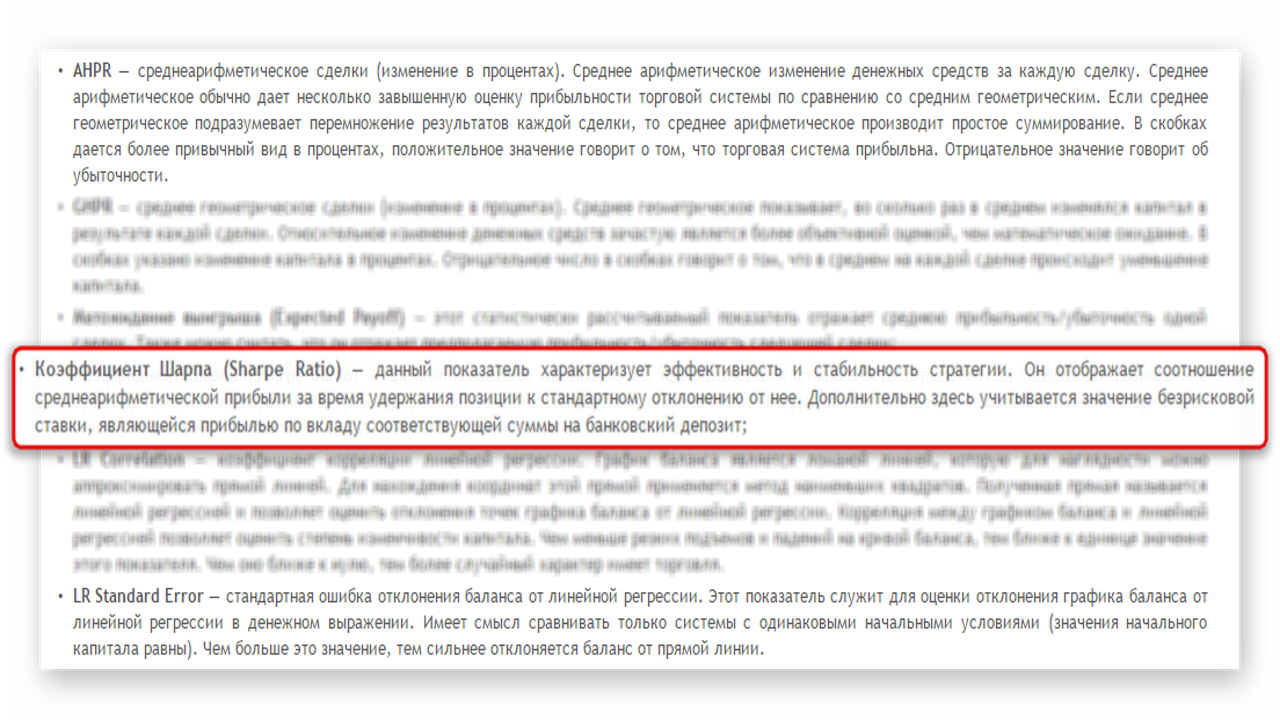
The full formula looks like this:
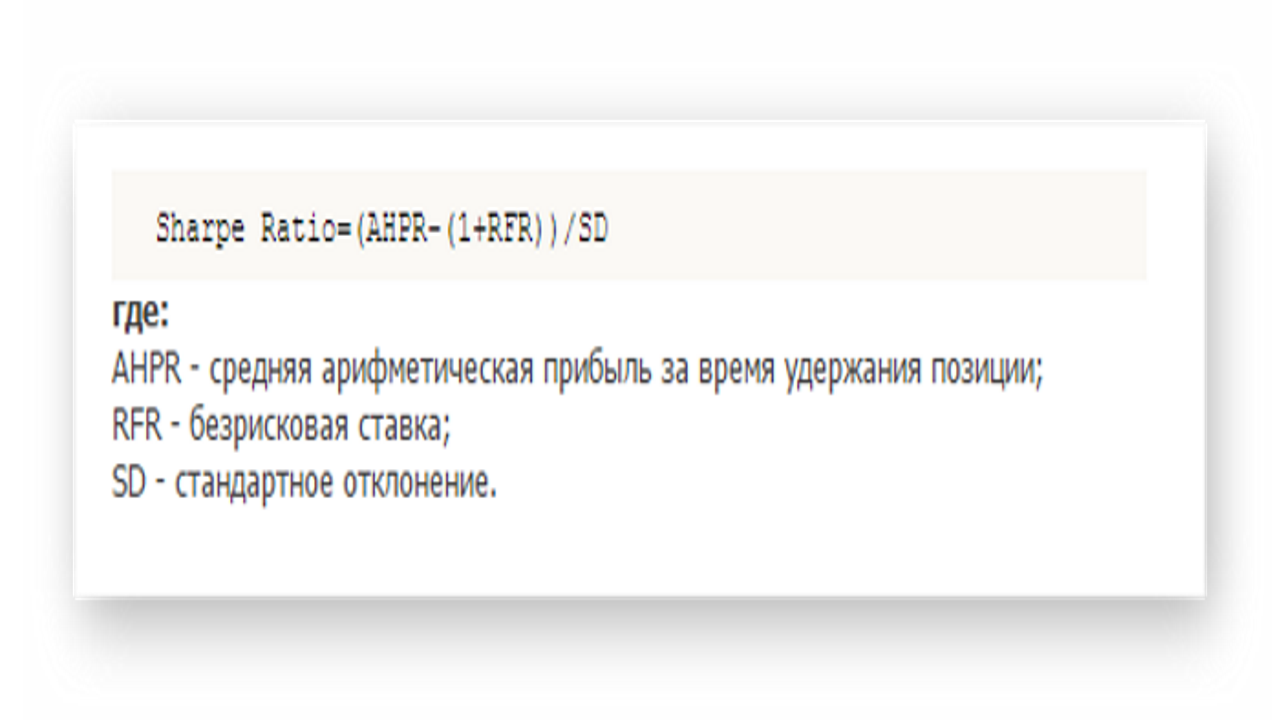
Standard Deviation
The Sharpe Ratio evaluates the effectiveness of an investment from the point of view of the dispersion of returns. Since we have already calculated the excess return (return minus the risk-free rate), all that remains is to divide this value by the standard deviation of the asset's return. That is, to calculate the ratio of return to risk.
Although today this is no longer required, standard deviation is still easy to calculate manually. Suppose you collected a small set of trade return statistics: 3%, 4%, 5%, 2%, 1%. At the first stage, we subtract the average from this sequence and get the following series: 0%, 1%, 2%, -1%, -2%.
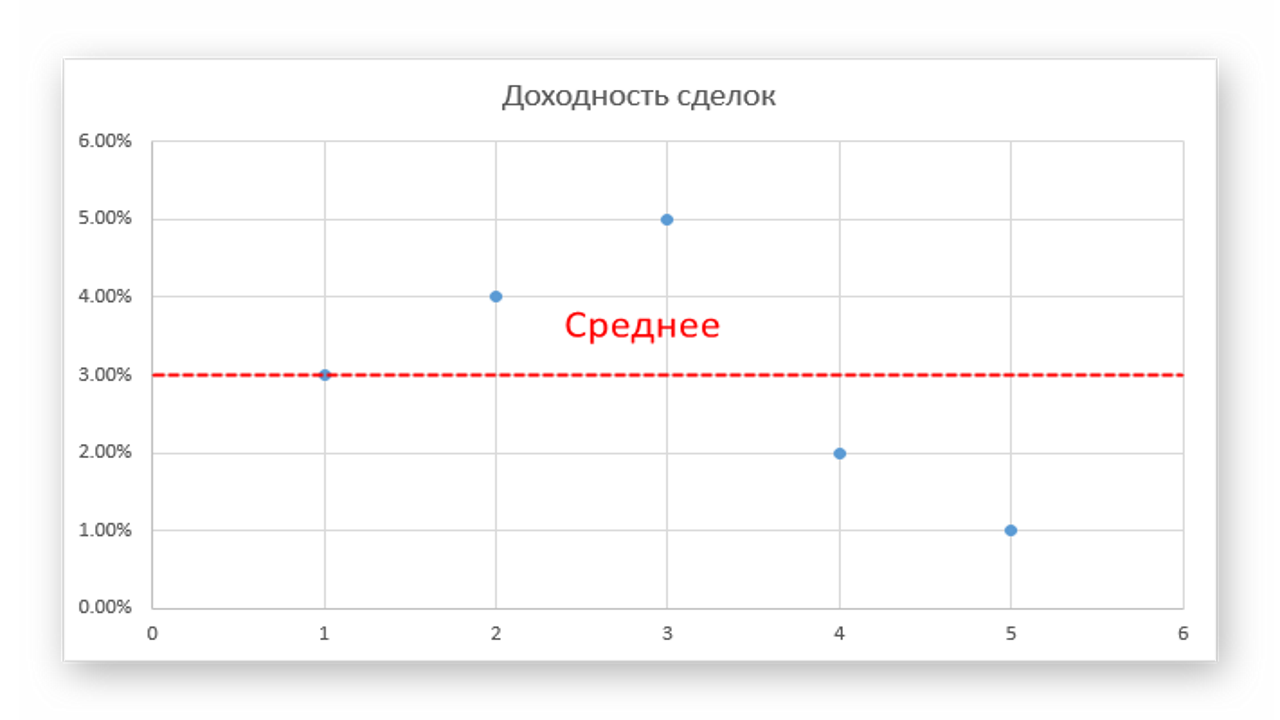
Next, we square the values, obtain the arithmetic mean, and take the root of the result: sqrt((0.00% + 0.01% + 0.04% + 0.01% + 0.04%) / 5) = 1.41%.
For comparison, let us take a slightly different sample: 2%, 8%, 5%, 4%, 6%. Obviously, the return of such a system within the period under consideration is higher, but we also observe much greater return volatility, 2% versus 1.41% in the previous example. Accordingly, the first strategy is less risky.
Units for Calculating the Sharpe Ratio

For example, let us try to compare the effectiveness of two trading strategies by their return and risk metrics. Suppose the first strategy yields 5% profit per trade, with a standard deviation (a measure of return dispersion) equal to 4%. The second strategy brings an average of 2% on each trade, but the deviation does not exceed 1%. In this case, the first strategy will have a Sharpe ratio of 1.25, and the second 2.0. This means that, despite the lower return, the second strategy has a better risk-to-return ratio.
The Sharpe ratio should be equal to one or higher. Then it is considered that the strategy we are analyzing operates with sufficient efficiency. A value above three already indicates that the probability of taking a loss on each trade is less than 1%. And the higher the obtained value, the better.
Conclusion
In most cases, the Sharpe ratio will show the real profitability of a strategy. But sometimes the Sharpe measure can be misleading. For example, some bonds may show a stable return above bank interest for many years, to which the ratio will respond with unrealistically high readings. In this case, the obtained value will say nothing about the real risks behind investing in that bond, even if the risk is actually minimal. Overall, this ratio is suitable for comparing two strategies with relatively frequent entries and not excessively large targets.

Respectfully, Alexey Vergunov TradeLikeaPro.ru