
Self-Organized Criticality and Smart Trading
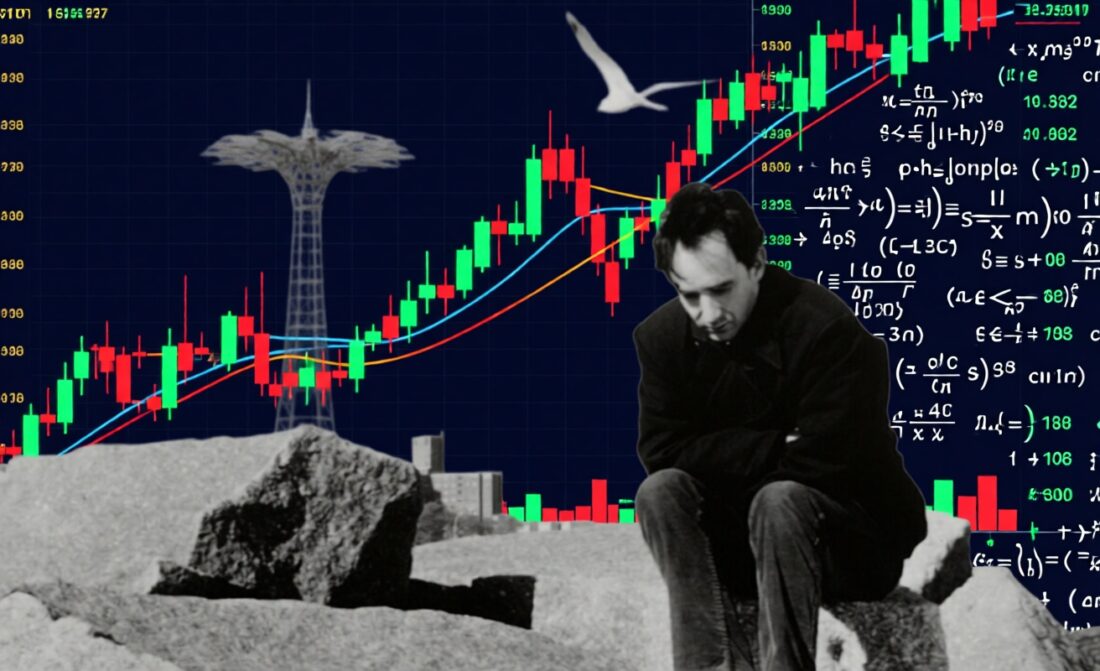
What about the stock market? The stock market also has its own pattern. Right in front of me. It's hidden behind the numbers. It has always been this way. Max Cohen, the main character of the film "Pi" (director: Darren Aronofsky, year of release: 1998).
Have you ever wondered why earthquakes happen the way they do? Why do financial markets alternate between calm and sudden collapse, and why do forest fires start with one small spark? At first glance, these phenomena seem chaotic and have no general patterns.
In 1987, Danish physicist Per Bak proposed a theory that revolutionized the understanding of complex systems. This theory is called Self-Organized Criticality (SOC).
This theory describes certain patterns around us. As a result, some researchers have begun applying SOC theory to explain market behavior. There is almost no material on this topic on the Internet - just a few reviews and articles in scientific journals, and even those are only in English.
We would not be talking about this theory, but the Per Bak Self-Organized Criticality indicator recently appeared on TradingView and made it into the Editors' Picks selection. And if there is an indicator recognized for quality, why not understand the theory before testing it.
Formally, the name “theory of self-organized criticality” sounds complicated, but its essence is brilliantly simple. Per Bak used a figurative pile of sand as an example in his lectures, and that is what we will consider.
Interesting? Read on.
The Very Complex, Made Simple
Imagine that you are slowly pouring grains of sand onto a round table. At first the sand lies flat. But the higher the hill gets, the steeper its slopes become.

- Initial stage (subcritical). The system is simple. Each new grain of sand simply falls on top.
- Accumulation. The slide is getting steeper. Some grains of sand roll down, but overall the structure is stable.
- Critical point. At some point, the slide reaches its maximum inclination angle. Physicists call this state critical.
Now - attention! - the most interesting thing happens. When the system reaches this state, adding a single grain of sand can lead to three different outcomes:
- The grain of sand will remain in place.
- A small “landslide” of a few grains of sand will slide down.
- There will be an avalanche that will collapse half of the slide.
And here is the key point of Bak's discovery: the system itself brings itself into this state, i.e. self-organizes. We do not need to correct the steepness of the slope with tweezers. The simple process of adding sand automatically places the system in critical mode, where avalanches of any size are possible.
The market behaves very similarly. For a long time, the price can move in a narrow range, creating the impression of calm. But behind this calmness there is often an accumulation of factors:
- orders and stops,
- leverage and credit risk,
- participants' expectations,
- liquidity imbalance,
- many positions in one direction.
When a trigger appears or a “whale” enters the market, the system can suddenly “discharge.”
Main properties of self-organized criticality
From this simple metaphor emerge three main principles that apply to both earthquakes and economics:
Power laws
If you start recording the sizes of avalanches in a sandbox, a pattern will quickly emerge: there will be a lot of small avalanches, fewer medium ones, and catastrophically few giant ones. And this relationship obeys a strict mathematical relationship - a power law.
Who didn't notice this in childhood? I definitely noticed.
This is what distinguishes a critical condition from a normal one.
For example, people's height follows a “bell-shaped” distribution (most people are of average height, and there are almost no two-meter giants or 60 cm tall dwarfs).
And how is liquidity distributed in a balanced market? In the form of a bell-shaped curve.
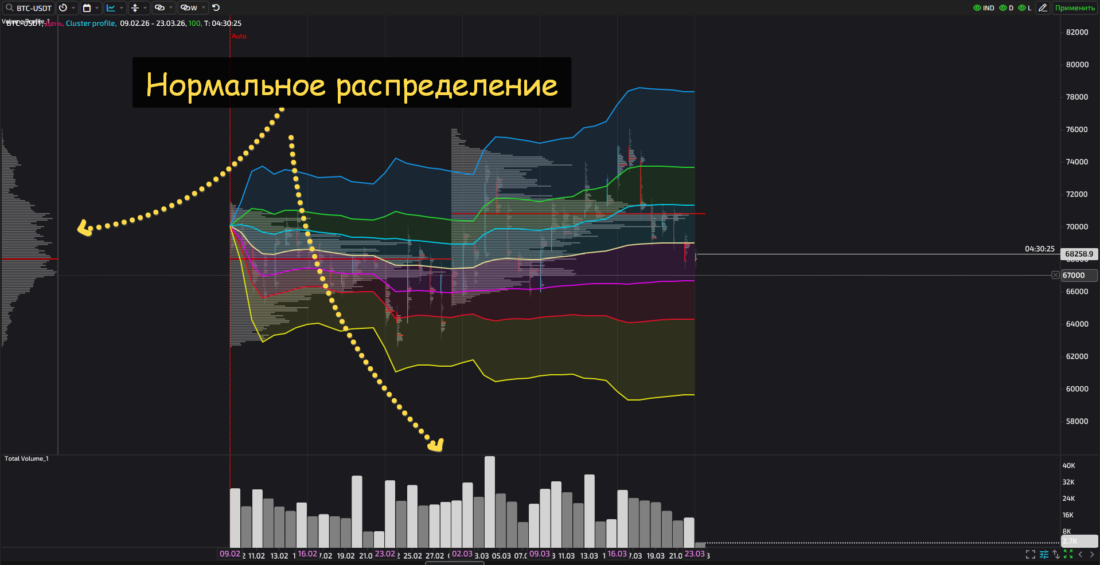
This condition is considered normal, i.e. ordinary. It can be described through simple statistical patterns. The indicators we are familiar with are based on this principle.
But tail events (tails) are almost impossible to calculate and predict. These include those days when volatility values increase sharply.
In the case of earthquakes, everything is different: tremors with a force of 1 occur every day, and with a force of 8 - once every few years. The graph of such a dependence on a logarithmic scale looks like a straight line.
Let's remember the charts of crypto coins, especially scam. A long line with unexpected short-term growth of hundreds and thousands of percent and an equally quick return (although not always).
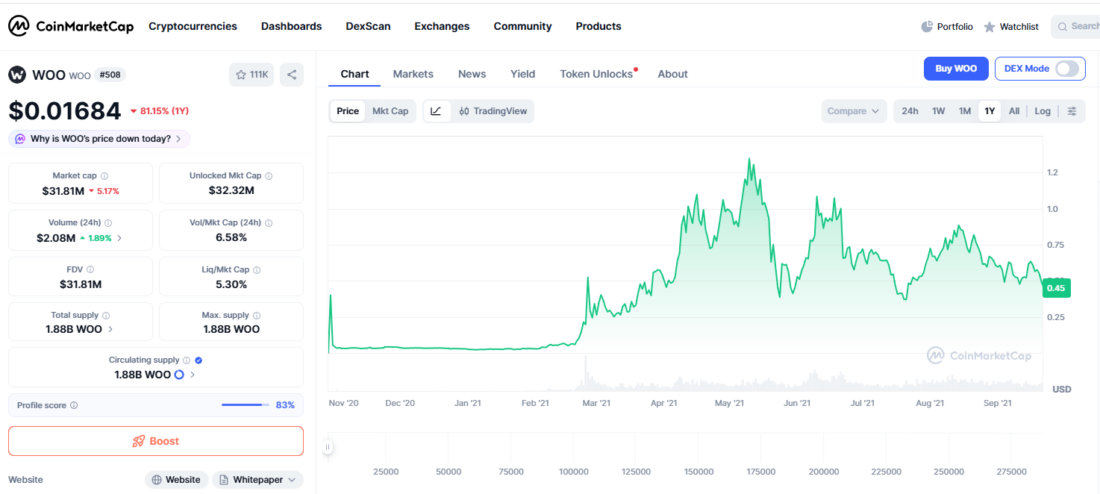
The appearance of such a graph tells scientists: this is self-organized criticality.
Thus, the events described are subject to power laws, in which stable systems naturally approach critical states in which the slightest shock can lead to catastrophic consequences.
Lack of an “external conductor”
The name “self-organized” emphasizes that the system does not need an external regulator. A pile of sand does not ask the wind when it will collapse. It accumulates tension naturally.
The Earth's crust is constantly moving (slowly but surely). This is analogous to falling grains of sand. The stress in the faults accumulates over the years. And when it reaches the limit (critical state), any micro-oscillation can become a trigger for a powerful earthquake.
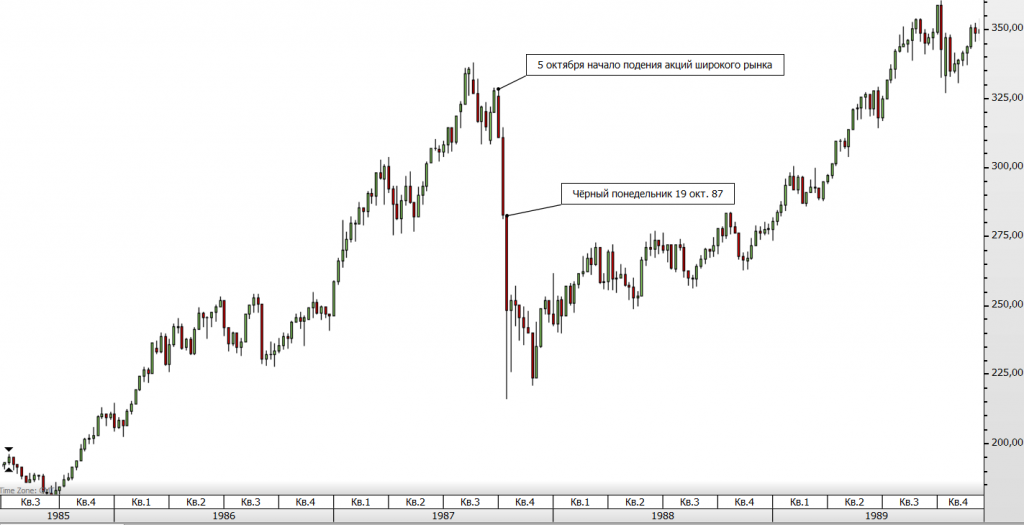
The asset can demonstrate stable growth. But a sudden, unpredictable event completely reverses the previous dynamics (for example, the US stock market in 1987).
A crypto coin or some third-tier stock (penny stock) can be in balance for years - moving from border to border, from value area high (VAH) to value area low (VAL).
Yes, it’s more complicated here: there is often an “external conductor”, but there are often situations when the market “itself” begins to move. On many crypto coins, especially deflationary ones, movements arise due to the accumulation of internal potential, and with a self-organized influx of buyers who, independently of each other, found an “interesting” coin with a simultaneous supply shortage, an avalanche-like growth begins, to which players who work only on impulse join in.
These traders connecting to growth are akin to grains of sand accelerating an avalanche.
It is impossible to predict, but it can be explained
The most intriguing and sad feature of self-organized criticality: it is impossible to predict the scale of the next event. Looking at a sandbox, you don't know whether the next grain of sand will cause a small rustle or a big avalanche. Why? Because the system is in a state where everything is connected to everything.
One grain of sand may fall into a “dead” zone, and another into a “sensitive” point, where it will destroy the fragile arch of sand grains.
This is why we cannot accurately predict earthquakes. We know that they must occur in seismic zones (the system is in critical condition), but we cannot say whether it will be a 3.0 magnitude shock tomorrow or an 8.0 magnitude in 50 years. Or almost cannot. The combination of modern physical models, powerful equipment and artificial intelligence allows us to estimate only the reduced or increased probability of an earthquake, but not the exact time of the event.
For the same reason, one big trade may not move the market, but some minor trade at another time will give rise to explosive dynamics.
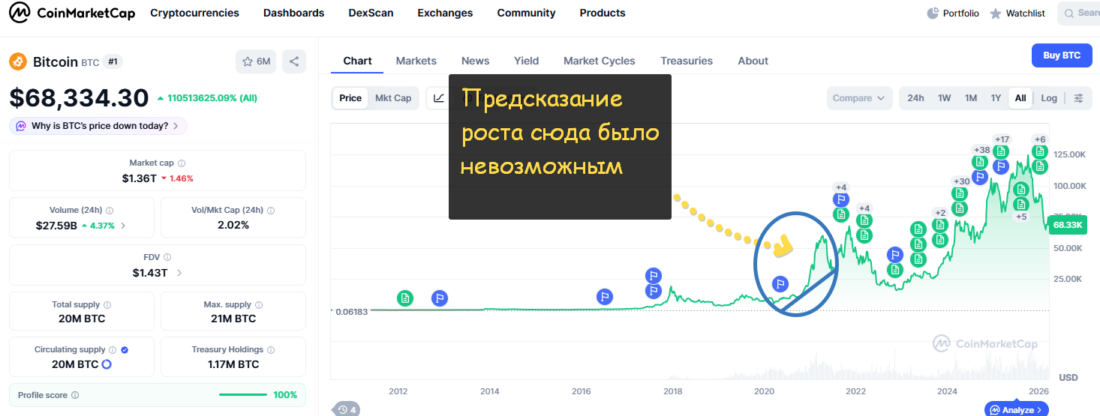
In 2020, Bitcoin began a colossal growth, the strength of which was impossible to predict. However, in 2017, Bitcoin grew in % much more, and this growth was even more unpredictable.
How and why to use all this?

First let's say that the theory of self-organized criticality is not a signal to enter the market, but it structures thinking, and therefore systematizes everything that we observe every day in the markets.
Understanding Crashes and Surges
Self-organized criticality helps explain why markets sometimes behave abruptly and non-linearly.
For example, the price stays in a narrow range for a long time, and then accelerates out of it. In such a situation, the market can be “charged” with accumulated positions and stops.
For a beginner, this is an important idea: quiet in the market does not always mean safety. Sometimes it's just a build-up of tension before movement.
Search for high-risk regimes
If the market looks too calm, this is not always a good thing. In this idea, quiet may mean that the system is storing energy before discharging. Traders are looking at:
- narrowing the range
- drop in volatility
- reducing volume while maintaining interest,
- accumulation of stops near obvious levels.
This is not a "buy" or "sell" signal per se, but a hint: the market may be preparing for a sharp expansion of the movement.
Understanding Event Clusters

In markets, events often occur unevenly. There are periods of calm, and then a series of strong candles, sharp punctures and accelerations. This resembles avalanche behavior.
Therefore, in quantitative financial models and market research, the idea of SOC is sometimes used to analyze the distribution of returns, clustering of volatility, the frequency of large movements, and “tail” risks.
Risk management
This is perhaps the most practical application of the theory for a beginner. If the market enters an avalanche mode, then the trader’s task is not to guess every avalanche, and not to die from a rare large avalanche.
Understanding the theory of self-organized criticality helps to follow the basic principles of money management:
- do not overload the position,
- set stop losses,
- take into account gaps and slippage,
- do not consider low volatility a guarantee of peace of mind,
- diversify risk.
How to apply this in trading logic

The following is not a “system for making money”, but a typical way of thinking of a trader with a scientific view of financial markets.
Scenario 1: the market contracts for a long time
The price moves in a narrow range, volume does not increase, and volatility declines. From the point of view of SOC theory, this resembles the buildup of stress.
Traders can wait:
- range breakdown,
- impulse at increased volume,
- expansion of the daily range.
Scenario 2: Many obvious levels
When there are clearly visible support/resistance levels in the market, stops and pending orders often accumulate there. A breakdown of this level can cause a chain reaction.
This also resembles an avalanche: first a small push, then acceleration due to the activation of a large number of orders.
Scenario 3: growing correlations and panic
During times of stress, different assets sometimes begin to move in unison. This is a sign that the system has become more “critical”: private events are no longer isolated, but quickly spread throughout the market.
Review of the Per Bak Self-Organized Criticality indicator on TradingView
The Per Bak Self-Organized Criticality indicator was developed by user HenriqueCentieiro. At the time this article was published (late March 2026), Henrique had published 39 scripts, and some of them immediately made it into the Editors' Picks selection.

Henrique has more than 1.3 thousand followers. By the way, we previously covered another of his indicators - Central Bank Liquidity Gap Indicator.
The indicator shows how susceptible the system is to cascading failures and phase transitions. Henrique Santieiro added four independent stress factors: tail-event risk, the volatility regime, credit stress, and extreme positioning.
This allows us to quantify how susceptible markets are to disproportionate changes caused by small shocks, like the sand avalanche in Per Bak's example.
Such events obey power laws - stable systems naturally approach critical states, in which the slightest shock can lead to catastrophic consequences.
Henrique Santieiro notes that traditional financial theories assume returns follow a normal distribution and that average market returns are 10%. But he disagrees and argues that markets follow a power law.
Thus, the indicator, according to its developer, measures the vulnerability of the market.
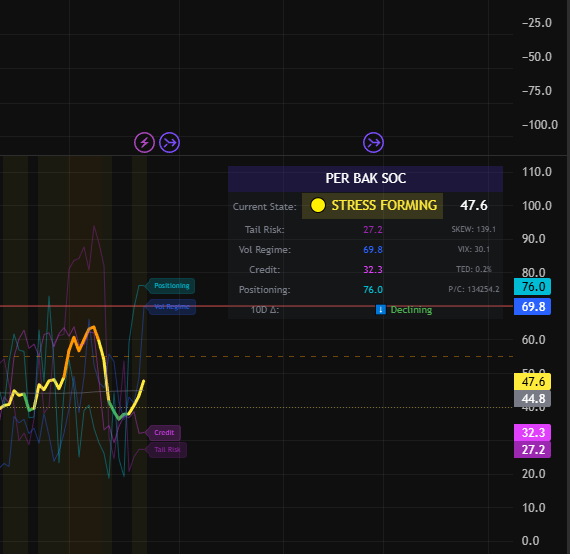
Tail risk (SKEW index)
Determines how options are priced in the market depending on “fat tails.” A high SKEW indicates a greater likelihood of extreme moves.
Volatility Regime (VIX term structure)
Combines the VIX level with the slope of the curve. A decrease indicates severe stress.
Credit stress (HYG/LQD + TED spread)
Tracks the deterioration of high-yield bonds relative to investment-grade bonds and interbank lending.
Detection of extremes (put/call ratio)
Identifies extreme hedging demand using percentile ranking and z-score analysis.
Default weights (can be changed):
w₁ = 0.34 (Tail Risk via SKEW)
w₂ = 0.26 (volatility mode via VIX term structure)
w₃ = 0.18 (credit stress via HYG/LQD + TED spread)
w₄ = 0.22 (determining extremes using the ratio of put and call options)
Each component uses a 252-day percentile ranking combined with absolute thresholds to determine both relative regime shifts and extreme absolute levels.
What does this indicator actually show?
Not volatility, but fragility. Falling markets do not equal increased vulnerability, but when markets fall, risks and vulnerabilities increase.
Scale from 0 to 100 and regime threshold values
The indicator gives a vulnerability score from 0 to 100 across four regimes:
🟢 Stable (0–39): The system is stable and can withstand normal shocks.
🟡 Stress forming (40–54): first signs of vulnerability (fragility), watch for worsening situation.
🟠 Increased vulnerability (Cracking) (55–69): the system is vulnerable.
🔴 Critical (Avalanche zone) (70–100): high probability of cascading failures.
Unfortunately, you won't be able to change the colors, although there is such an option in the settings.
Studying the indicator
I would like to point out right away that it is necessary to select coefficients for each instrument. Standard coefficients do not always show the critical zone.
Let's look at the example of gold (GC futures).
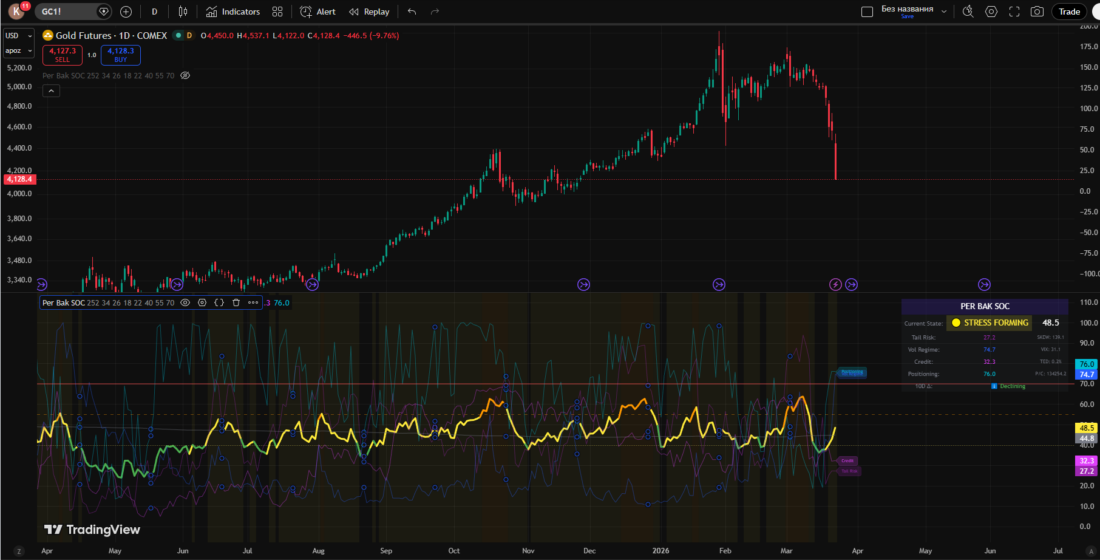
Standard settings did not allow us to see the formation of sales in February-March 2026. However, the indicator with standard settings shows itself perfectly when identifying increased vulnerability of the system.
If you look at the chart, now the indicator shows stress forming, and this can be either a signal of continued decline, or a sign of a stop after a strong collapse:
Let's change the weights.
For example, modified coefficients for gold could look like this: w₁ = 0.6 (Tail Risk), w₂ = 0.2 (volatility regime), w₃ = 0.18 (credit stress) = 0.1, w₄ = 0.22 (detection of extremes using the put/call ratio) = 0.1.
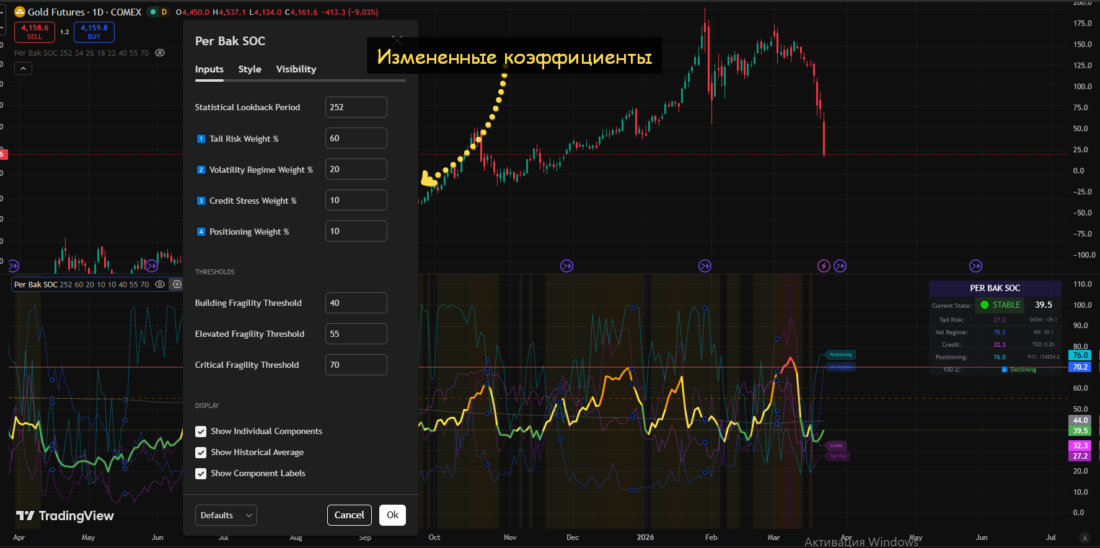
It is clearly seen that when the coefficients change, the signals change and become clearer. The critical signal arose a few days before the sharp collapse. And this signal appeared at the moment of the final formation of the reversal structure. Isn't this what every trader is looking for?
At the same time, as the collapse continues, the indicator shows a stable state of the system.
Another configuration option is to change the regime threshold parameters.
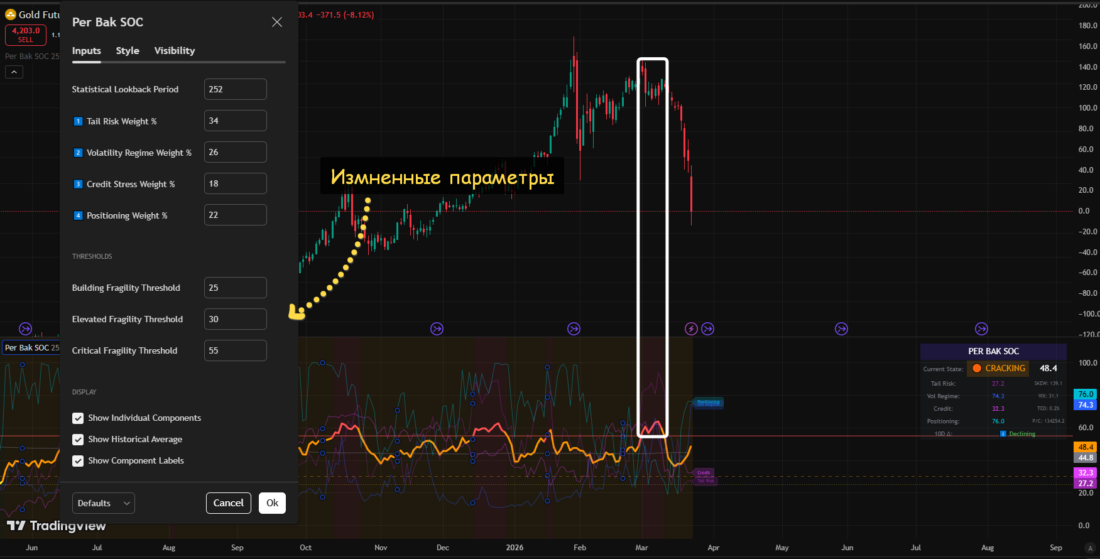
Instead of the standard values of fragility (vulnerability) (building fragility threshold) we will set 25, elevated fragility threshold (growing vulnerability) - 30, and critical fragility threshold (critical fragility threshold) will be equal to 55.
We see a very clear identification of the moment when the system can go into a tailspin. Which, in fact, is what happened.
Thus, the Per Bak Self-Organized Criticality indicator may well become an additional analysis tool for thoughtful trading. The developer states that the indicator works best on the daily timeframe. This is what we will proceed from.
What is important to understand and what you need to learn

The most common mistake is to think that self-organized criticality gives an accurate forecast: “there will definitely be a collapse now.” Actually, no.
This idea is not useful for accurately predicting the moment, but for understanding the structure of risk. In other words, SOC says not “when”, but “why”: why rare events need to be taken especially seriously, why large movements are possible, why the market can be quiet for a long time before a sharp impulse.
Theory does not at all replace technical analysis, fundamental analysis, etc. It, we repeat, only structures thinking and explains movements from a modern scientific point of view.
The main conclusion that can be drawn is this. Based on the theory of self-organized criticality, any trader can and should ask himself simple questions every day:
- Is the market calm now or is it just building up tension?
- Are there too many obvious stops in one area?
- Is the range before the breakout too narrow?
- Am I ignoring a rare but dangerous scenario?
- Is my risk sufficiently limited if an avalanche occurs?
This approach makes the trader more careful and professional. He begins to understand that the task is not to predict every avalanche, but to avoid being in its path without protection.
What about smart money and self-organized criticality?
From a practical point of view, it is often worth proceeding from the fact that smart money prepares markets for those very avalanche-like movements. And they fuel price impulses with their liquidity.
This is an obvious and understandable story, which, at first glance, cancels the self-organization of the financial system. But is this so?
On the one hand, smart money “feeds” on the fears of the “crowd”, often using their energy to start a movement or reversal (spikes, etc.).
But, on the other hand, if you look at it from a distance, smart money is part of the financial system. Yes, this is a part endowed with goal-setting, but this does not negate the fact that from the point of view of an external observer (a scientist or even an alien), the financial market obeys the laws described in the theory of self-organized criticality. And that same “crowd” can send the market into a tailspin.
Or do you think that the last trade that sends the market into a tailspin cannot be the grain of sand that causes the avalanche?
That's all.