
Secrets of the Stochastic You Didn't Know

Hello, fellow forex traders!
Many of us treat the classic indicators available by default in the trading terminal with neglect. And for nothing.
Do you know how they got there, why they actually became classics? Because they work. They worked perfectly many years ago, which is why they became famous, and they still work now.
And today we will talk about perhaps the most famous oscillator, the Stochastic (Stochastic Oscillator). We will talk about how this indicator was created, what it means, as well as strategies for its application, and you have probably hardly heard of many of them)
Meet the Stochastic!

About thirty years ago, the prevailing belief among market analysts was that exchange prices depend on such a large number of factors that forecasting them is impossible. However, the systematization of exchange-trading experience and the development of computer technology clearly showed the possibility of forecasting price behavior in the market. The tempting prospect of "making" big money pushed many mathematicians to develop various methods of price forecasting. These methods later came to be called "indicators".
The number of known indicators has long been in the thousands. Despite the fact that some of them are known only to a narrow circle of specialists, many indicators are well known to most traders, including beginners. One of the most popular indicators (including in forex) widely used in trading systems is the stochastic oscillator, which George Lane began developing back in the early 1950s. This oscillator, popularized by George Lane, is very similar to the RSI line. Wells Wilder's Relative Strength Index (RSI) and the stochastic are the two most popular and well-known improvements of Larry Williams' basic %R oscillator, which is essentially the same stochastic, just not as smooth, and with the scale turned upside down.
So, the stochastic belongs to the group of the most popular indicators. It can be found on all available services offering various charts, in all software packages for trading, and MetaTrader 4 is no exception here. And nevertheless, many traders, especially beginners, use it incorrectly.
History of Creation
The stochastic oscillator was developed in the late 1950s by George Lane, president of Investment Educators Corporation. All calculations had to be done by hand, and a group of traders developed formulas for oscillators, successively giving them the names %A, %B, %C, and so on. Only three proved workable: %K, %D, and %R. According to legend, one of the Poles who was helping Lane in some way had a friend, an old immigrant from Czechoslovakia. He told him in his broken English about a formula they used in Czechoslovakia when it was necessary to find out how much limestone had to be added when smelting iron ore in order to obtain steel. They took this formula, adapted it for their purposes, and began to play with it. That is how the stochastic came into being.
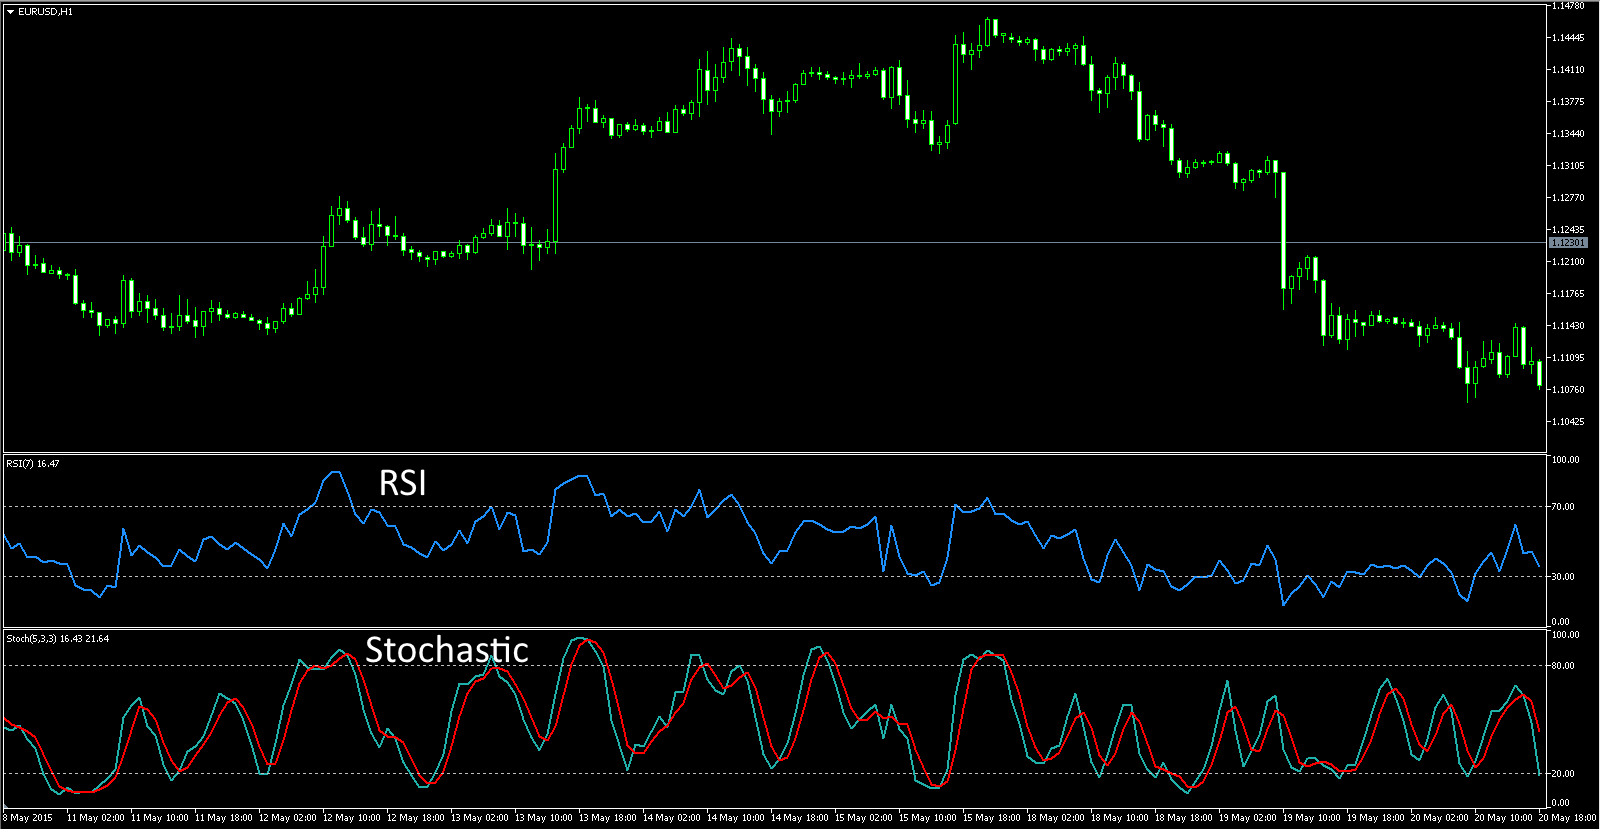
The first two curves (%K and %D) are known as Lane's stochastics, while the latter (%R) bears Larry Williams' name. Another version of the origin of the names of the stochastic indicator lines is this: %D comes from the word deviation, and %K comes from Kelly, George Lane's middle name.

George Lane was going to become a doctor, like his father. One day he accidentally visited the exchange, and what he saw interested him greatly. In the late 50s, Lane bought himself membership on the Chicago Open Board of Trade for 25 dollars, now known as the MidAmerica Commodity Exchange, and began trading grain. Later George Lane became president of Investment Educators Inc. and invented the stochastic, an indicator widely used all over the world. George Lane died on July 7, 2004.
What Does the Stochastic Measure?

The stochastic oscillator is an indicator of the rate of change, or price momentum. The stochastic assesses market speed by determining the relative position of closing prices in the range between the high and the low over a certain number of days. The simplest oscillator takes the current price and subtracts from it the price that existed several days ago. Suppose trading in EURUSD closed today at 1.2050, and 10 days ago at 1.2000. In this case, the oscillator value would be 0.0050. The process is repeated every day, and the data are plotted on the chart.
For example, a 14-day stochastic indicator measures the position of closing prices within the entire range between the high and the low over the previous 14 days. The stochastic expresses the relationship between the closing price and the high-low range as a percentage from zero to 100. A stochastic oscillator reading of 70 and above shows that the closing price is near the upper boundary of the range; a stochastic reading of 30 and below means that the closing price is near the lower boundary of the range. That is all. Put simply, if you see a reading of 50%, it means that the closing price lies exactly in the middle between the high and the low. If the reading is 75%, then the closing price is located between the high and the low at the 75% level. In other words, it would be at 75% of the daily range or closer to the high than to the low. Thus, if the market closes at the high every day, then you can see only a stochastic reading equal to 100%. The main idea is that if the market shows a tendency to close in the upper part of the daily range, then it is bullish; if in the lower part, then it is bearish.
Oscillators will report a market reversal before the price actually changes, because changes in momentum lead to changes in the actual price. The same thing happens in physics: the rate of change of an object's speed will show a decrease in momentum until the object changes direction.
Serious criticism is caused by the fact that oscillators sometimes give a signal to trade while the market is in a state of a strong trend, and the signal turns out to be false. It is known that oscillators perform well in non-trending markets and poorly in trending ones. The simpler the oscillator, the more sensitive it is to changes in the current market price. For example, a simple oscillator based on a 10-day rate of change is more sensitive to changes in the current price than an oscillator based on a 30-day rate of change.
Many analysts suffered greatly from using simple oscillators, so they tried to improve them. The stochastic shows the position of each closing price within the previous interval of maximum and minimum prices. The stochastic is more complex than Williams' %R. It contains several steps for removing market noise and suppressing bad signals. The stochastic consists of two lines: a fast one called %K and a slow one called %D.
The most common and classic formula for calculating the Stochastic is the following:

where max(Hn) is the maximum high over N periods
min(Ln) - the minimum Low over N periods
C0 is the closing price of the current period.

i.e. the moving average with period M of %K
This version of the Stochastic indicator calculation is used in most technical analysis programs.
However, several other variations are also known, for example:

where

- moving average with period N of the minimum price over the last 3 periods

- moving average with period N of the maximum price over the last 3 periods
Similarity to the RSI Line
As I already said, the stochastic is very similar to the RSI indicator, which we already examined not so long ago.
The time period for both indicators is usually 9 or 14. The stochastic is also placed on a scale from 0 to 100. However, its overbought and oversold boundaries are slightly wider than those of the RSI, in the sense that stochastic readings above 80 are a signal of overbought conditions, and below 20 of oversold conditions. This is because the stochastic oscillator is more volatile than the RSI. Another main difference is that the stochastic oscillator uses two lines instead of one. The slower %D line is the moving average of the faster %K line. It is precisely the presence of two lines instead of one that distinguishes the stochastic from the RSI line and gives the former greater significance. The fact is that precise trading signals on the stochastic oscillator are given when the two lines cross, and when their value is above 80 or below 20.
Indicator Parameters and Calculation
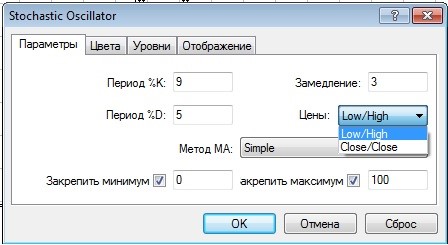
The %K line period is the period of the oscillator itself.
The %D line period is the period of the oscillator's signal line, which is simply a moving average of the %K line.
Slowing is the additional smoothing of the %K and %D lines.
Prices are the choice of prices for calculating the oscillator: by candle highs/lows or by closing prices.
The MA method is the method for calculating the %D line, everything is exactly the same as for a regular moving average.
One of the stochastic lines is denoted by a solid line, and the other by a dashed line:
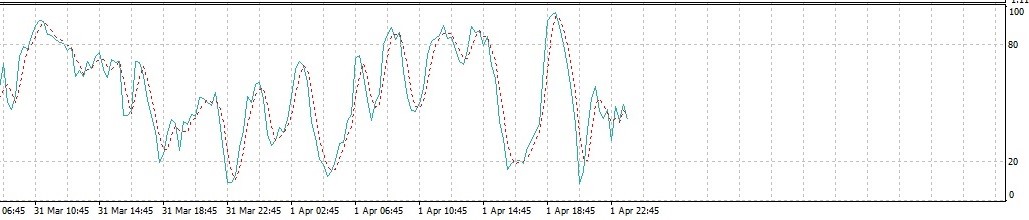
The solid line is called the main line, which is the %K line. The dotted line is called the signal line, this is the %D line, which is a moving average of the main %K line.
I will give an example of calculating the indicator with parameters 1433.
Fast line (%K) = 100 [(close - the lowest value over 14 days) /
(the highest value over 14 days - the lowest value over 14 days)].
Slow line (%D) = a 3-period moving average based on the %K line data
Then both resulting lines are smoothed with a 3-period moving average. We see the result on the chart. Such a stochastic is called slow because of this very additional smoothing. To get a fast stochastic, it is enough to replace our parameters from the example with 1431. Most often, it is the slow stochastic that is used.
The most important stochastic setting is the first of the three parameters: it is the stochastic window, which determines the number of bars included in the calculation. The other two parameters determine only the degree of smoothness of the fast and slow lines. The creator of the stochastic, George Lane, recommended a period from 9 to 21, while the authors of the book "Computer Analysis of the Futures Markets" recommend parameters 9-15. At the same time, parameters 533 are used by default in the MetaTrader 4 platform.
To determine the most optimal stochastic period, it is worth conducting your own research, taking into account that for each currency pair and each timeframe the optimal period will be different. At the same time, in the general case I can recommend some ranges for searching for optimal values: up to M30 - period 9-13, H1 - 14-21, H4 and above - 5-9. At the same time, do not forget that for searching for divergences and determining overbought/oversold conditions, it is most reasonable to use different parameters. And, naturally, as always, the higher the indicator period, the less sensitive it becomes to insignificant market fluctuations and the later it will react to price changes, lagging more strongly.
The overbought/oversold levels for this indicator are usually considered to be 20 and 80, but you are, of course, not limited in choosing these levels on your own. In a calm market, during scalping in the Asian session, for example, a fast stochastic with settings 7/3/1 and levels 30 and 70 is perfectly suitable.
The author of the indicator recommends applying the stochastic on daily and weekly charts, since it is on them that it generates the most reliable signals. At the same time, it is known that the same George Lane (the creator of the stochastic) had a habit of using it with 3-minute bars when trading S&P 500 index futures.
Fast Stochastic Versus Slow

I mentioned the existence of two stochastic variants: fast and slow. The fast stochastic has a large number of jagged edges and sharp jumps, so most traders use the slow stochastic. The lines of the slow stochastic are considered more reliable, but at the same time they lag more strongly.
Main Signals of the Stochastic Oscillator

The interpretation of stochastic signals is similar to the interpretation of the RSI line. These are situations of overbought and oversold conditions (in this case, however, the level values are 80 and 20), and the search for potential divergences. Unfortunately, when studying the movements of stochastic lines, such powerful tools as in the case of RSI are usually not adopted, such as the search for chart patterns (triangles, flags, head and shoulders, and so on), levels and trend lines.
But what distinguishes the stochastic from RSI is the additional line, which adds a truly valuable ingredient to this oscillator. Nevertheless, some traders still apply levels, trend lines, and patterns to the stochastic, so experiment: after all, the stochastic and RSI are similar.
- Divergence.
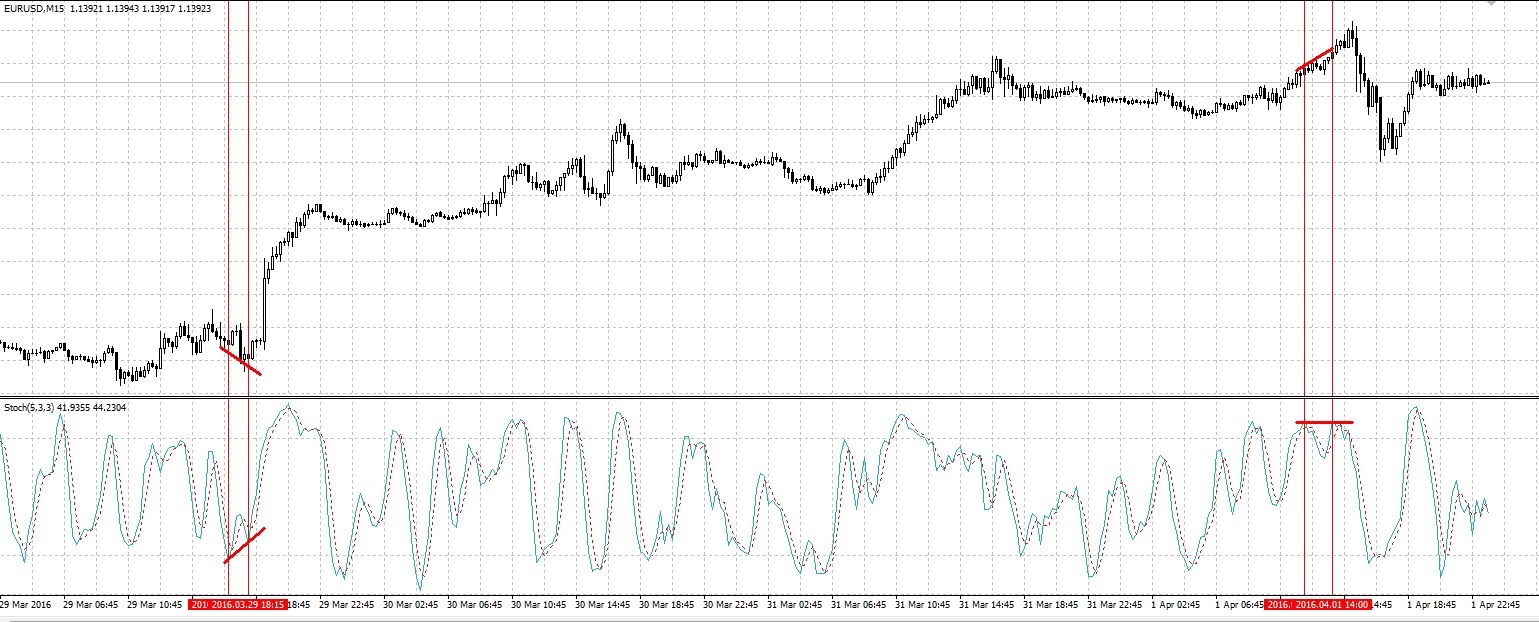
The best signal from the stochastic oscillator is considered to be the divergence or discrepancy of the %D line or the %K line with price. When price reaches a new lower low, and the oscillator gives a higher low, a divergence arises and a good buy signal appears. Which of the lines to take for determining divergences, each trader should decide for themselves. At the same time, as can be seen in the illustration, it is worth taking only divergences formed inside the overbought/oversold zones - they are more reliable.
By the way, short and long divergence are distinguished separately. A short one occupies a period of 3-7 bars (as in the picture above), a long one is more stretched out over time.
2. Overbought and Oversold Levels.
By default, levels 80 and 20 are taken as overbought/oversold levels.
Stochastic oscillators work best in wide price ranges or in gentle trends with a slight upward or downward slope. The worst market for normal use of stochastic oscillators is a market in a steady trend and subject only to minor corrections.
The stochastic oscillator, in the case of a steady strong trend, can remain beyond the overbought/oversold levels for a long time, therefore the crossing of these levels by the indicator is a bad signal for entering a position:
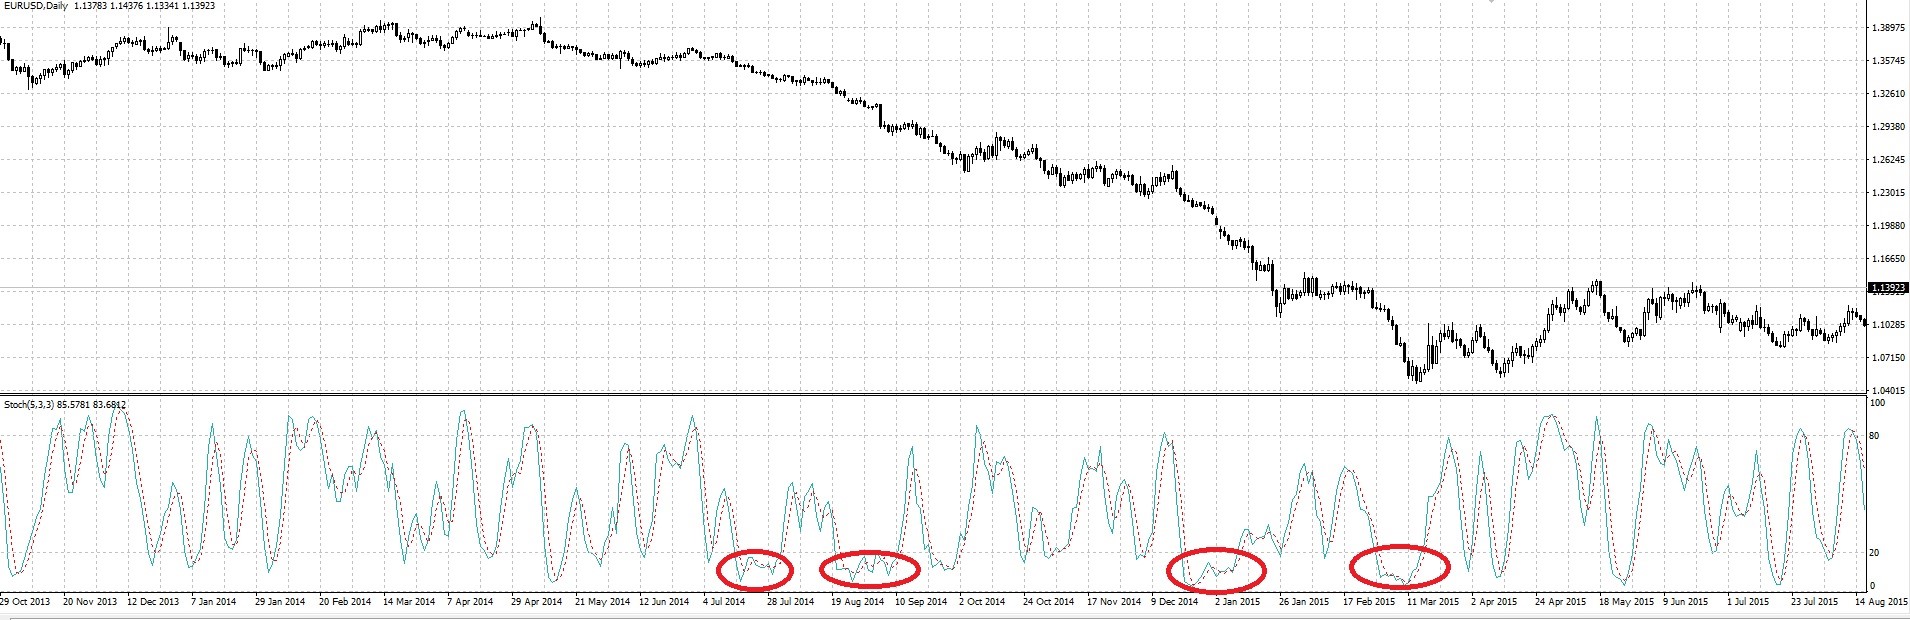
The reverse crossing of these levels by the indicator can be an entry signal during a correction toward the main trend, while Fibonacci levels can serve as a good filter:
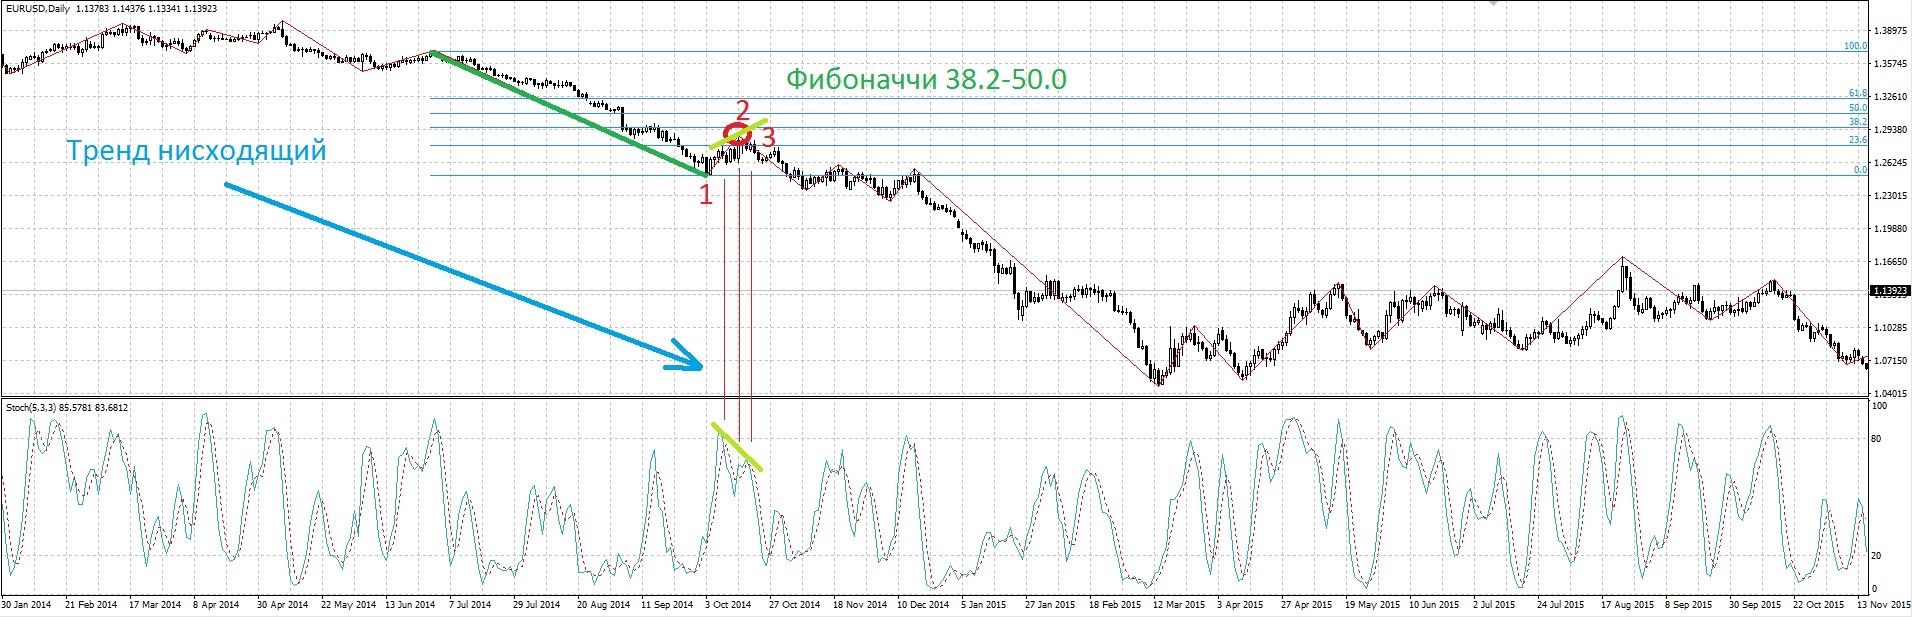
In the chart above, at point 1, the stochastic already signals a selling opportunity. At the same time, price has not yet reached the Fibonacci level of 38.2% of the previous move (for different pairs, these values need to be determined empirically depending on the pair's volatility, on average from 38.2% to 61.8%), protecting us from an early entry. At point 2, price reached the 38.2% level. At point 3, a divergence formed, after which the main and signal lines of the indicator crossed.
3. The 50 zero line.
Based on the indicator formula, it is quite obvious that when the stochastic spends most of its time in the range from 100 to 50, there is an upward trend, and conversely for the range from 0 to 50. At the same time, one can even enter the market when the stochastic crosses the 50 line. And for the entries to be sufficiently precise, you simply need to take a sufficiently large indicator period:
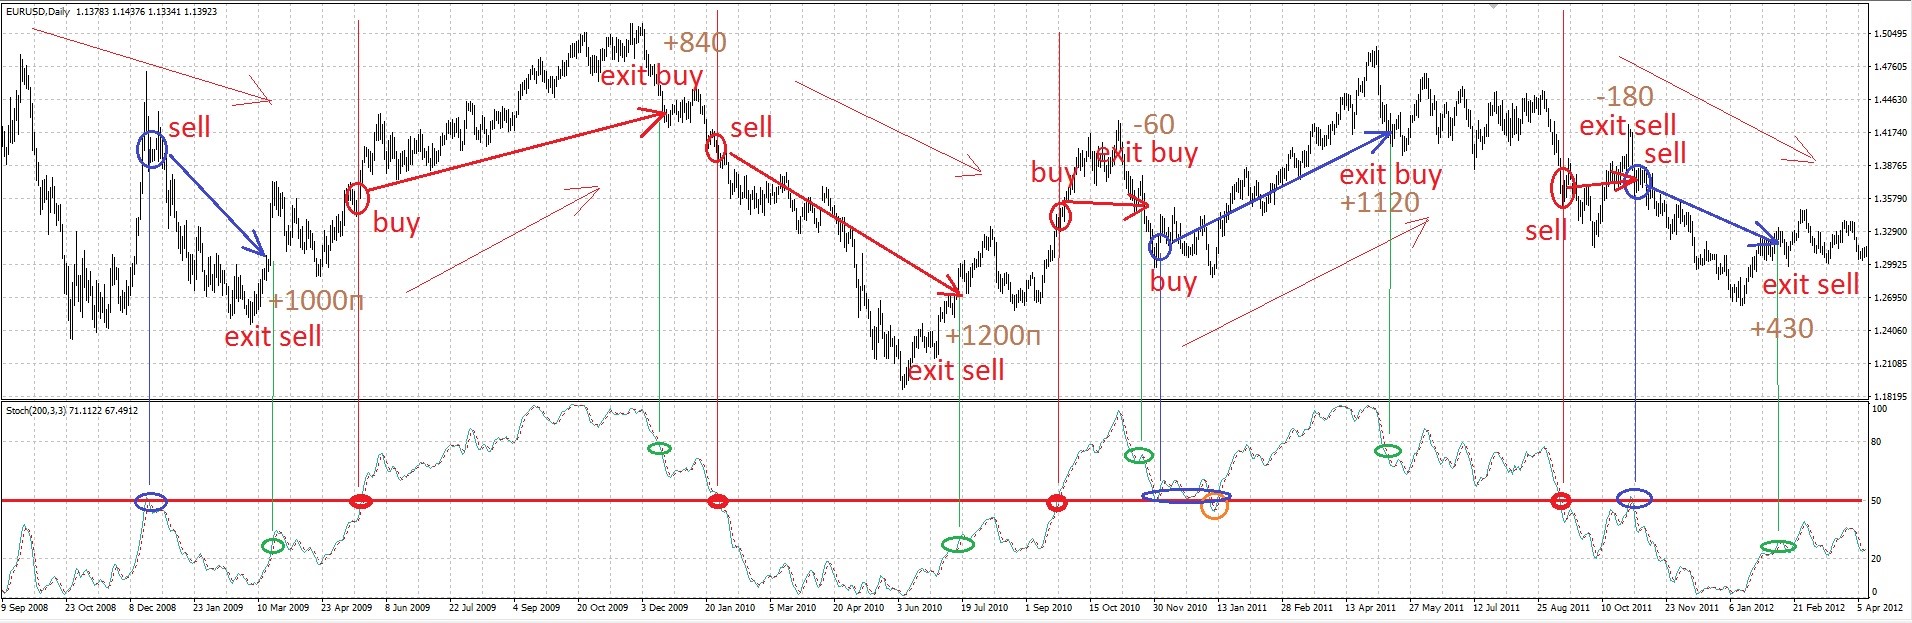
As you can see, this indicator application alone can already become a fairly profitable trading strategy by itself. In the chart above, the red circles are the places where the indicator crosses the 50 line, potential trade entries. The green circles are the recommended trade exits (exit from the overbought/oversold zone). The blue circles are an option for an additional entry into the position on a rebound from the 50 level (entry after the main and signal lines cross). The orange circle (the only one in the picture) is a false signal that could have led to some losses, which are nevertheless more than compensated by the profit. The trades in the example for the period from January 2009 to February 2012 on the daily chart of the eur/usd currency pair produced a total of 4350 old points, which with a deposit of 1 000 dollars and trading a fixed lot of 0.1 over those three years would bring 4 350 dollars in profit with a maximum drawdown of 180 dollars.
But the point is not the numbers, but the fact that any way of trading with the stochastic, with the right approach, patience, and consistency, is actually capable of bringing profit. Note how simple this TS is, even though it does not claim to be complete and was born in my head after 3 minutes of looking at a chart with the stochastic indicator.
4. Crossing of the main and signal lines.
The main signals of the stochastic oscillator are the crossings of the %K and %D lines. Any crossings should be analyzed within the overbought/oversold zones.
A distinction is made between right-side and left-side line crossings:
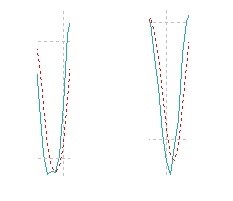
In the chart above, the left-side crossing is on the left, and the right-side crossing is on the right. The right-side crossing is considered more reliable.
There is another interesting feature in analyzing the crossing of the main and signal lines: a failure when trying to exit the overbought/oversold zones. In the chart below, two such cases are marked, which as a rule lead to a further prolonged rise or fall (to a fall for the examples shown). The main line crosses the signal line in the overbought/oversold zone and then reverses, the bulls/bears did not have enough strength. As a rule, the indicator continues to move inside the zone for some time while price continues its movement. To avoid such cases when applying any of the stochastic signals, I always recommend waiting for the indicator to exit the zone.
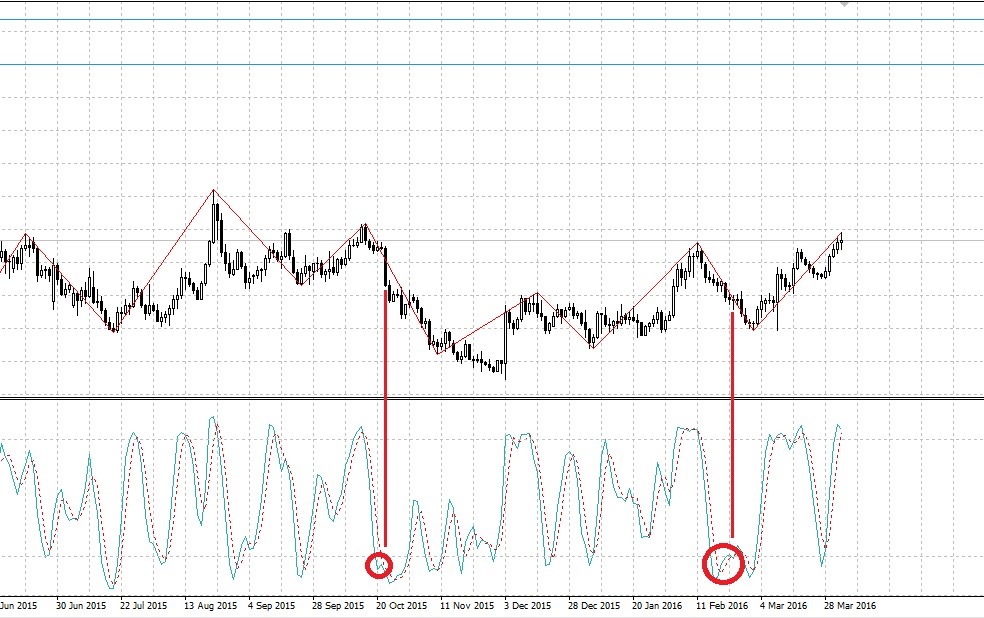
Based on this small secret of using the stochastic, I once came across an entire trading system by which a trader traded quite successfully (unfortunately, I do not remember the details). I am sure that such a use of the indicator would hardly occur to many people. By the way, this variation occurred to such a well-known trader as Alexander Elder. In one of his books, he calls this technique a "stochastic pop," explaining this phenomenon as the final price impulse before a trend change.
It is also worth paying attention to the shape of the indicator's lows and highs in the overbought/oversold zones. If the low is sharp, the bulls are strong and the upward movement will be swift; if it is rounded, then the upward movement will be sluggish.
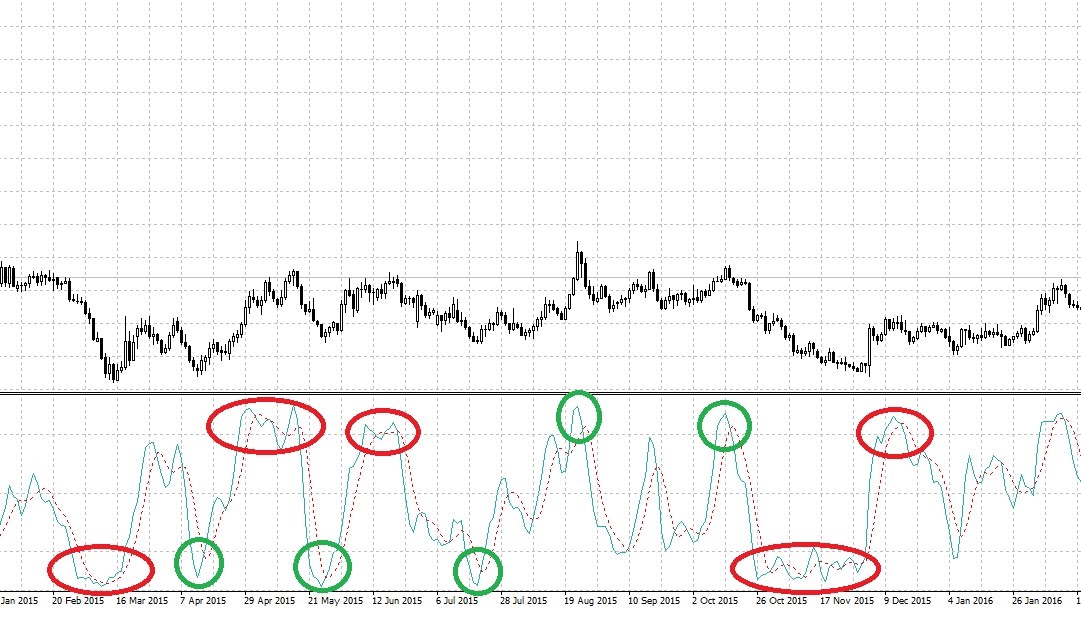
In the picture above, the broad reversals are highlighted in red, and the narrow ones in green.
5. Direction of the stochastic lines
Usually, the stochastic fluctuates from the overbought zone to the oversold zone and back. It also often changes its direction when approaching the 50 level.
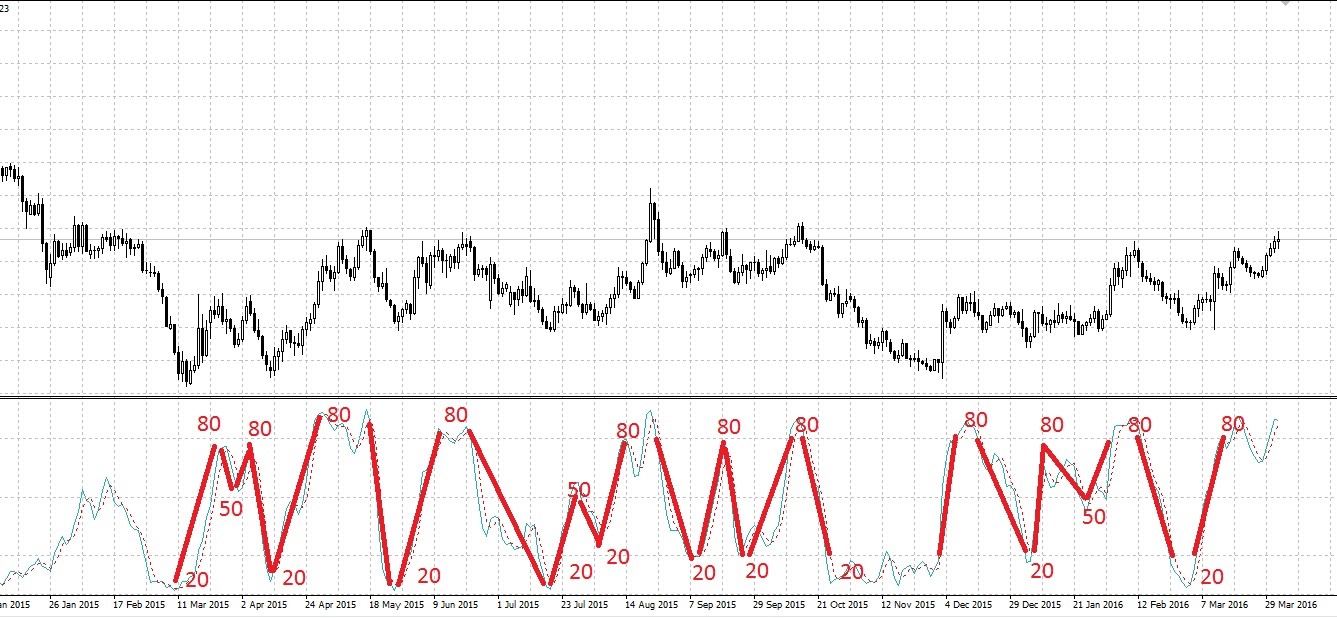
That is, it turns out that if the stochastic has exited the oversold zone, then it will most likely reach the 50 level and, possibly, the 80 level.
Likewise, when exiting the overbought zone, the indicator will most likely reach the 50 level and, possibly, the 20 level. Accordingly, when the stochastic is directed upward on the daily timeframe and is located between 20 and, say, 30, it is logical to assume that the indicator will reach the 50 level. For the D1 period, this movement of the indicator from 20 to 50 may take only a couple of candles, but on the H1 timeframe this movement will look like a full-fledged trend. I hope you caught my point: you can forecast price movement on lower periods by analyzing the direction and position of the stochastic relative to its levels on higher periods.
Also, such a variant is often encountered: upon reaching the 75 level on daily charts, the trader looks for a point to enter buys on the hourly chart. With a high degree of probability, the stochastic on the daily charts will reach the 80 level and above, which on the hourly timeframe can bring substantial profits. According to Jake Bernstein, half of strong market moves arose when the stochastic overcame the 75 and 25 barriers.
Using Stochastic with Other Indicators

The stochastic is recommended for use together with RSI. Since the stochastic is quicker, it gives signals earlier than RSI, but its signals are considered less reliable. By combining RSI and the stochastic, you can filter out weak signals. The stochastic is also recommended for use with trend indicators (as, in fact, are all oscillators).
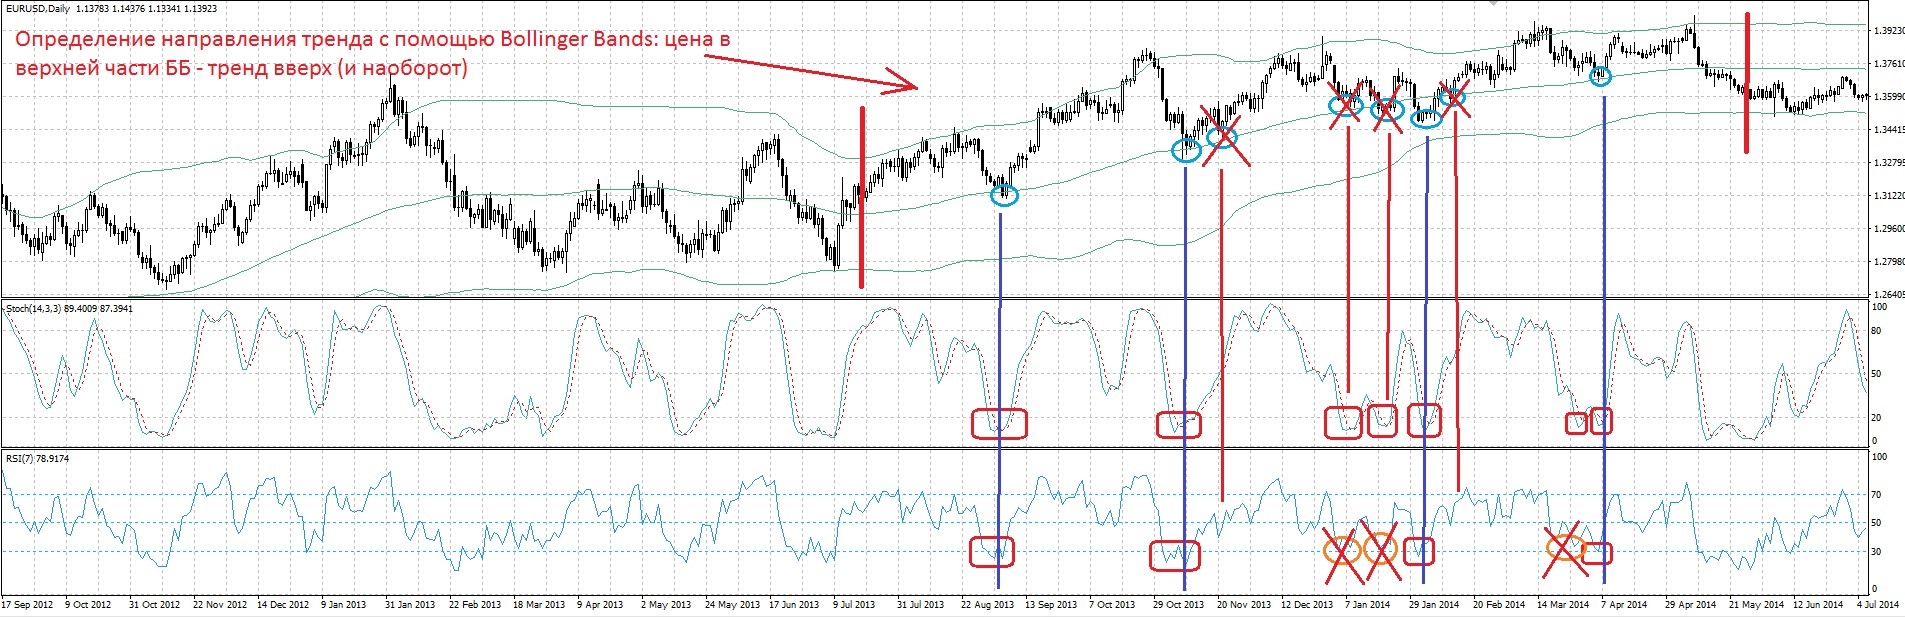
In the figure below is a simple trend system that implies entering with the current trend on a pullback. Bollinger Bands (100) are used to determine the presence and direction of the trend. If the BB is rising and price fluctuates in the upper part of the BB, the trend is upward. If the BB slopes downward and price is in the lower part of the BB, the trend is downward. In this case, entry into the market is made on a pullback to the middle BB line. If price moves within the BB from the lower boundary to the upper, the trend is sideways and entries can be made from the BB boundaries inward.
Trades are filtered using the RSI (7) and Stochastic Oscillator (14,3,3) indicators. In a trend section, during a pullback to the middle of the BB, it is important that both oscillators be in the overbought zone for a downtrend (oversold for an uptrend). The trade is executed when they exit the zone.
Notice how the oscillators filter every approach of price to the middle BB line, warning against an early entry into a position. At the same time, the RSI indicator filters the stochastic's readings.
Conclusion

The stochastic is undoubtedly one of the most popular indicators, but like all other indicators, it needs to be used correctly and in the right context.
Today I have broken down various ways to apply this remarkable indicator and suggested several basic trading systems that use it, which I hope will help you develop your own trading system. Of course, there are a great many nuances to using this indicator on Forex, but covering them all within a single article is simply unrealistic. Therefore, if you have some original way of using the stochastic, you can share it in the comments to the article or on our forum.
Indicator thread on the forum (+ more than 600 versions of the indicator)
Respectfully, Dmitry aka Silentspec
TradeLikeaPro.ru