
Secrets of Profitable USDJPY Trading

Good day. Since time immemorial, among forex traders it has been believed that trading the USDJPY currency pair (dollar/yen) is difficult, because its movements are unpredictable. This is not entirely true. The main reason for the difficulties is a lack of knowledge. Many traders simply do not know its features.
In today's review, we will discuss how to trade USDJPY after all, Japan's economy, what affects the quotes of the currency pair, and trading strategies directly.
Japan's Economy

Let's start with the economy of the country of the rising sun.
By GDP size, Japan ranks 3rd after the USA and China. Industry, electronics, and food production are developed in the country. What is the first thing that comes to mind when Japan is mentioned? Of course, it is rice. It was rice merchants who invented Japanese candlesticks, which we now use in trading.
It is worth remembering that the country's economy is sensitive to oil prices. It has little of this resource, and this makes Japan a country heavily dependent on "black gold."
The Bank of Japan officially appeared in 1873 after the adoption of the corresponding banking law.
Interestingly, the central bank itself belongs to the state only by 55%. The remaining 45% is divided among the bank's shareholders, whose shares in turn are traded on the Japanese stock exchange.
The interest rate is very low and is within 0-0.1%. It is this factor that leads to the popularity of loans in yen. It is very convenient to take a cheap loan and buy some stocks or another currency with it.
The state intervenes in both the stock and currency markets. Surely you have come across mentions of the famous interventions, that is, mentions of the state's deliberate influence on currency quotes. For those who are not aware, previously the state restrained the growth of the yen by selling it on the currency market.
Many traders waited for them, because they were characterized by sharp quote movements on which one could profit. Unfortunately or fortunately, the state no longer conducts interventions. Therefore, if somewhere you come across advice that when trading USDJPY you can expect interventions at any time, do not believe it, this advice is already outdated.
At the moment, the state's stimulus program is in effect. It appeared in 2012 and is aimed at supporting the country's economy, as well as increasing inflation. Remember that inflation is beneficial to the government, since it increases the attractiveness of international trade with Japan.
The central bank purchases long-term government bonds and shares of large companies, and also acquires other financial assets, including shares of funds investing in real estate.
The USDJPY Currency Pair

Let's look at our currency pair in the terminal. This is what the yen chart looks like at maximum zoom-out:
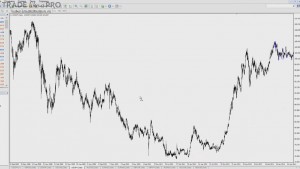
We can see a long-term downward trend, which in the autumn of 2012 changed to an upward trend. It continues up to the present time:
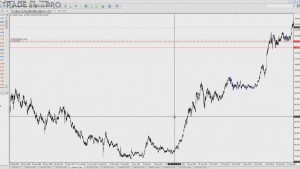
This means that the dollar rate is rising, while the yen rate is falling.
Since the downward trend has existed longer in duration than the upward trend, when opening monthly charts there will be the following situation on the market:
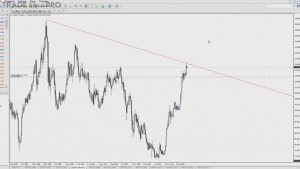
A more long-term downward trend is clearly visible.
But I remind you that the government supports inflation in the yen, so overall, personally, I expect further growth of this pair.
USDJPY Volatility

The volatility of the USDJPY pair, according to data for the last year, is approximately 90 points per day:
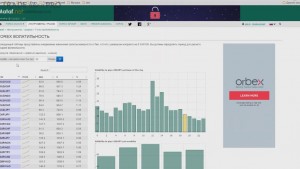
In percentage terms, this is about 0.7%.
Compared to EURUSD, our pair has slightly lower figures. Let me remind you that EURUSD volatility is more than 100 points, and the percentage change is 0.96%.
The peak volatility for the USDJPY pair was observed in 2013:
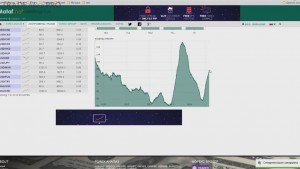
At the moment, volatility is at an average level.
The most volatile time to trade this currency pair is the opening of the American session, namely 12:00 Greenwich time:
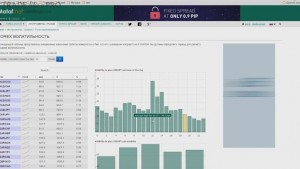
A good volatility indicator is also observed during the London session.
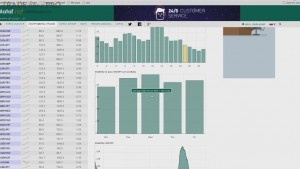
The most volatile day is Wednesday, that is, the middle of the week:
Correlation of the USDJPY Currency Pair

When trading USDJPY, one should not forget about the strong correlation of the pair with the Japanese stock exchange index:
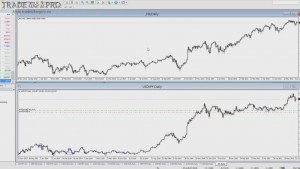
When trading on time frames from H4 and above, you can open the Nikkei 225 chart and compare it with the USDJPY chart.
If, for example, a noticeable downward trend has begun on the Nikkei 225 chart, and the USDJPY pair is not yet falling, then this is a possible signal to sell the currency pair on the market.
At the same time, it is worth considering that while the currency market operates around the clock, Nikkei 225 is traded only during working hours in Japan.
There is also a correlation with the American SnP500 index, but it is not strongly pronounced, since the index includes 500 companies. Although many investors do borrow in yen and then buy American stocks, overall the similarity of movements on the SnP500 with the USDJPY pair is difficult to use in trading.
But it can be, if you hold open positions for a long time:
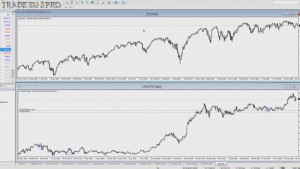
In short-term trading, I would not advise paying attention to the S&P500 index in order to open positions on USDJPY.
In addition, there is a correlation with oil prices:
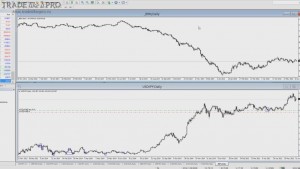
In the screenshot, I have the price chart of Brent crude oil open.
As I already said, it is beneficial for the Japanese government when the price of oil is low. This is because the country has practically no natural resources of its own. If oil becomes cheaper, then the yen also becomes cheaper.
Affordable oil is good for Japan, but this correlation can only be used in long-term trading.
If we recall the sharp start of the strong decline in oil prices in 2014, then we can assume a favorable long-term buy on USDJPY. If oil now starts returning to its old values of 100 dollars per barrel or higher, then it is worth starting to sell this currency pair.
Keep in mind that when trading intraday, you should not refer to this chart. It is recommended for those who hold positions for a long time.
Features of trading the USDJPY currency pair

Let us look at the nuances of trading the USDJPY currency pair.
It is believed that it is very difficult to predict the movement of this pair because it reacts poorly to technical analysis. I would say that it reacts to it in a delayed mode. Where other currency pairs react immediately, the yen will need some time to "think" and build momentum.
I will say right away that candlestick patterns work poorly on charts below the daily. But levels, on the contrary, work well almost down to M15. Still, it is not worth going lower, because a large amount of noise appears.
On M15 charts, levels that work quite well are visible to the naked eye.
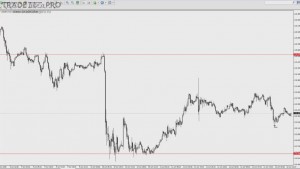
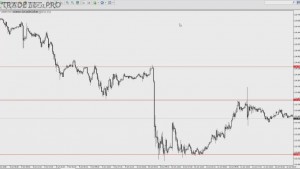
For those who like channel trading, I want to draw your attention to the fact that when the USDJPY pair consolidates, it has a very small range. Therefore, I do not advise trading this pair in that way.
If you still plan to trade in a channel, make sure that it is large enough.
When the USDJPY pair is in a strong trend, it usually moves without large pullbacks. Sometimes pauses occur, but if you have caught a prolonged trend, then hold on to it. The yen can follow it for a very long time. When trading with the trend, you should not focus too much on opposite signals.
If you have been holding a buy for a long time and are observing signs of the trend ending, do not rush to leave the market. This is a feature of this pair. Either do not pay attention to opposite signals, or use various methods such as a trailing stop, or manually mark the nearest levels and move the stop loss after them. If it gets hit, then be satisfied with what you received.
Fibonacci levels for the USDJPY currency pair
Now I will tell you information that is useful for traders who use Fibonacci levels in their trading.
For this pair, the significant levels at which reversals are possible are 23.6 and 38.2:
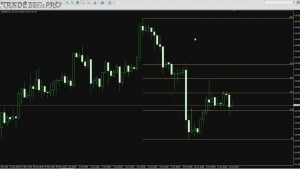
In the screenshot, you can see an example of a downtrend that is observed at the time of writing the article on the H4 charts.
Now let's take a look at the daily charts. This is exactly where a possible continuation of the upward move from 38.2 begins:
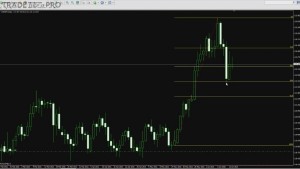
Subsequently, the pair began to rise gradually.
If you use the Fibonacci method in your trading, then on the USDJPY currency pair pay attention to the 23.6 and 38.2 levels.
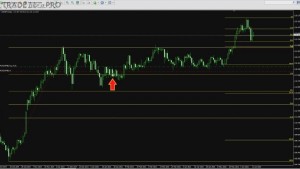
There is one more point that relates to this currency pair. Do not be afraid to enter the same trade several times.
Let's look at this with an example to make it clear. If you had entered a trade somewhere here, your stop loss would most likely have been hit:
Do not be afraid to enter buys again:
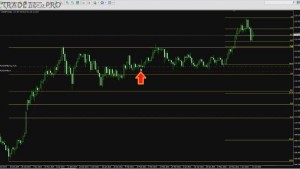
As you can see, if you had a signal and tried to enter the market, but your stop loss was hit, you should not give up right away. If the prerequisites for the same trade still exist, do not be afraid to enter the market again. For this currency pair, this is absolutely normal. This is its specific nature. Technical analysis works worse than on other pairs. The pair's reaction to signals is somewhat delayed.
Strategies for USDJPY Using Volatility
As you remember, I pointed out that the most volatile time for USDJPY is the opening of the American session, namely 12 o'clock Greenwich Mean Time.
What does this information give us?
It is an opportunity to develop a breakout entry strategy after the opening of the American session.
Many of you should be familiar with the strategy “London Explosion”, when entry is made on a breakout of the price channel after the opening of the London session. We can apply a similar strategy to USDJPY.
In the screenshot, I marked with red vertical lines the hourly candle following the American session opening candle:
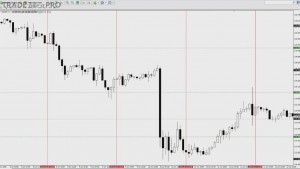
As a rule, after this candle we see the start of a directional trending move. It continues approximately until the opening of the London session the next day. This means that the trade can be held right up to the opening of the London session.
There are very strong moves, and there are neutral ones, but if you choose an appropriate stop loss and exit time, you can make a profit.
Risk Allocation
Now let's talk about risk allocation. In addition to the USDJPY currency pair, there are others such as: GBPJPY, EURJPY, AUDJPY:
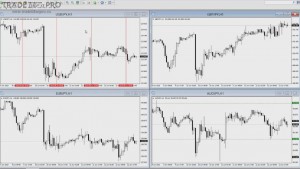
If you trade not only USDJPY, but also some of these, then you should note that the pairs move in a similar way. The movements do not match 100%, but they are very similar. It follows that it is best to divide your risk by the total number of yen pairs you trade.
Suppose that if you use an average risk of 1% per trade and at the same time trade 2 pairs, then you should use 0.5% for each currency pair. Divide your risks so that in case of mistakes you do not take unnecessary losses.
Carry Trade Strategy
Let us also consider the carry trade strategy, which is often mentioned when trading the USDJPY currency pair.
Direct manipulations with this currency pair will not bring you any profit, because the swaps have a negative value:
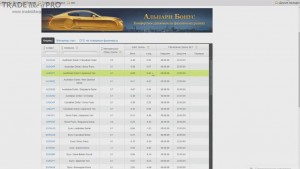
Why does this happen? Because the yen is a cheap currency due to the low interest rate. Large investors take out loans in yen and use that money to buy stocks, currency, or other assets on the American stock market.
If you use some strategy with swaps, then under it you will have to trade the AUDJPY pair, since its swap for long positions is 0.46:
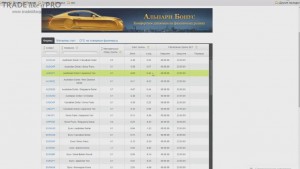
Not some great money, but nevertheless you can make a profit.
What news affects the USDJPY pair
I would like to say right away that this is one of the currency pairs that is strongly influenced by major news concerning the US dollar. They are marked with a red icon on the forexfactory.com website:
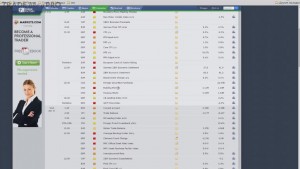
News concerning Japan does affect our currency pair, but over a longer-term horizon. If you have an economics education, you can evaluate it yourself.
For intraday trading, I advise paying attention specifically to the red news on the US dollar, while news on the yen can be ignored.
Let us sum up

Trading USDJPY can and should be done, but it is worth remembering its specifics. Until the policy of the Japanese government changes, in the long term one should consider buying this pair. During the day, attention should be paid to the opening of the American session. It is also possible to build strategies on its basis. If you hold positions for a long time, following the trend, then this trading method is relevant for USDJPY, since trends here are prolonged.
There is little point in trading consolidations, since they have a small range. Interventions in the yen are not currently being carried out. Therefore, if you come across information about them on the internet, you should not pay attention to it. If you use Fibonacci levels in your trading, then for the USDJPY pair the relevant levels are 23.6 and 38.2. Yen pairs move similarly; if you trade several of them at the same time, divide the risk into equal parts.
The pair shows a direct correlation with the Nikkei 225 index. If you trade H1-H4, then open the index chart so that, at the moment it does not correspond with the USDJPY chart, you can use this in your trading. A correlation is also observed with the SnP500 index and oil prices. But this is relevant for longer-term strategies and can be used provided that you hold positions for more than a month.
The most volatile day of the week on the USDJPY currency pair is Wednesday. Price movement is approximately 90 points per day.
Technical analysis works more weakly than on other currency pairs. Candlestick patterns are better viewed on daily charts, and intraday there is no point in trading on timeframes below M15. And most importantly, do not be afraid to enter the market several times, because the yen reacts to technical analysis somewhat sluggishly. I hope that the advice described above will help you in your trading of the Japanese currency.
USDJPY thread on the forum
Best regards, Pavel Vlasov TradeLikeaPro.ru
