
Scalp Inc. M1 Strategy - Wild Hunt for Profit

Hello, forex trader friends! Most trading systems, as is well known, are designed for trading when a trend is present in the market. But the problem is that a trend exists in the market only about 30% of the time. All the rest of the time, price makes zigzag movements that are called a flat.
The solution to this problem is provided by the Scalp Inc. M1 strategy, popular on our forum. This system has its own rules for working with a trend, as well as rules for working with a flat.
As you guessed from the name, we will be talking about scalping on one-minute charts (M1), one of the most difficult ways of forex trading. Ready for the hunt for profit?
Characteristics of the Scalp Inc. M1 Forex Strategy
Platform: Metatrader 4
Currency pairs: EURUSD
Timeframe: M1
Trading time: 03:00-24:00MSK or 0:00-21:00GMT
Recommended dealing centers: Alpari, TickMill
Reference Section

- Installing strategies in MT4
- Working with ProTrader
- Trading sessions on Forex
- Economic calendar
Installation Nuances
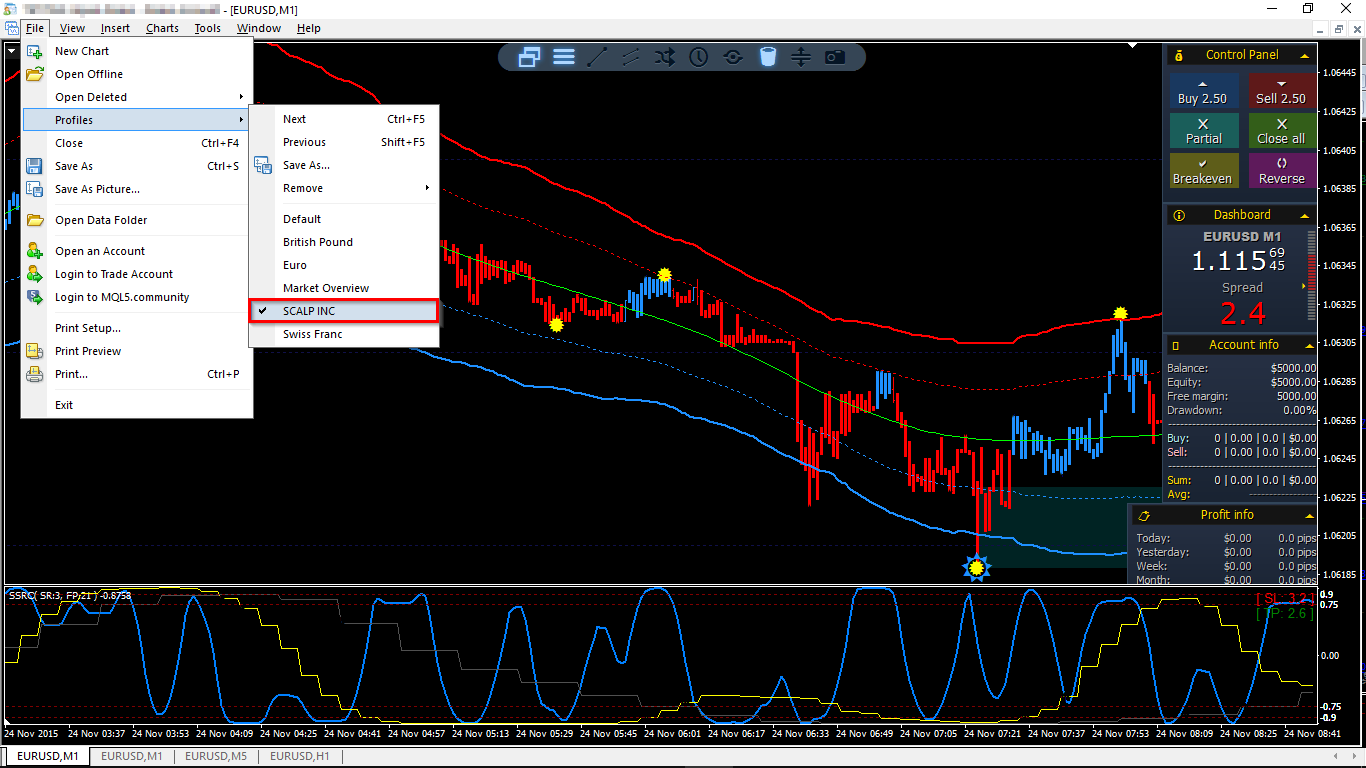
Unpack the contents of the archive into the terminal data directory and restart the terminal. If the profile did not change in the terminal automatically, you can change it manually through the menu.
Different Types of Market
The Scalp Inc system is aimed at working with different types of markets, because all of you are surely familiar with the situation when a strategy that trades well in a trend shows weak or negative results in a flat. In this strategy, separate rules are provided in advance for all possible market conditions. That is, we will first try to determine what we have in the market, a trend or a flat, and then apply the rules that fit the current situation specifically.
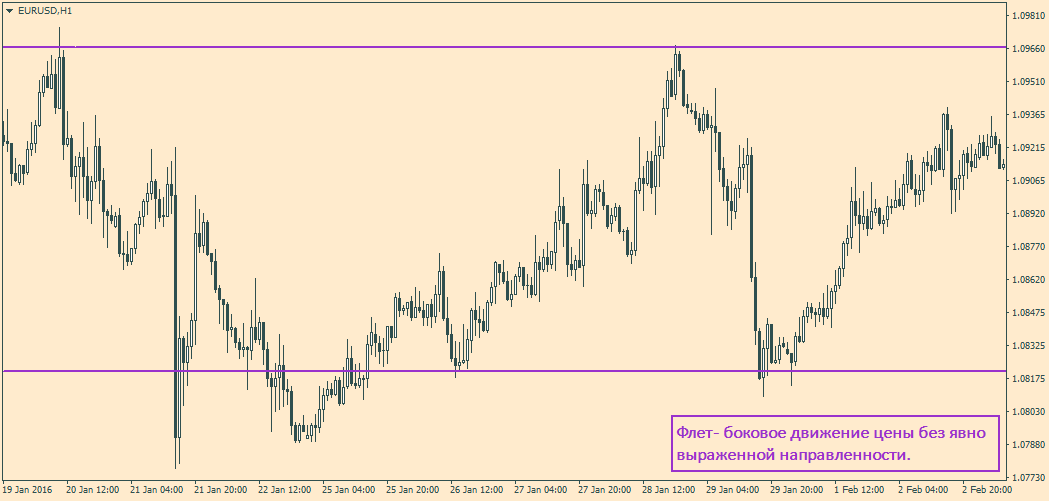
Different types of market behavior require different approaches to trading. According to statistics, 70% of the time the market is in a flat state.
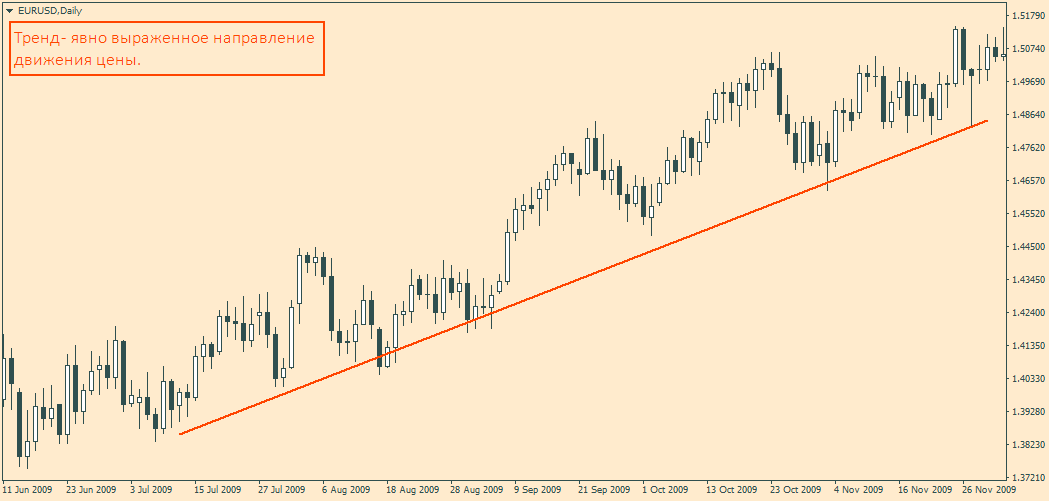
The rest of the time, price has a clearly expressed direction, a trend.
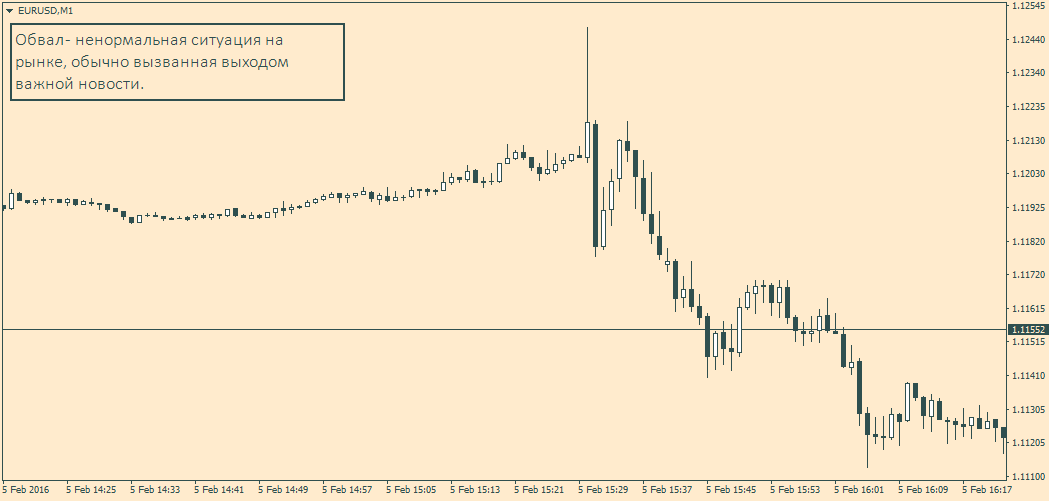
But during the release of an important event in the market, a crash may occur, a condition characterized by a sharp change in the currency rate over a short period of time. At this time, technical analysis patterns stop working, so we will not trade during a price crash.
It often happens that by the opening of a trading session a new trend begins, or the current one changes its direction. This is due to the fact that with the opening of a new session, a large number of new players enter the market and a large number of pending orders are executed.
Therefore, it is important to understand when you should NOT trade:
- Half an hour before and after the release of important news;
- 15 minutes before and after the release of medium-importance news (optional);
- During the Pacific session.
Entry and Exit Rules
Now that we have found out when it is worth refraining from trading, let us move directly to the rules for entering the market. The entry rules will differ slightly for flat and trending market conditions.
Rules for Entry in a Flat Market
First, we need to determine whether the market is currently in a flat. This is fairly easy to do, since most of the time what we see is exactly a flat. If the TMA channel has no clear direction, the market is most likely flat. Also, if the price is between the dotted lines of the TMA channel on the M5 chart, on M1 we will most likely see a flat.
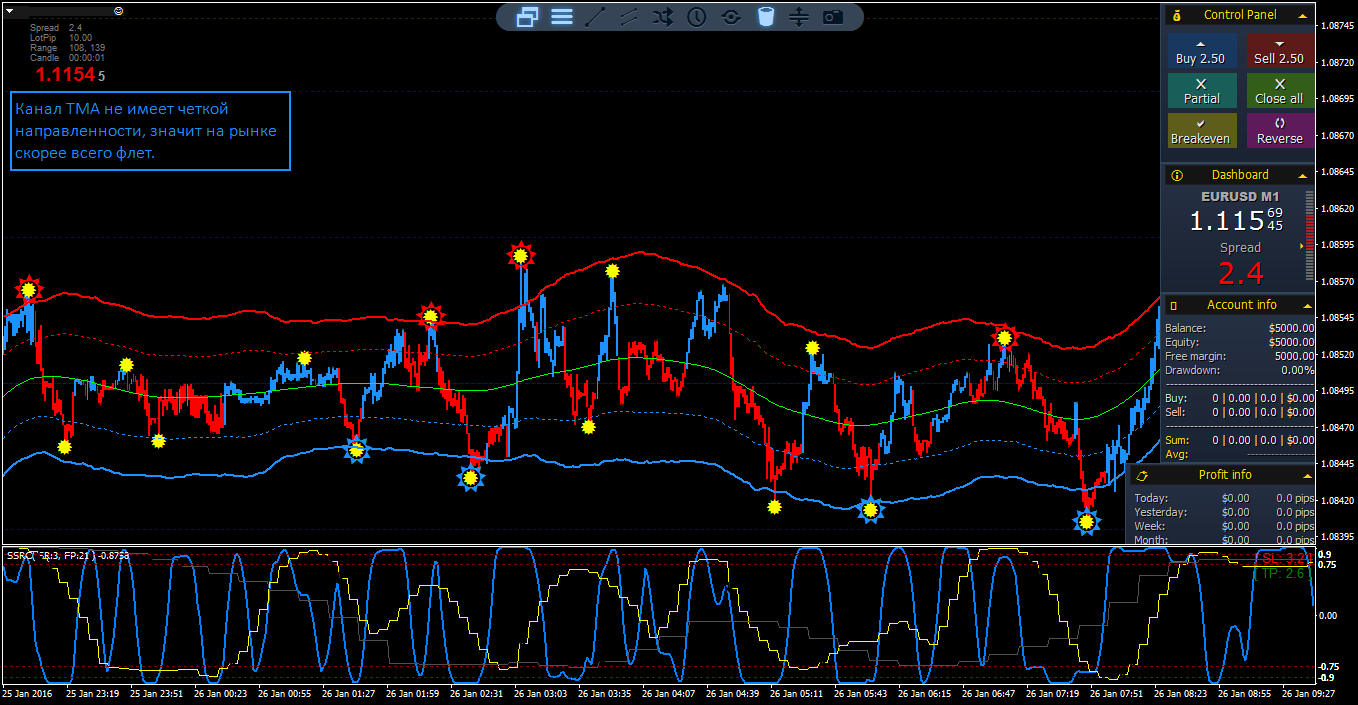
Entry for a buy:
- The blue line of the SSRC indicator is below the -0.95 level;
- The yellow line of the SSRC indicator is at the bottom (ideally, starting to turn upward);
- The price is between the lower boundaries of the FL01-FL02 channels (ideally, the price has touched or moved beyond the FL02 boundaries);
- A signal in the form of a yellow star has appeared on the chart (ideally, it has a blue halo).
Entry for a sell:
- The blue line of the SSRC indicator is above the 0.95 level;
- The yellow line of the SSRC indicator is at the top (ideally, starting to turn downward);
- The price is between the upper boundaries of the FL01-FL02 channels (ideally, the price has touched or moved beyond the FL02 boundaries);
- A signal in the form of a yellow star has appeared on the chart (ideally, it has a red halo).
A good confirmation for the signal will be a bounce off a support line or a pivot.
Rules for Trend Entry
First of all, regardless of the signal direction, we always enter in the direction of the trend. The trend can be determined by the SSRC indicator and the direction of the TMA channel on the M1 and M5 charts. We are dealing with a trend if the SSRC indicator does not reach values of +-0.9 and turns back, while the TMA channel shows a clearly distinguishable slope.
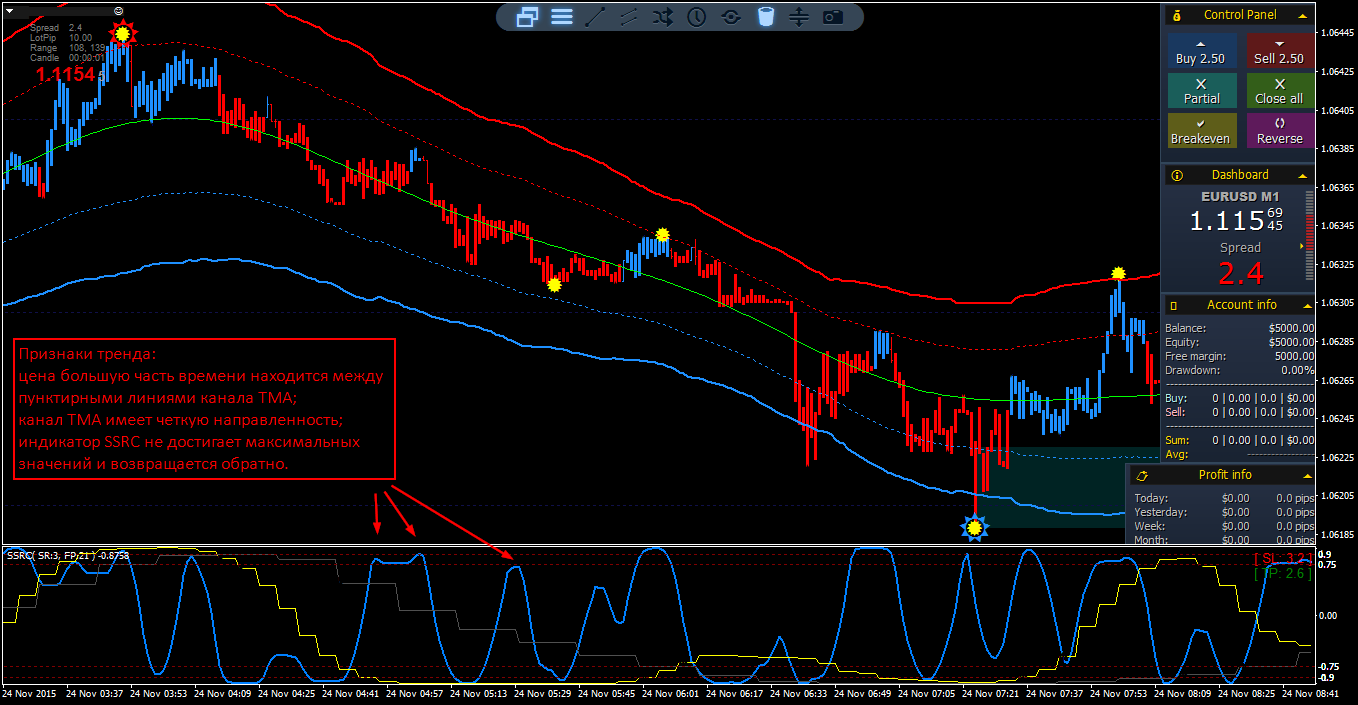
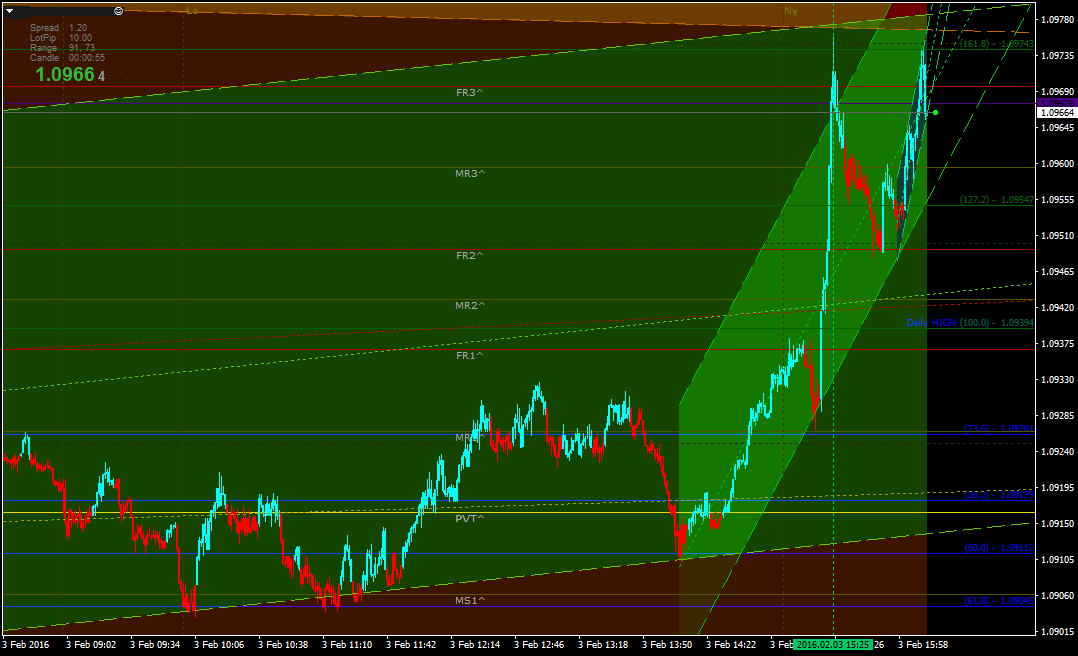
Also, do not forget to look at the additional chart. In this case, the horizontal channel on the auxiliary chart shows a clear upward trend.
Entry for a buy:
- The blue line of the SSRC indicator is below the -0.75 level (ideally, below -0.9);
- The yellow line of the SSRC indicator is at the top or moving upward ;
- The price is between the lower boundaries of the FL01-FL02 channels (ideally, the price has touched or moved beyond the FL02 boundaries);
- A signal in the form of a yellow star has appeared on the chart (ideally, it has a blue halo).
Entry for a sell:
- The blue line of the SSRC indicator is above the 0.75 level (ideally, above 0.9);
- The yellow line of the SSRC indicator is at the bottom or moving downward ;
- The price is between the upper boundaries of the FL01-FL02 channels (ideally, the price has touched or moved beyond the FL02 boundaries);
- A signal in the form of a yellow star has appeared on the chart (ideally, it has a red halo).
Confirmation will be a bounce off the nearest support/resistance level, or a pivot level.
Position Management
Immediately after opening a position, move the stop loss levels behind local price extremes, but no farther than a distance of three ATR. After the price has moved 4 to 6 pips in our direction, it is acceptable to move the position to breakeven. To do this, press the Breakeven button on the trading panel.
Exit from the Position
Exit the position when any of the following conditions is met:
- The SSRC indicator shows an opposite signal;
- An opposite signal in the form of a yellow star has appeared on the chart;
- The price has reached the opposite boundary of the channel;
- Automatic exit at the stop level.
Money Management
The author of the system recommends using a 5% risk per trade (approximately a 0.05 lot per 100$ of deposit). If you use the auxiliary expert advisor, the risk will be calculated automatically when opening a new position;
Additional Recommendations
- To avoid confusion, open only one position;
- We do not use Martingale or averaging, and we do not advise others to do so;
- If the stop is hit, turn off the terminal for 15 minutes. During that time, do 20 push-ups. Physical exercise helps get rid of anger, restore strength, and regain clarity of mind;
- If two stops in a row are hit, turn off the terminal until tomorrow. The same applies if you accumulate four losses in a day.
Conclusion

The Scalp Inc trading system has gained enormous popularity on our forum, and not without reason. A high probability of profitable trades (65% for the system's author, and for M1 that is not little), combined with clear entry criteria, automated exits, and the ability to work a flat, give the strategy every advantage needed so that even beginning forex traders can work with it.
Download the Scalp Inc. Strategy Files

Archive password - forex
Forum Thread
Respectfully, Pavel Vlasov
TradeLikeaPro.ru
