
RSI Secrets + an improved version of the legendary indicator

Hello, fellow Forex traders!
Today we will talk about one of the oldest classic indicators, the relative strength index (relative strength index or RSI for short). This indicator is included in all trading platforms, it is used in thousands of trading systems in any markets. Every trader knows this indicator, but nevertheless, not everyone knows how to use it correctly. That is why in this article I will try to lay out all the features of using this wonderful indicator, and I will also share an extended version.
Characteristics of the RSI indicator
Platform: Metatrader 4
Currency pairs: any
Timeframe: any
Indicator type: oscillator
Trading time: depends on your strategy
Recommended brokers: Alpari, Forex4you
History of creation

The indicator was developed by J. Welles Wilder and published in Commodities magazine in June 1978. Later, Wilder wrote the book “New Concepts in Trading Systems,” where he described in detail the essence of the relative strength index. After the publication of the book, the RSI oscillator became very popular among traders and helped many users assess the strength of the market.
Welles Wilder is an exchange trader, one of the leading specialists in technical analysis, and the developer of many trading systems and indicators. By education, Wilder is an engineer; he managed to work both in his specialty and in real estate, but he became truly passionate about futures trading. For many years Wilder was engaged in technical analysis research, the results of which were several books (“New Concepts in Technical Trading” (New Concepts in Technical Trading, 1978), “The Adam Theory of the Markets” (The Adam Theory of the Markets, 1987), and “The Delta Phenomenon” (The Delta Phenomenon, 1991)).
In the early 1980s, Wells founded the Delta Society International. The goal of the society was to study the financial markets. His own company, Trend Research Ltd, which is part of this society, develops trading software.
Wilder is the author of such well-known indicators as the Average True Range, the Relative Strength Index, the Directional Movement Indicator, and the Parabolic Stop and Reverse system.
Today, J. Welles Wilder Jr. is perhaps the most famous living market guru. The retired trader lives on the beautiful South Island of New Zealand. He reflected the experience of his years in his latest book, “The Wisdom of the Ages in Acquiring Wealth.”
He says that if he had known in his youth what is written in this book, he would be much richer than he is now. His indicators are considered foundational for many technical analysis programs and are included in almost all modern trading terminals.
J. Welles Wilder Jr. remains an active trader and consultant on technical trading systems and methods, the author of many articles, and appears on radio and television.
And finally, a couple of interesting quotes from this remarkable trader:
“If you cannot handle your emotions, leave trading.”
“Some traders are born undisciplined. Life will teach them. It will hurt.”
General description of the indicator

The RSI indicator is an oscillator, which means it fluctuates within a certain zone limited by a maximum and minimum value. The Relative Strength Index is plotted on a scale from 0 to 100. It works best when reaching extreme areas. The criterion for evaluation is two lines drawn at the 30 and 70 levels. It is believed that above 70 is the overbought zone, and below 30 is the oversold zone. Therefore, when the value of the Relative Strength Index reaches and rises above 70, there is a threat of a price decline; movement below 30 is perceived as a warning of an upcoming rise. Some analysts advise taking levels 30 and 70 as the boundaries only during sideways trends, and 20 and 80 during clearly pronounced bullish and bearish ones.
Of course, exceeding the 30 and 70 levels does not yet mean that you need to immediately start entering trades. After all, the market may remain in a state of overbought and oversold for a long time, while the oscillator, warning about a trend change in advance, does not explain exactly when this may happen.
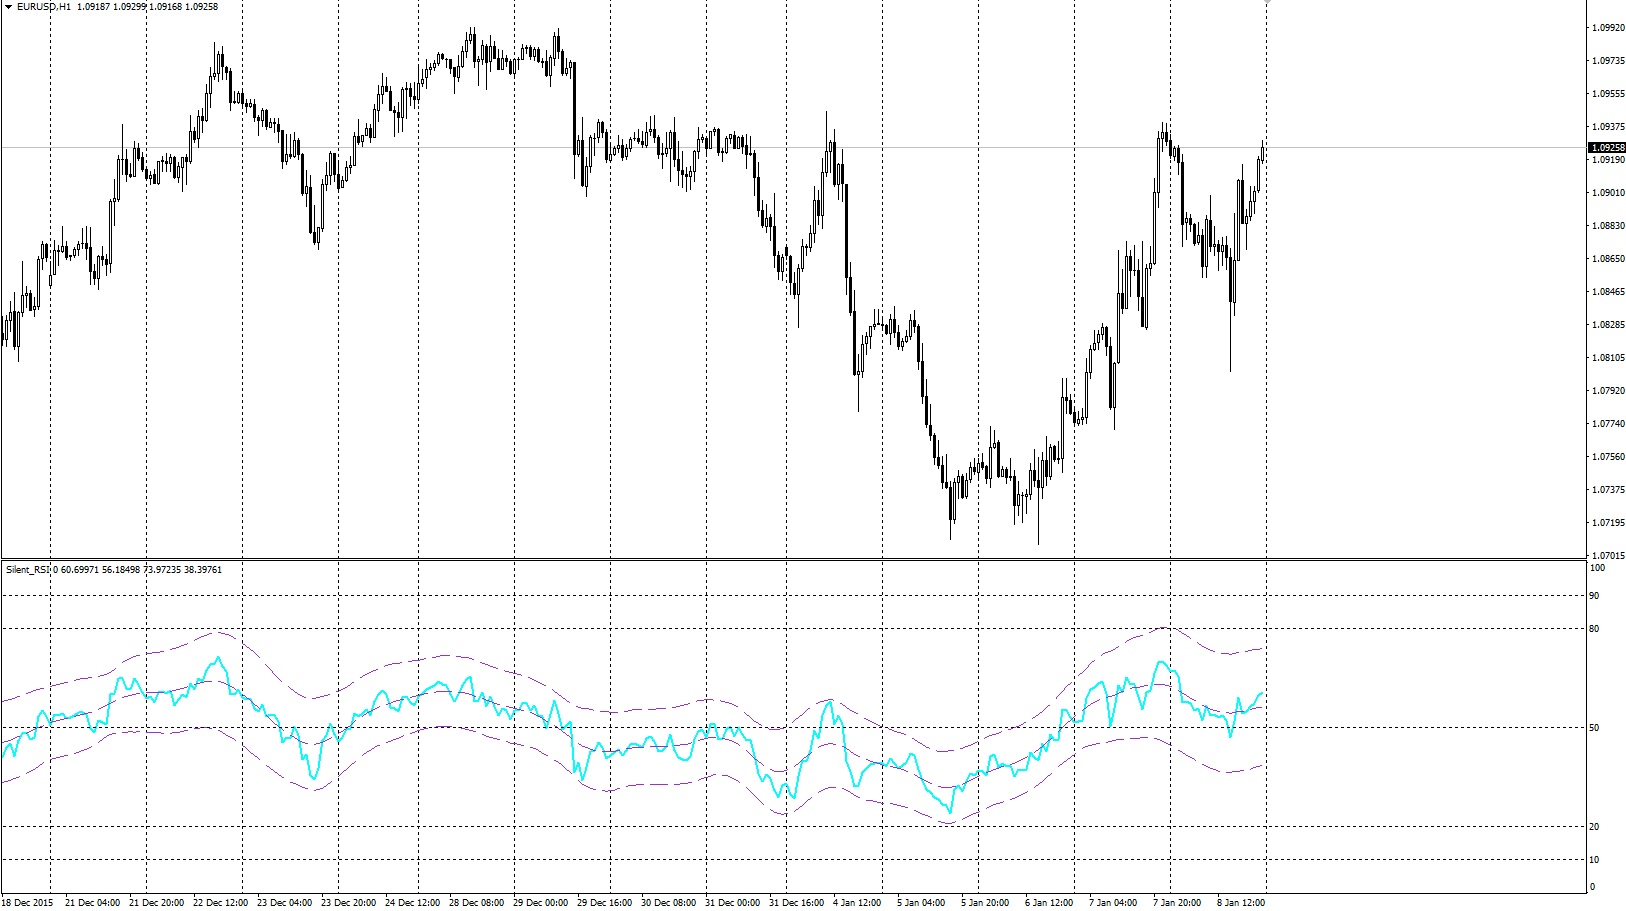
When introducing RSI, W. Wilder recommended using its 14-day version. Later, 9- and 25-day RSI also became widespread. Often 5, 7, 9, 14, 21, or 25 is taken as the period. Most programs offer one of these numbers as the default value.
A daily RSI will be based on price data covering the last 9 or 14 days. A weekly chart will include the previous 9 or 14 weeks. A minute chart, naturally, 9 and 14 minutes.
The number of single periods when calculating RSI can be varied, so I recommend experimenting with them to choose the most suitable option. The shorter the RSI calculation period, the more sensitive the indicator is to current price changes.
How do you choose the optimal period? The point is that for different timeframes of the same currency pair it will be different, so it will not be possible to use an indicator period that was once successfully selected on all time scales of the pair you need. As a rule, the smaller the timeframe, the longer the period should be, and vice versa. Choosing the optimal period for the RSI indicator is not difficult: you need to go through periods one by one and look at the overbought and oversold zones. As soon as the main clearly pronounced maxima and minima on the price chart begin to be reflected by the indicator in the overbought and oversold zones, while the others remain outside these zones at the same time, or at least most of them do, consider that the optimal period has been found.
As usual, the smaller the period we use, the more sensitive the curve will be and the more signals we will receive. The shorter the period selected, the closer to the extreme values of the scale the RSI index readings corresponding to an overbought or oversold market condition will be. The greater the number of days in the period used to calculate the index, the smoother its readings will be.
You can learn more about the nuances of setting up oscillators here.
Calculation formula

Since the computer does all the calculations for you, there is no need to memorize the formula. Nevertheless, knowing it will help you better understand how the indicator works, and this is the key to its correct use and interpretation of the signals it provides.
Wilder states that there are two main problems in constructing a momentum curve for price movement based on price differences. The first is caused by the erratic nature of the momentum curve because of frequent sharp swings between price values over the period under consideration. A sharp rise or fall in prices that occurred ten days ago, in the case of a ten-day momentum indicator, may cause a steep turn in the curve today even if current prices remain relatively calm. Therefore, to minimize such distortions, the momentum curve must be smoothed. The second problem is related to the need for constant oscillator band boundaries for comparative analysis. The RSI formula solves both of these problems: it not only smooths the curve, but also provides a constant vertical scale from 0 to 100.
It should be noted that Wilder uses the term "relative strength" somewhat incorrectly, and it often misleads those who are familiar with this concept from stock market analysis. Relative strength is traditionally understood as the ratio curve of two different objects. As for Wilder's Relative Strength Index, it does not measure the relative strength of different objects, and therefore the meaning the author gives this term is not entirely precise. Nevertheless, the RSI index solves the problem of erratic oscillator curve movement and makes it possible to establish constant upper and lower fluctuation boundaries.
Positive (U) and negative (D) price changes are used to calculate RSI. A day is called ascending if today's closing price is higher than yesterday's.

A day is called descending if today's closing price is lower than yesterday's.

If today's and yesterday's closing prices are equal, then U and D are 0. After that, the U and D values are smoothed with an exponential moving average with period N, and then relative strength (RS) is calculated first:
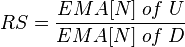
RSI itself is then calculated on the basis of RS:
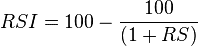
It is easy to verify that:

Many sources mention not an exponential moving average (EMA), but a simple one (SMA).
When calculating RS, it is necessary to take into account the situation in which the denominator turns out to be zero. This is possible when using a simple moving average (SMA), when throughout the entire averaging period the price moved only upward and, accordingly, all D values are 0. In this case, RSI must be taken as 100.
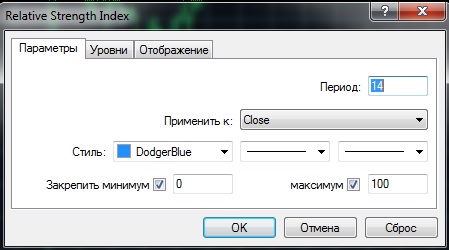
Of course, any price can be used to calculate the indicator. For the MT4 terminal, this is the closing price, opening price, highs or lows, average, typical, and weighted price. There is also an option to build RSI on the data of another indicator.
Overbought and oversold levels

RSI values are plotted within vertical coordinates from 0 to 100. When the reading is above 70 or below 30, the index indicates an overbought or oversold condition respectively. Two horizontal lines corresponding to the values 70 and 30 are drawn on the oscillator chart. These lines are often used to obtain buy and sell signals. As already mentioned, an oscillator value below 30 indicates that the market is oversold.
Suppose a trader believes that the fall in prices is about to reach its limit and is waiting for an opportunity to open a long position. He sees that the oscillator curve drops below 30, entering the oversold area, and hopes that some divergence will appear in the oscillator dynamics in this area or that a double bottom will form. When the curve crosses the boundary again, this time rising, many traders regard this as confirmation that the oscillator trend has turned upward. Conversely, a repeated crossing of the 70 line as the curve falls from the overbought area is often regarded as a signal to take a short position. Of course, exceeding the 30 and 70 levels does not yet mean that you need to start placing trades immediately. After all, the market can remain overbought or oversold for a long time, and the oscillator, while warning of a trend change in advance, does not explain exactly when this may happen. You should always carefully watch the crossing of the 70 and 30 lines. During a strong upward trend, there is nothing unusual in the fact that
the RSI oscillator rises above 70 and remains there for quite a long time. This is usually a signal of a strong upward trend. In such cases, it is probably best to ignore the oscillator for a while as long as it remains above 70. A crossing below 70, especially if it occurs after a long time, often gives a good signal of a trend change.
Many traders consider a crossing below the 70 line a sell signal, and a crossing above the 30 line a buy signal.
It is not necessary to use 70 and 30 as the levels. Experiment with the levels. For a bull market, 40 and 80 are more suitable, and for a bear market, 20 and 60. To reduce the total number of signals and increase their quality, you can use levels 20 and 80. I recommend using the 5 percent rule: draw the line so that RSI remains beyond it 5 percent of the time over the last three months, for example, if you trade on daily charts. Adjust the reference line as needed.
In a very calm market with low volatility, you may notice that the fluctuations of the RSI line remain between 70 and 30. You may want to try increasing the amplitude of RSI fluctuations by shortening the time period. Try choosing a lower period, for example 7 or 5. The opposite case includes a situation where the RSI line is too volatile. Frequent moves above 70 and below 30 become less significant, and it is difficult to distinguish between real signals and market noise. In that case, it is necessary to reduce the amplitude of the RSI line by increasing the period, for example to 21. This will eliminate many insignificant moves and help determine those that have value.
A buy signal occurs when RSI exits the oversold zone, and a sell signal occurs when it exits the overbought zone. Such signals are taken only in the direction of the main trend. Signals against the trend are ignored! It is better to combine these signals with signals from other indicators or with technical analysis. An exit signal occurs when the overbought or oversold zones are reached. For example, when RSI reaches the overbought zone, we close buy positions or move our stops closer.
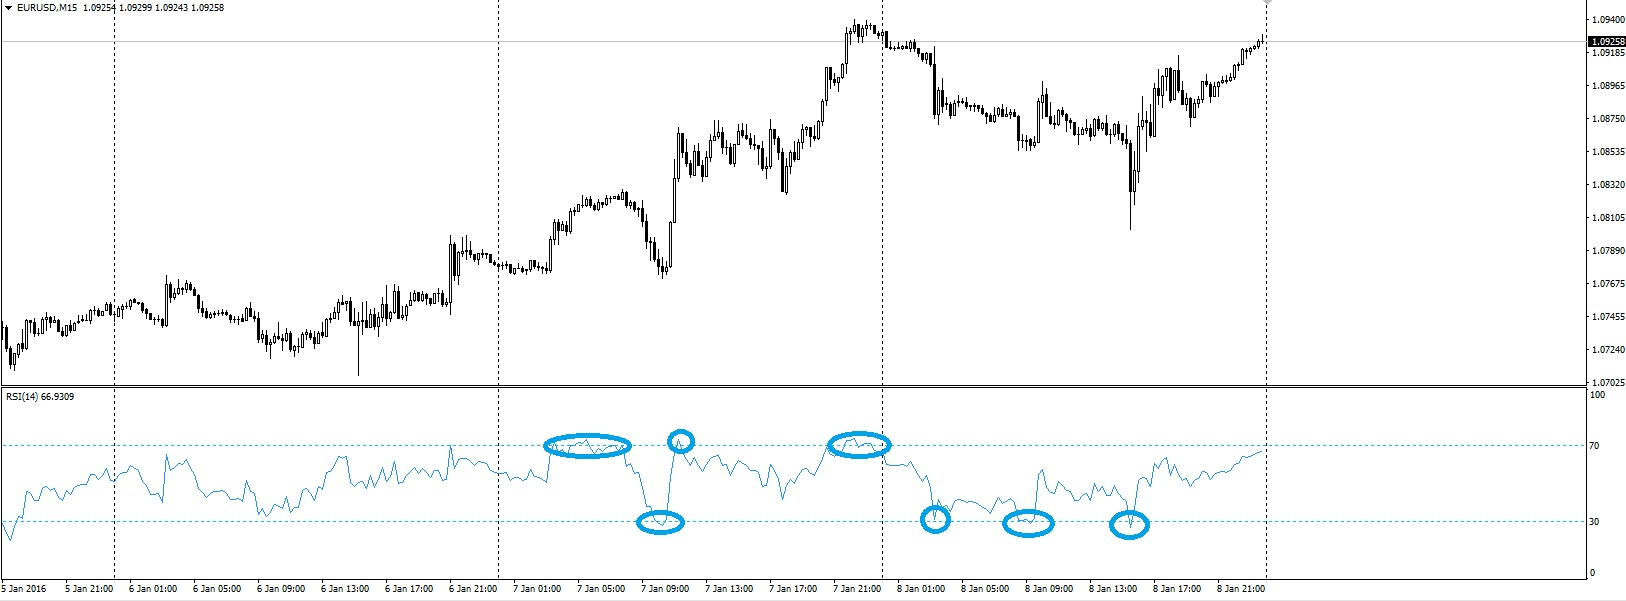
Most often, scalpers use the RSI indicator in their work during periods when there is a narrow flat on the market. Pay attention to the illustration with examples of entry points based on the RSI indicator: the euro/dollar rate entered the overbought zone - 70, crossed it from top to bottom, and we enter a sell, and as soon as the price entered the oversold zone - 30, we enter buys. This tactic is very effective in a flat market: while position traders wait for clarity in the Forex market, scalpers using the RSI indicator simply stuff their pockets with money through such precise short trades.
Levels 40/80 and 20/60
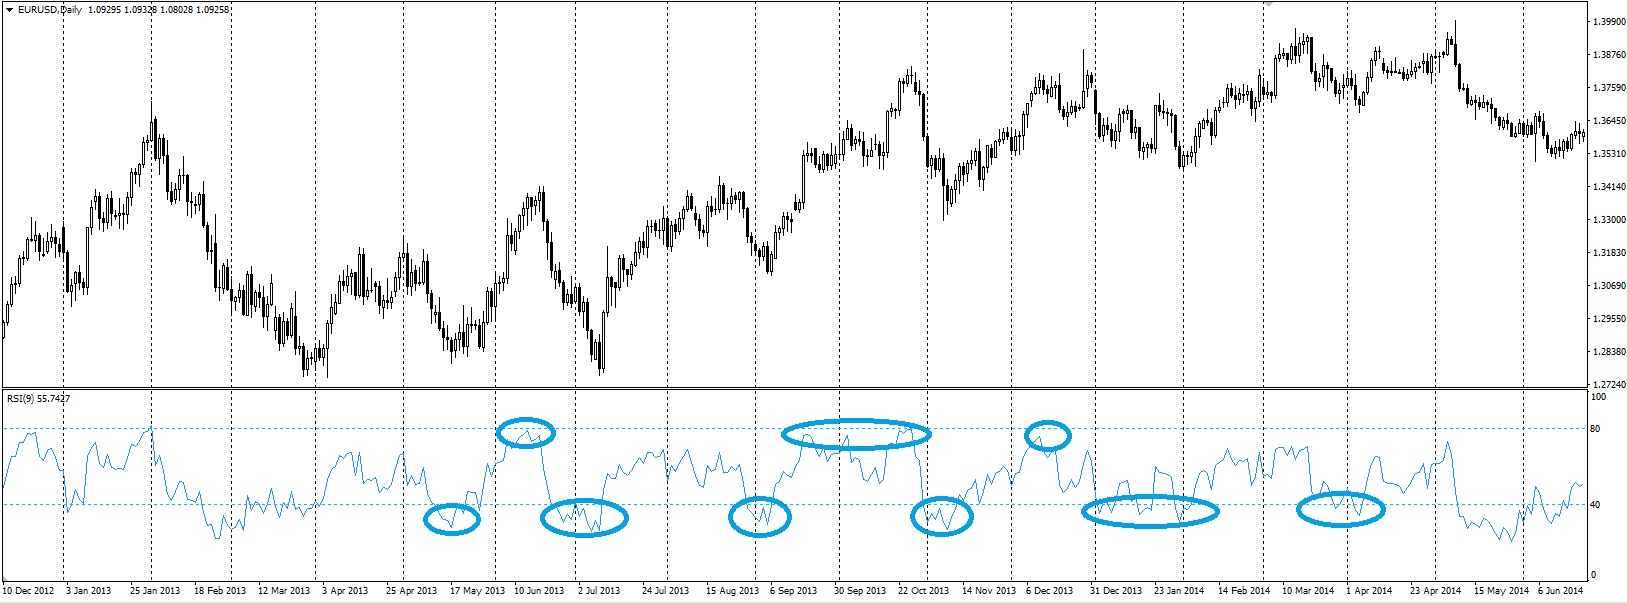
As I already said above, in an uptrend it is advisable to use levels 40 and 80. In this case, we make only buys when the indicator level drops to 40.
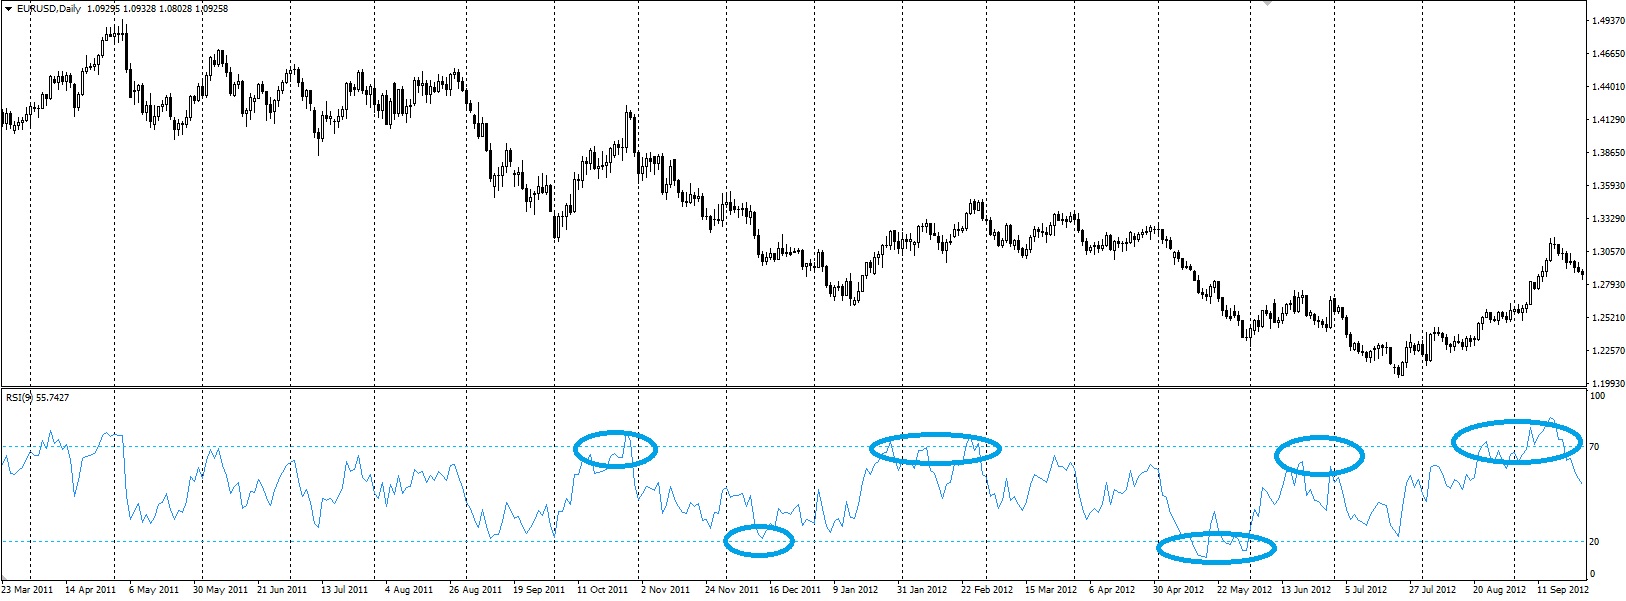
In a downtrend it is advisable to use levels 20 and 60. In this case, we consider only sell trades when the indicator level rises to 60.
Identifying a Trend Change by the 20/60 and 40/80 Levels
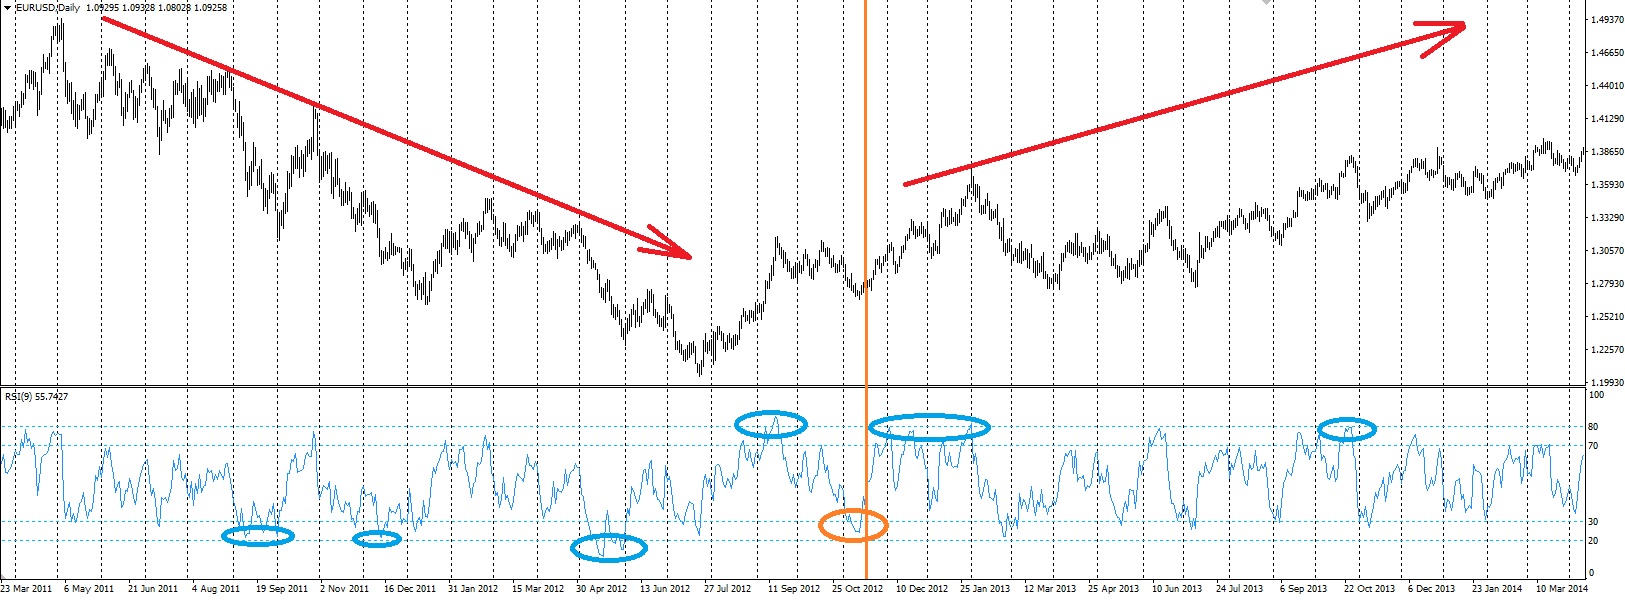
When using levels 20/60 and 40/80, everything turns out quite smoothly, but how can you understand when to use which levels? This is quite easy. So, in a downtrend the RSI indicator constantly drops to level 20 and never reaches level 80. In an uptrend it hangs around 80 and does not want to go to 20. Therefore, when the situation shown in the picture above occurs, we can talk about a trend change from a downtrend to an uptrend in our case. In a downtrend, the indicator dropped to level 20 several times while never reaching level 80. But then one day RSI did break above level 80 - from that moment you need to be careful, a trend change is expected. The next decline of the indicator, which failed to reach level 20, confirms the trend change.
Level 50
Although the main focus of the RSI oscillator is on the oversold and overbought lines, the 50 line is also important. You may notice that in strong trends price often finds resistance at this level.
If you are looking for confirmation of an uptrend, make sure that RSI is above 50. If, on the other hand, you think the market is in a downtrend, make sure that RSI is below 50. Suppose you have found an uptrend but doubt its strength. To avoid false signals, wait for the moment when RSI crosses above level 50, thereby confirming the assumption. Now it can be said quite confidently that the trend has formed; RSI crossing above level 50 is good confirmation. You may notice, for example, that during a correction in an uptrend the RSI line will often find support at the 50 line before returning again. During a downtrend, RSI line bounces will often stop around the 50 line.
Use the 50 signal line to confirm the trend. If RSI is above the 50 line, the trend is upward and it is recommended to enter only buys; if it is below, we consider only sells.
Failure Swing
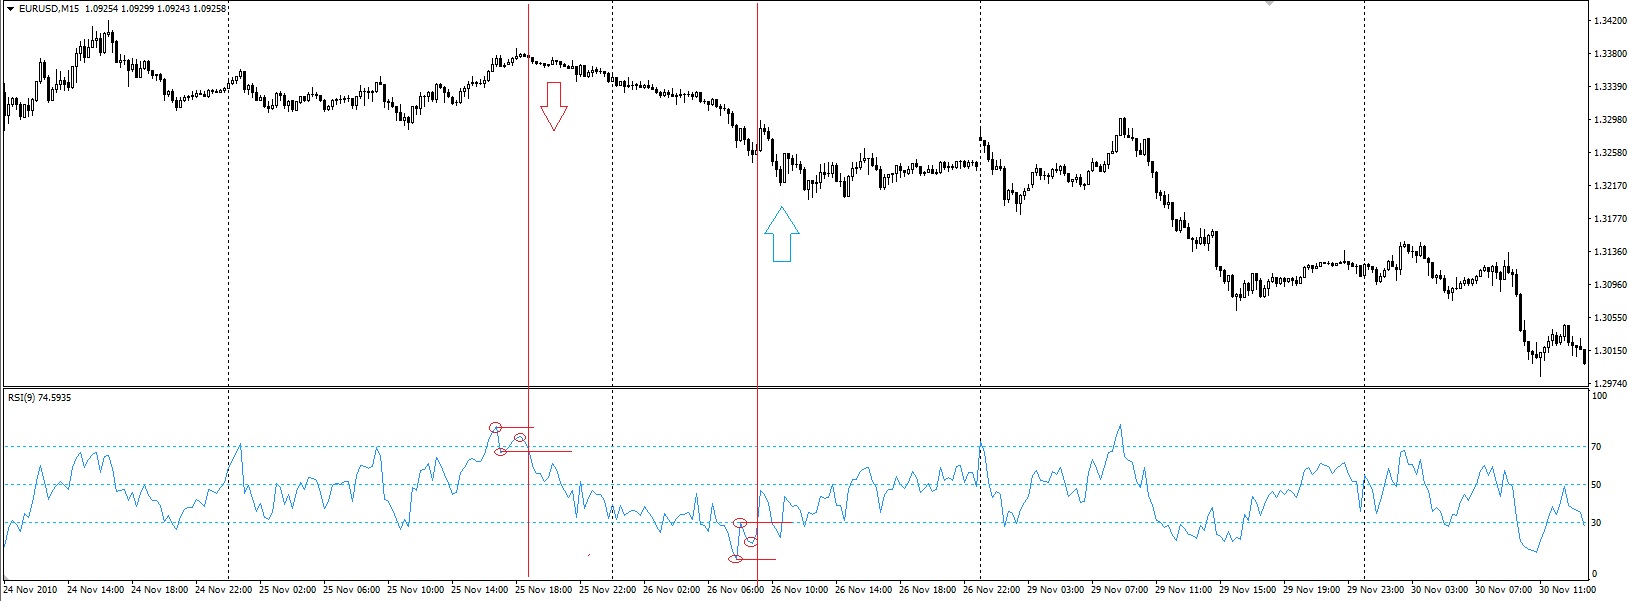
When the index readings are in the oversold or overbought zones, a special pattern may form on the oscillator chart, which Wilder calls a "failure swing". A "failure swing" in the top position consists in the fact that during an upward trend the next peak of the indicator curve fails to reach the level of the previous peak, after which the curve falls below the level of the previous decline. A "failure swing" in the bottom position occurs when a falling indicator (below 30) nevertheless does not fall below the level of the previous decline and then, rising, exceeds the previous peak.
Nevertheless, despite the reliability of the pattern, it should not be used blindly and without confirmation from other tools. At a minimum, trades need to be filtered by the direction of the trend.
Levels and Trend Lines
Classic chart analysis works quite well on the RSI indicator chart.
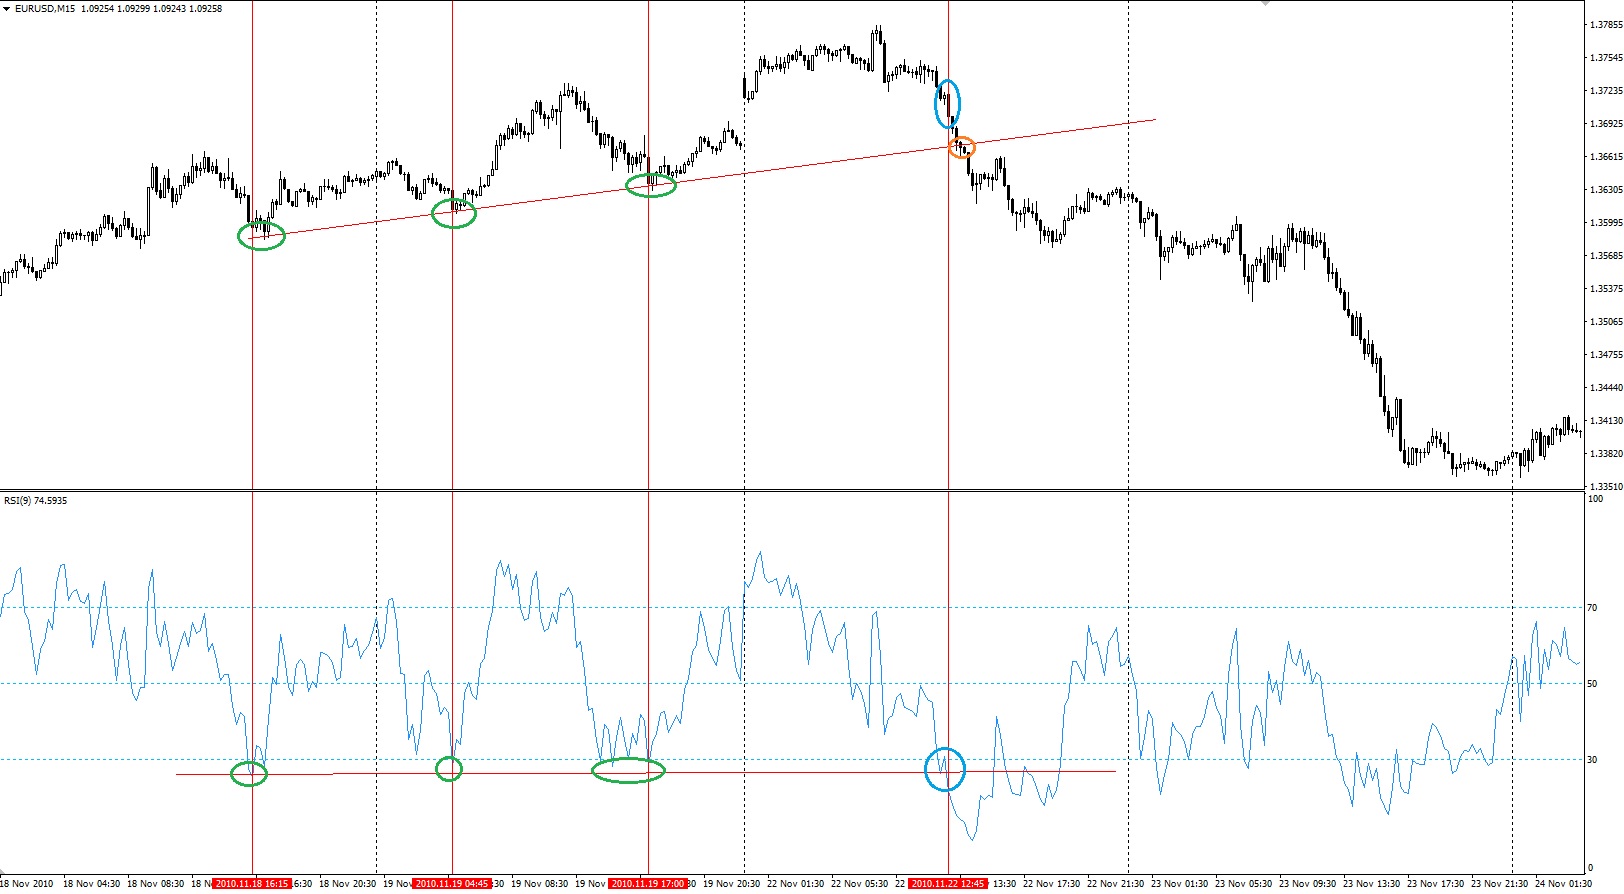
In the illustration above, a regular horizontal level is built on the RSI indicator chart. At the same time, the support points of the indicator coincide with the support points of the trend line on the price chart. Notice how RSI hinted to us about the breakout of the trend line 4 bars before this event. An example of trend lines:
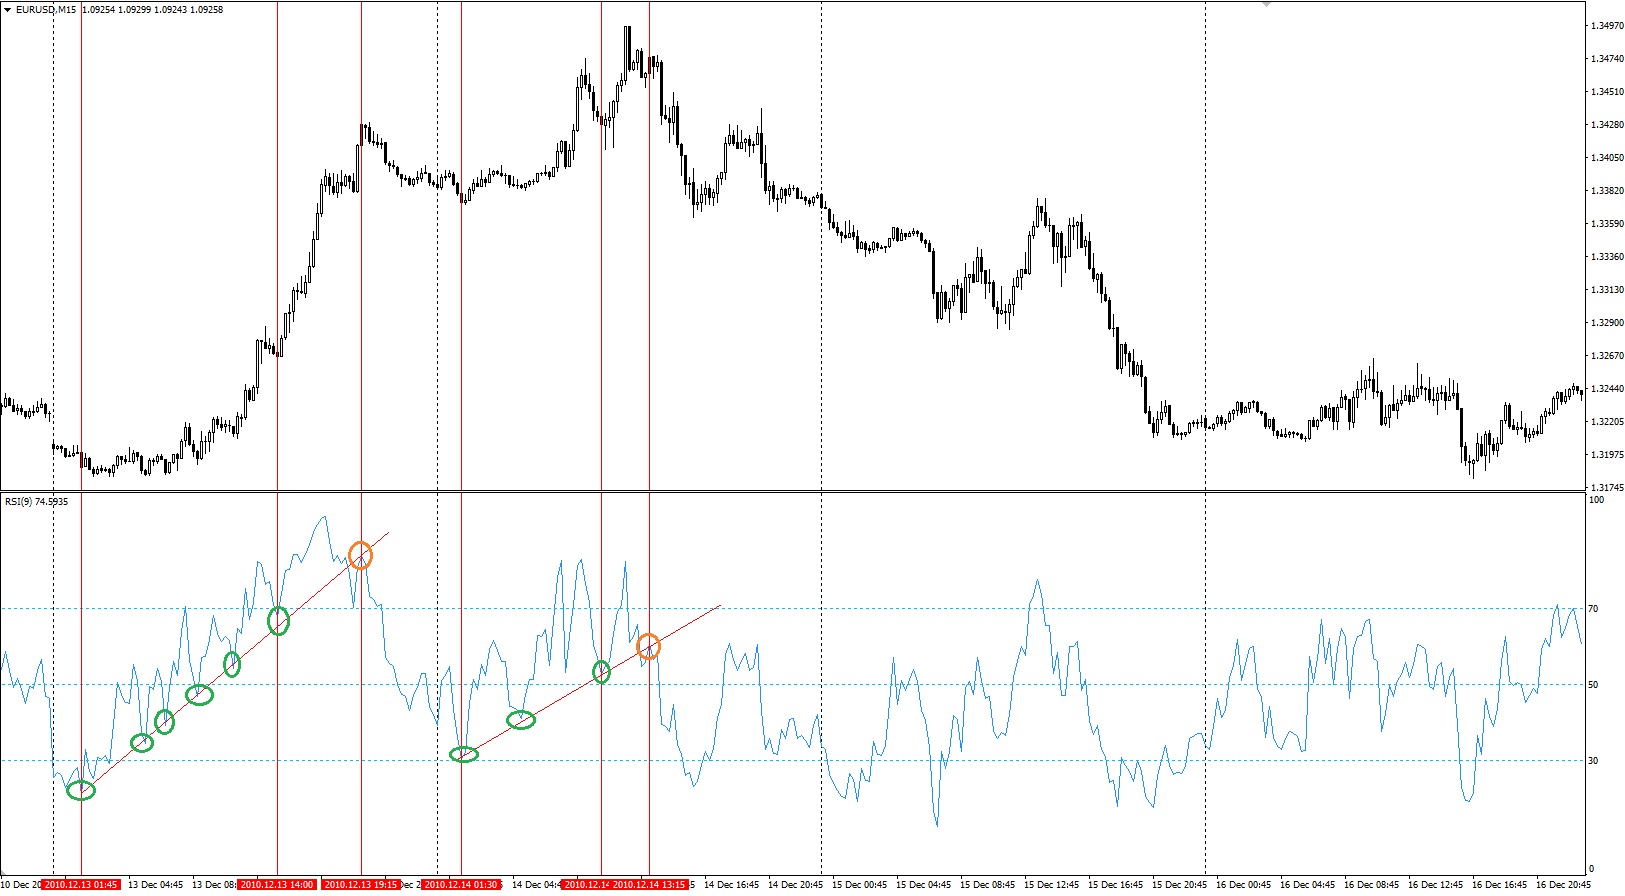
Absolutely classic indicator behavior at trend line breakouts: many touches, then a breakout, and almost always a mandatory retest of the broken trend line gives an excellent opportunity to enter a trade at a better price. The best signals are taken in overbought and oversold zones. At the same time, you need to act exactly the same way as when analyzing price charts: the more touches, the higher the timeframe, and the longer the pattern lasts in time, the more reliable the signal.
Chart Patterns
In addition to levels and trend lines, chart patterns of technical analysis are also often analyzed on the RSI chart, such as head and shoulders, triangles, wedges, rectangles, and others. With their help, one can predict the dynamics of the Index's movement, as well as the exact time when the price trend should change.
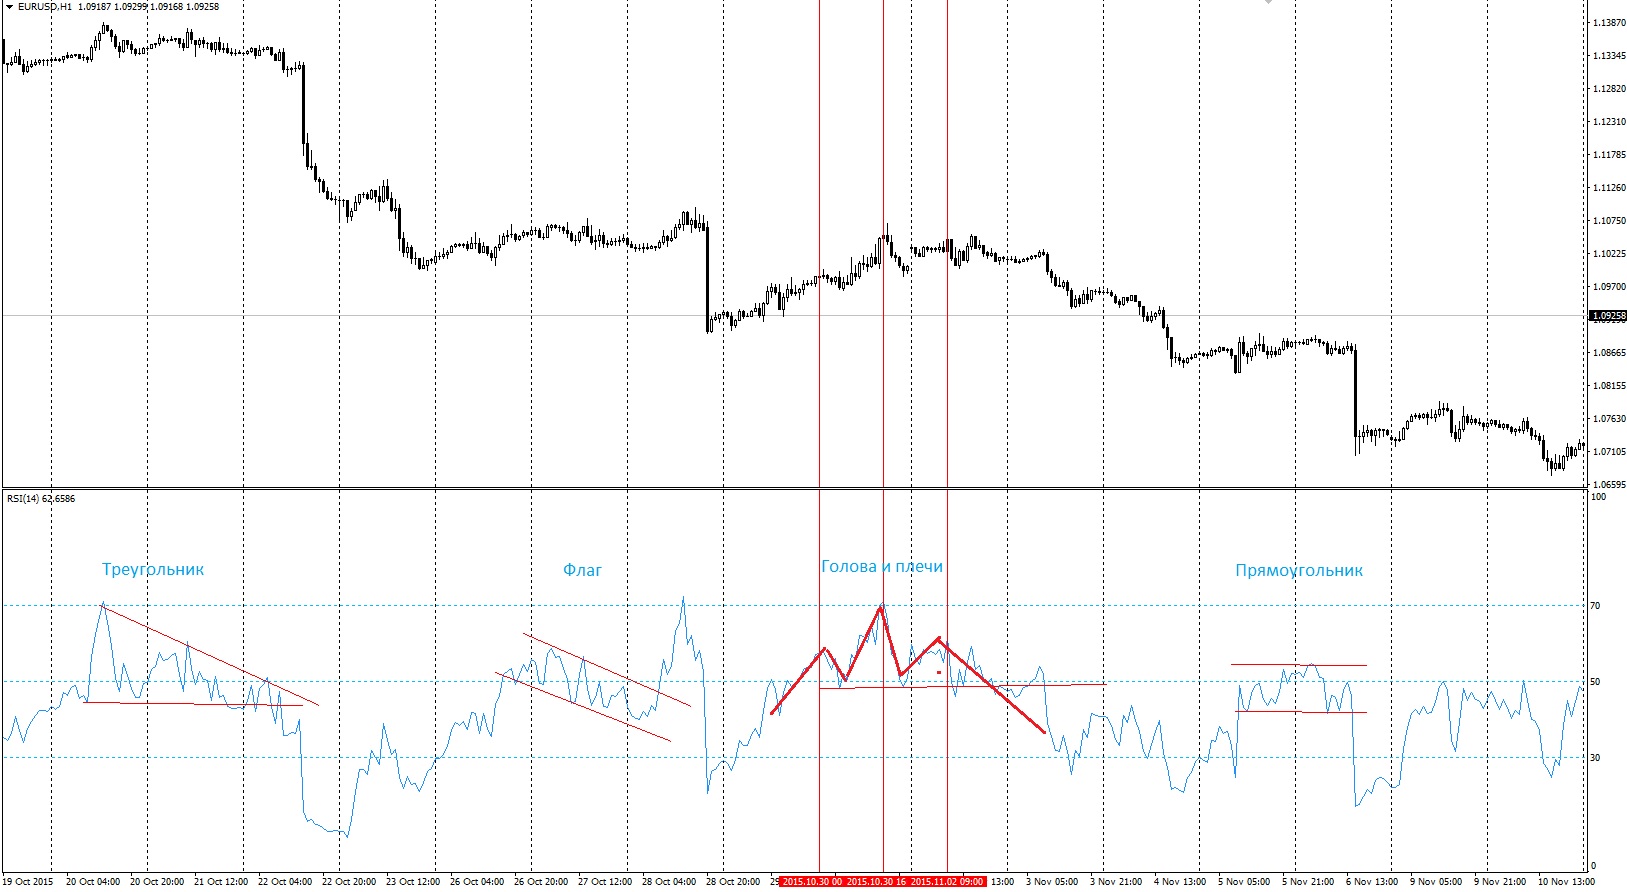
RSI often forms chart patterns that may not appear at all on the price chart. Nevertheless, such patterns can be fairly good entry signals, often ahead of most other methods.
Divergences
Another tool for forecasting prices with the Relative Strength Index is the study of a discrepancy that arises between the direction of the Index chart and the price trend. By divergence, two cases are meant:
1. RSI rises, while price falls or stays at the same level.
2. RSI falls, while price rises or does not move.
Divergence in such a case is a strong reversal indicator. And although it does not arise at every turning point, it is often encountered at especially serious turning moments.
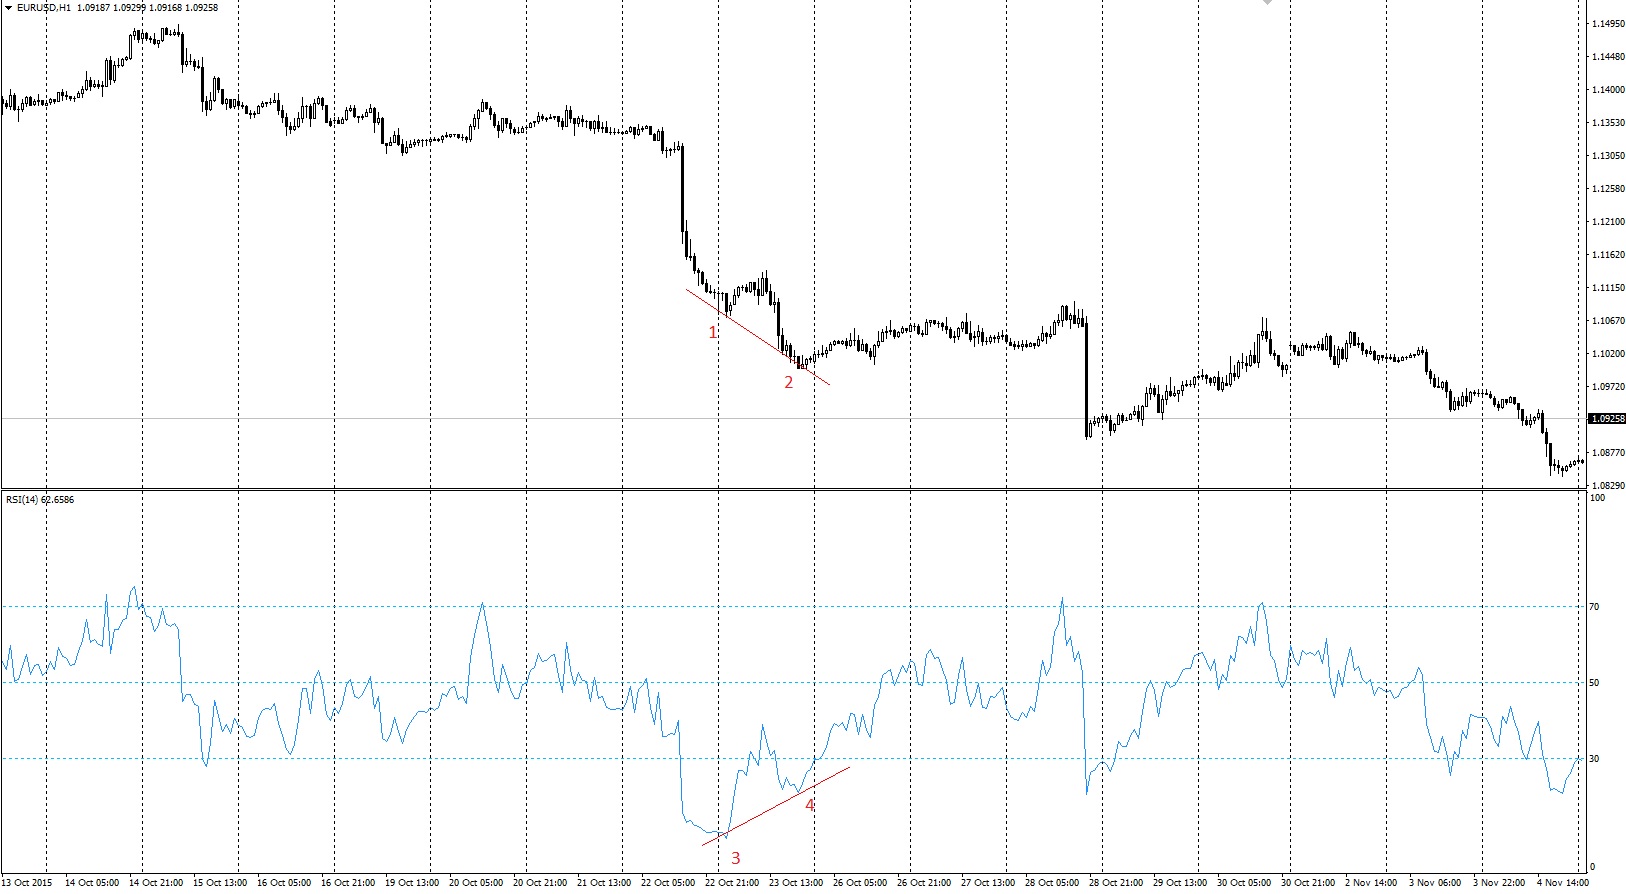
Divergence between the RSI curve and the price movement curve when the index values are above 70 or below 30 is a serious signal that is dangerous to ignore. Wilder himself calls divergence "the most significant indication for the relative strength index". In such a case, the index curve shows either a double bottom or two rising bottoms. In this example, the oscillator signal very accurately indicated the beginning of a price correction and the need to lock in profit in a bear market.
The RSI indicator shows discrepancies quite well enough, divergences, between price readings on the chart and the values of the oscillator itself.
As already stated above, divergences are formed when price reaches a new high or low, but it is not confirmed by a new high or low on the RSI chart. At the same time, a price correction usually occurs in the direction of the RSI movement. More detailed information about divergences and their types can be found on the blog pages.
RSI and Moving Averages
Most traders use the RSI indicator only in the traditional way of analyzing overbought and oversold levels. The chart below shows how the simple addition of a Moving Average to the indicator creates a smoothing effect and shows the direction of the RSI indicator trend.
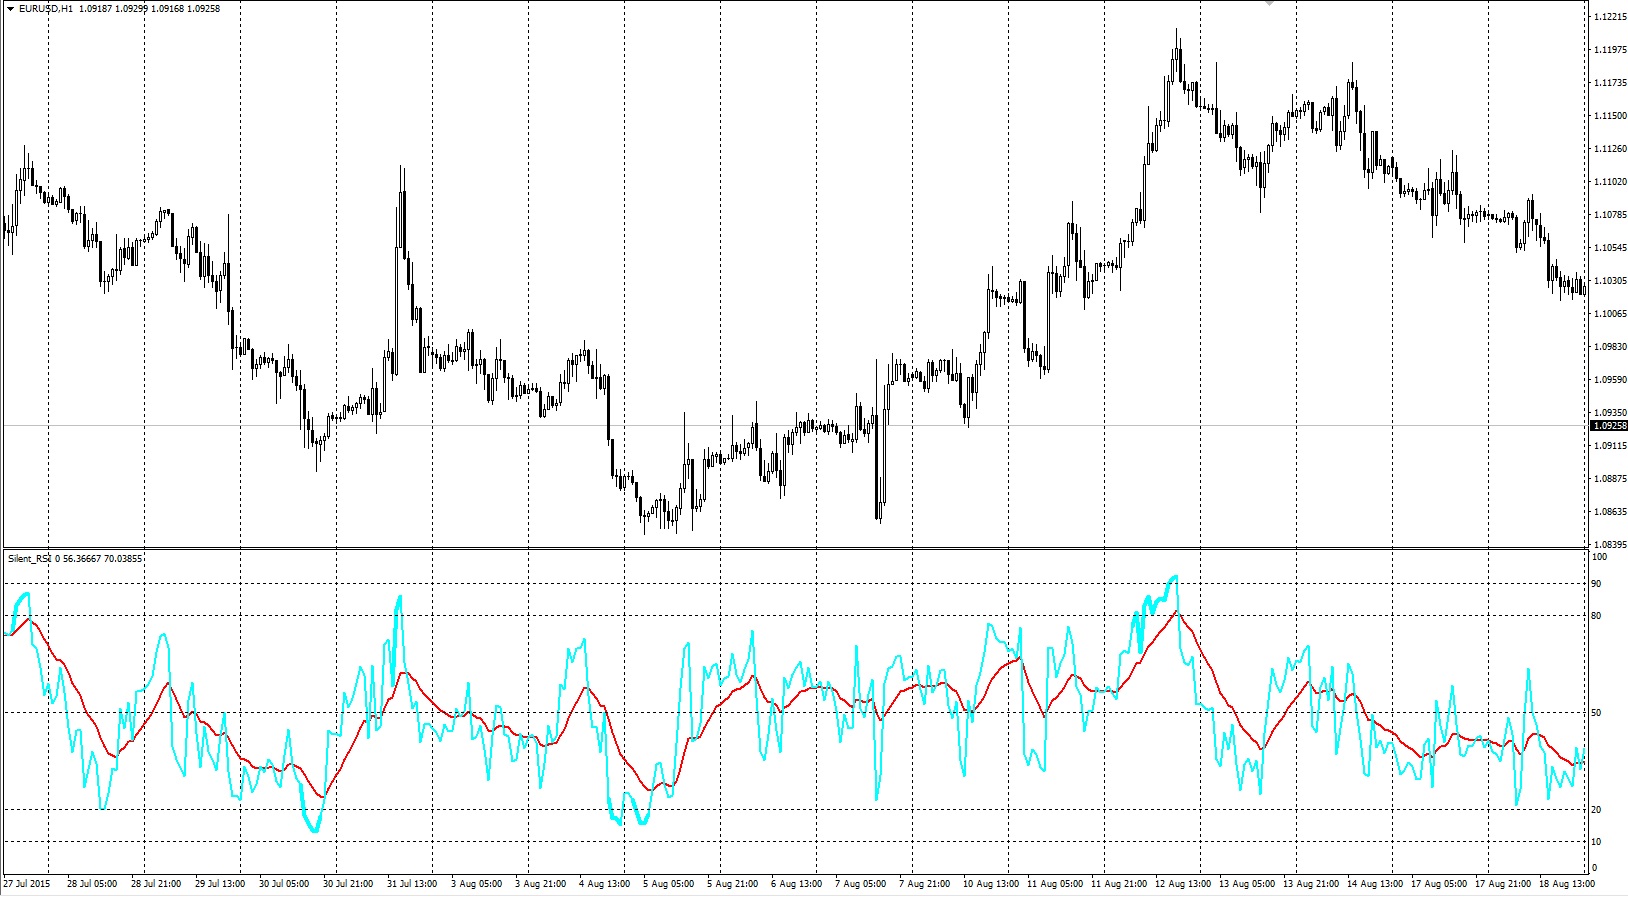
The moving average, in red, shows the direction of the RSI indicator's movement, as well as the position of the index itself relative to the moving average, above or below, which also speaks to the current tendency. In addition, the moving average can act as a resistance level for the indicator.
If applying one average to the relative strength index gives such good results, then two averages should be the holy grail altogether.
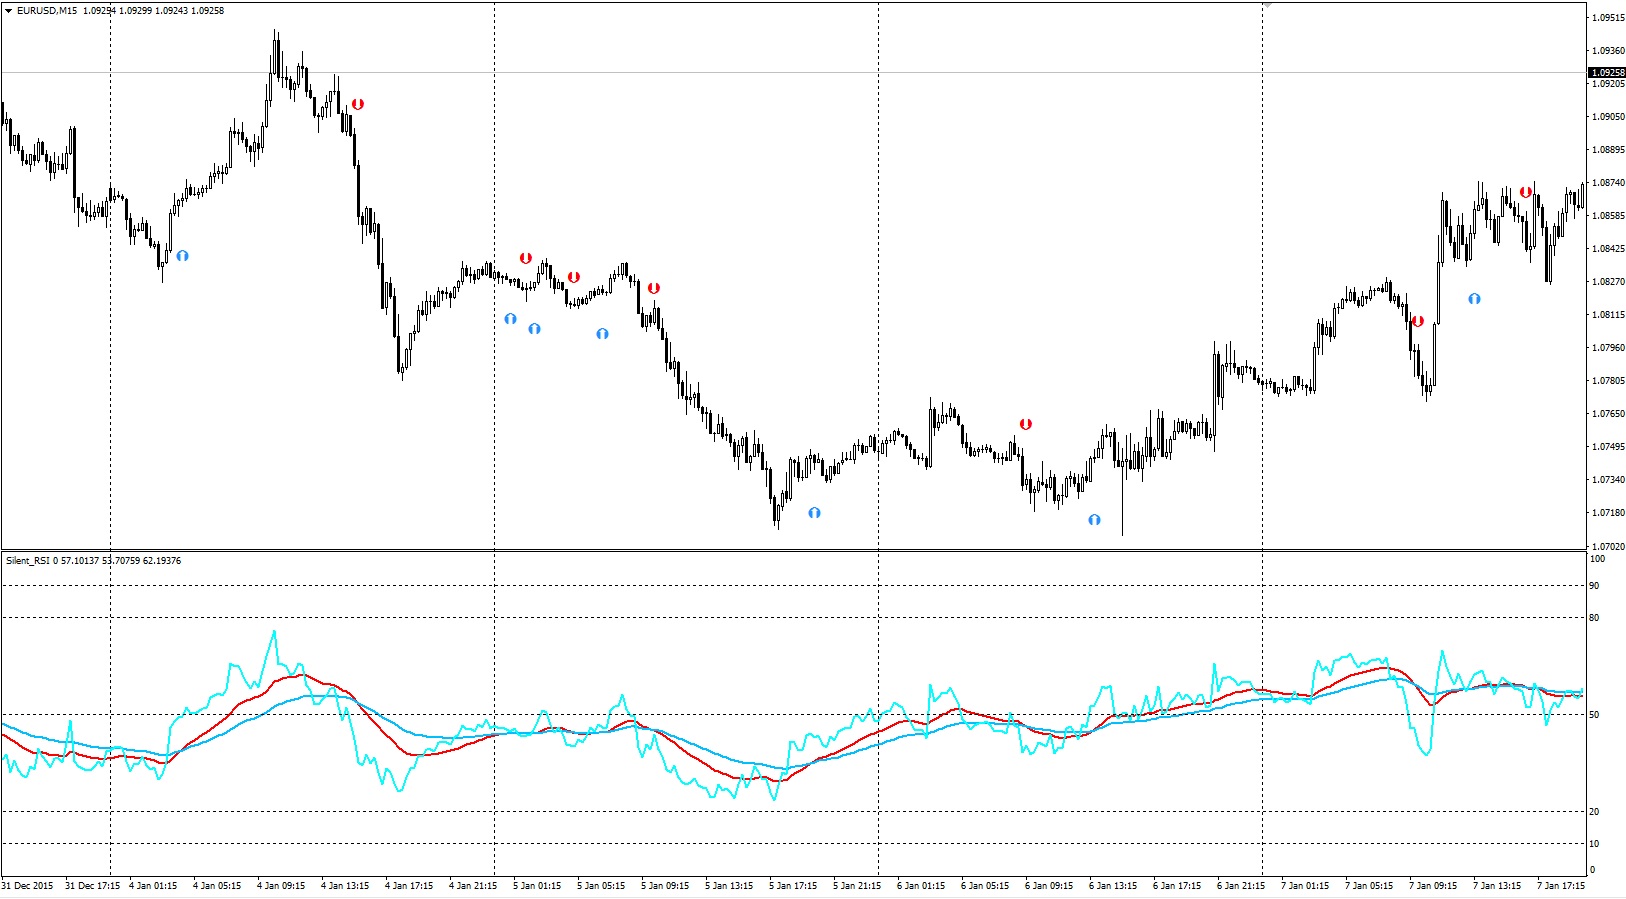
That is, of course, not quite so, but even so, when taking the trend direction into account, one can get good signals at the crossover of two moving averages built from RSI data.
How to Determine a Trend Using the RSI Indicator
When John D. Rockefeller was asked how the price of Standard Oil stock would behave, he supposedly replied: "I think it will fluctuate". Price fluctuations are, of course, the essence of the market, where buyer and seller collide. Prices can fluctuate within a range that has lower and upper boundaries, often called support and resistance levels. In other cases, prices can fluctuate within an ascending or descending price channel. When prices break out of a range and move toward their final goal, up or down, one can speak of a trend.
Determining the presence or absence of a trend is one of the most important tasks of technical analysis. The classic indicator used in a trending market is the moving average, since price, moving in a trend, tends to remain on one or the other side of a properly selected moving average through most of the trend. The main drawback of the moving average is lag. It cannot reflect current reality, since it is based on data from past periods.
RSI is based on price change and is therefore an indicator of price speed. With this in mind, in a case where most price changes occur to the upside, one can expect RSI to have a value of 50 or higher, indicating that a moving average with the same period as RSI has a positive slope. The opposite is true for the case when most price changes occur to the downside and RSI is below 50.
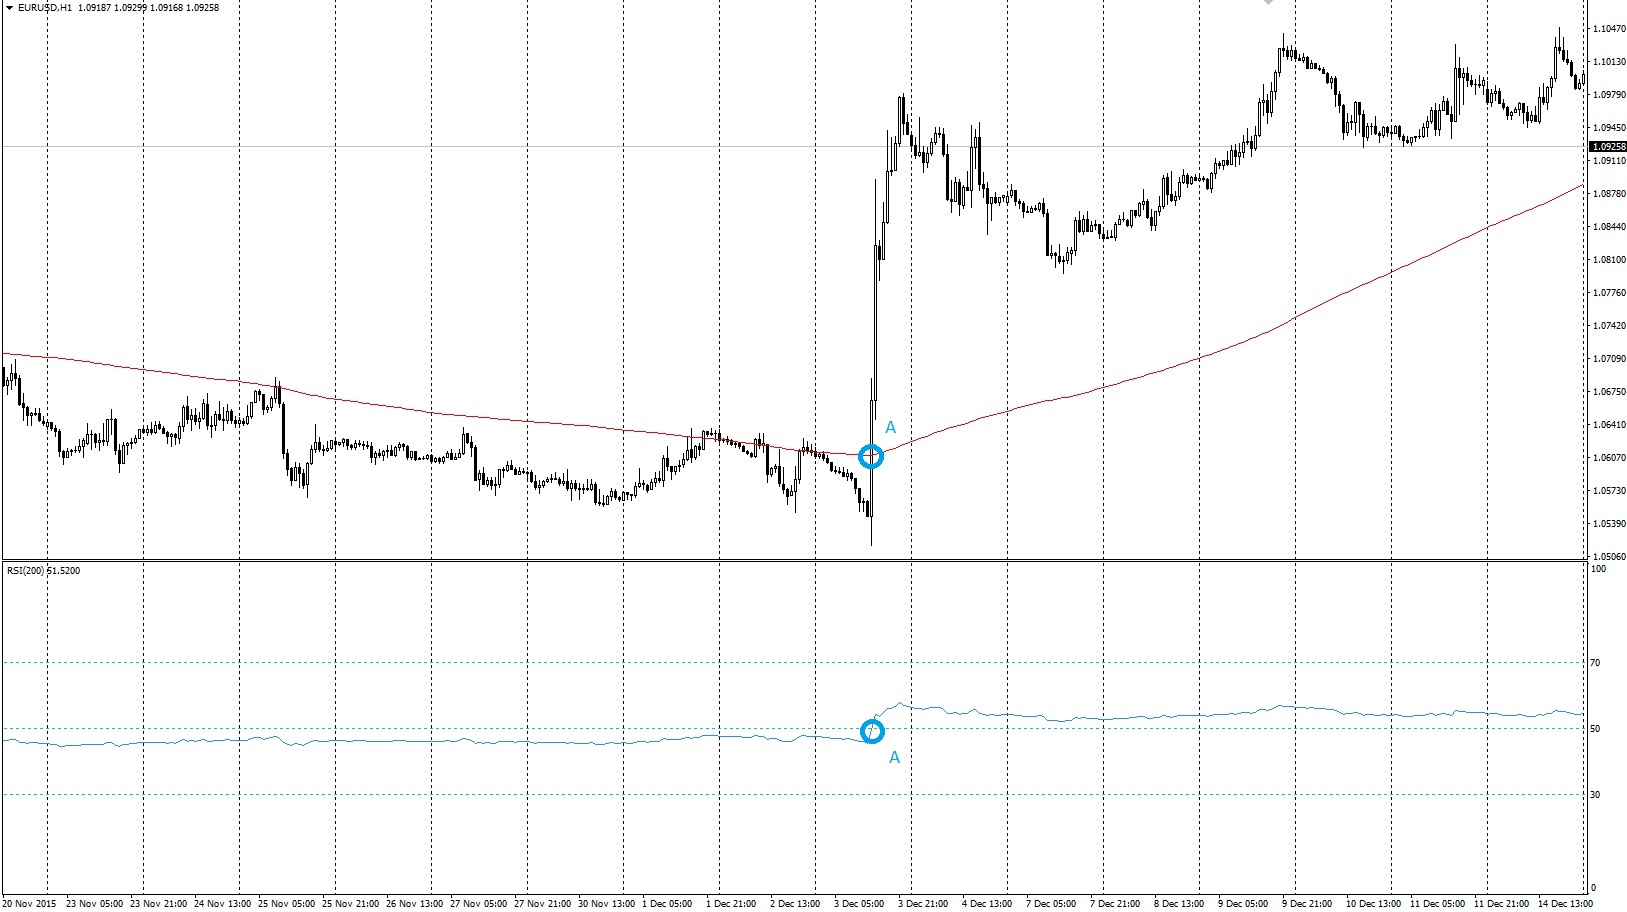
A simple moving average, SMA, with a period of 200 is shown by the red line, and RSI (200) by the blue line. Level 50 is marked in light blue. At point A, the slope changes from downward to upward, while the SMA 200 turns upward and the RSI 200 rises decisively above 50. Note that it is hard to determine a change in the moving average's slope by eye, but it is easy to notice the RSI falling. We have seen that RSI can determine a change in the slope of the moving average when it moves into the zone above or below 50. But this is not the same as determining a trend, since the slope of the price moving average during the main trend may briefly flatten or even reverse.
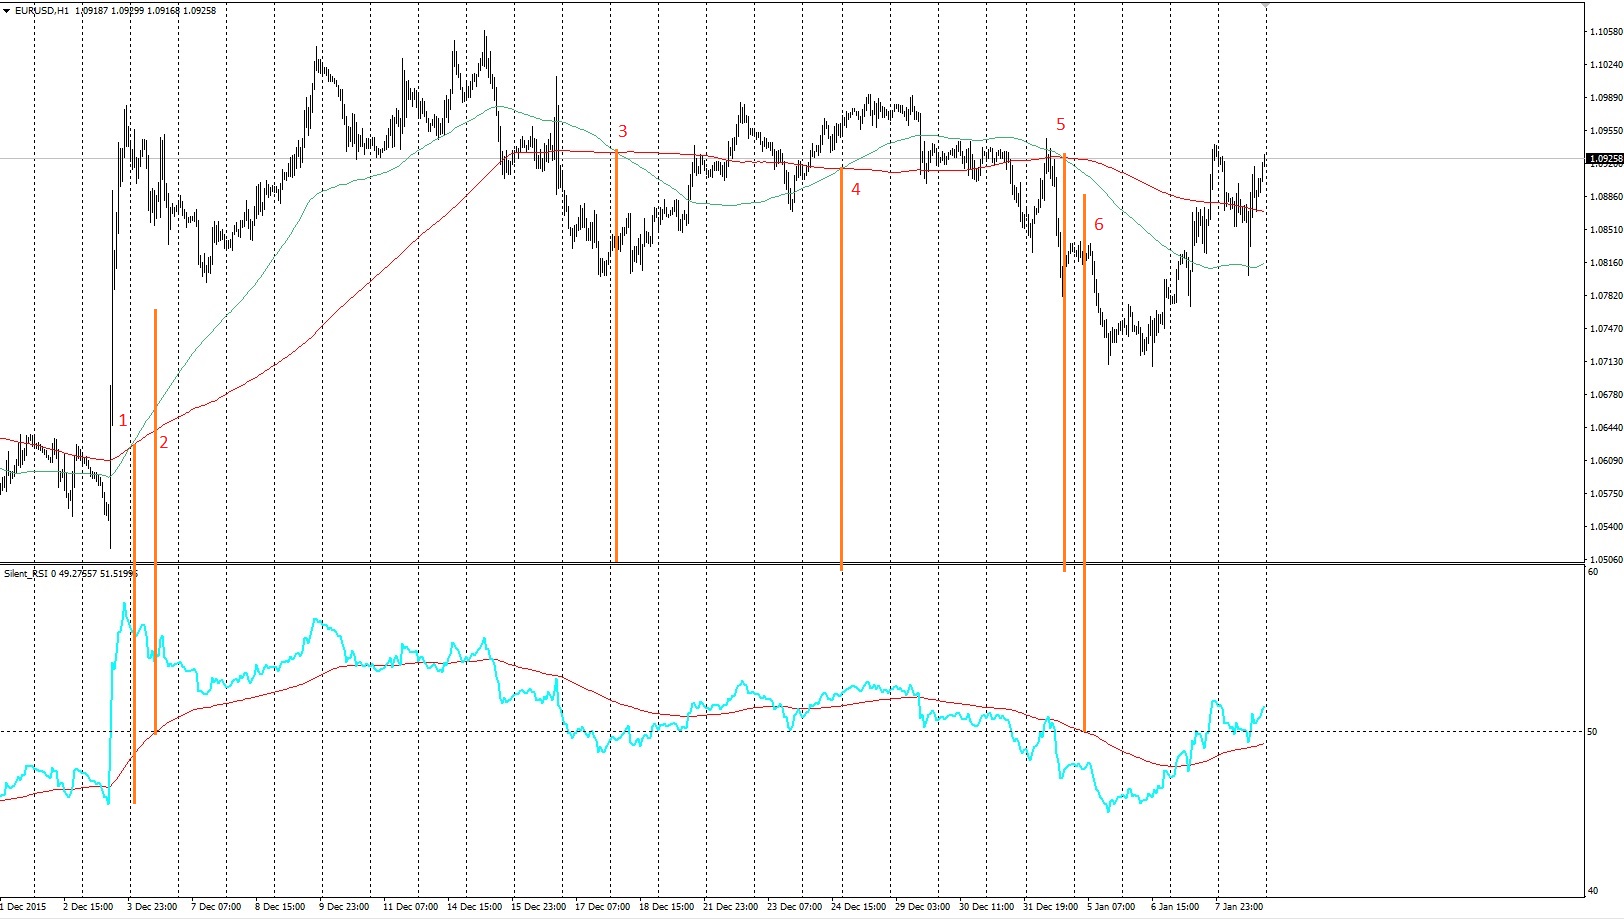
One way to solve the problem is to use a simple moving average of the RSI index itself as an indicator. Moving averages with periods 100 and 200 are shown in green and red to determine the trend. The 100-day average of RSI 200 is shown in red, with a horizontal line at the 50 level. As mentioned earlier, a trend change occurs when the RSI line crosses the 50 level. The same applies to the RSI moving average. RSI signals occurred a little later than the moving average crossings (points 2 and 6 versus 1 and 5). But note that the 100/200 SMA of price had whipsaw movements at points 3 and 4. In addition, there were several whipsaw price movements crossing the SMA 200. The 100-day moving average of RSI 200, on the contrary, had no such movements at all during this period.
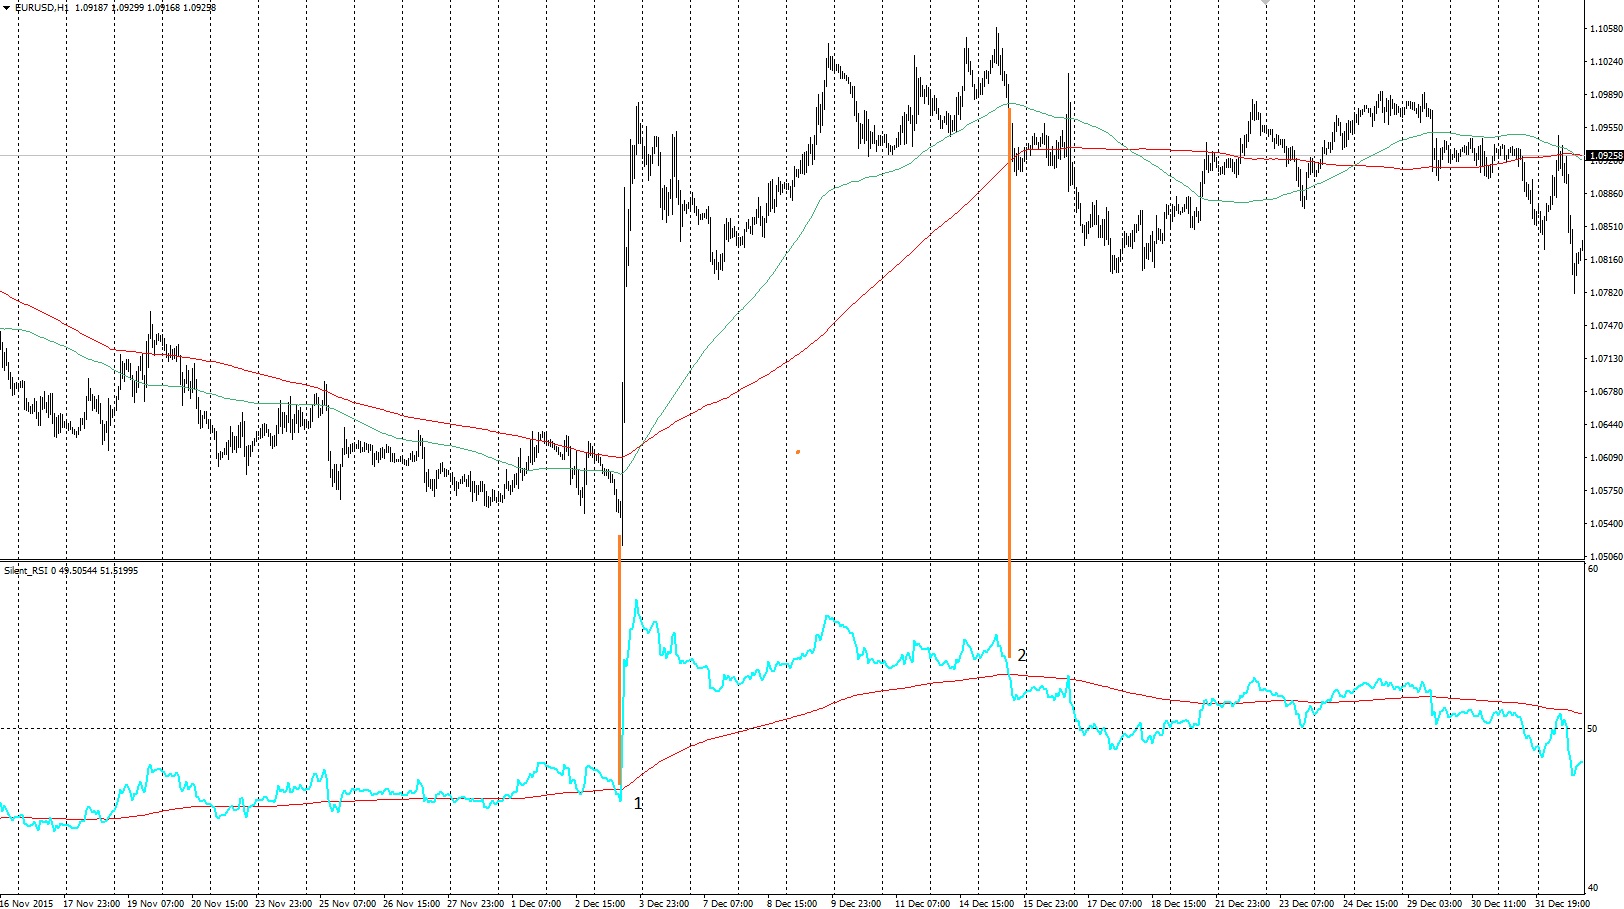
A more sensitive method is to compare RSI with its own moving average. The figure above shows RSI 200 plotted together with its own SMA 200. RSI 200 crosses its SMA 200 from below upward at point 1 and from above downward at point 2. Note that the signal at point 1 appeared earlier than the moving average crossover. This method shows us most of the upward phase of the market.
Using channel indicators
The use of channel indicators somewhat simplifies the interpretation of RSI signals, because in this case the overbought and oversold levels become dynamic and move together with the relative strength index chart. In addition, the direction of the channel itself indicates the trend direction to the trader. For example, Bollinger Bands can be built from RSI values.
Just as the RSI chart itself generally repeats the price chart, often leading price reversals, Bollinger Bands built from RSI values can in some cases generate earlier or clearer signals for opening a position. If you are able to use the Bollinger Bands indicator effectively, then you may find that using Bollinger Bands built from RSI values will give you a number of additional advantages, especially if you also take into account other signals generated by the RSI indicator. You can also use moving average envelopes (Envelopes), or, for example, TMI, as well as any other channel indicator.
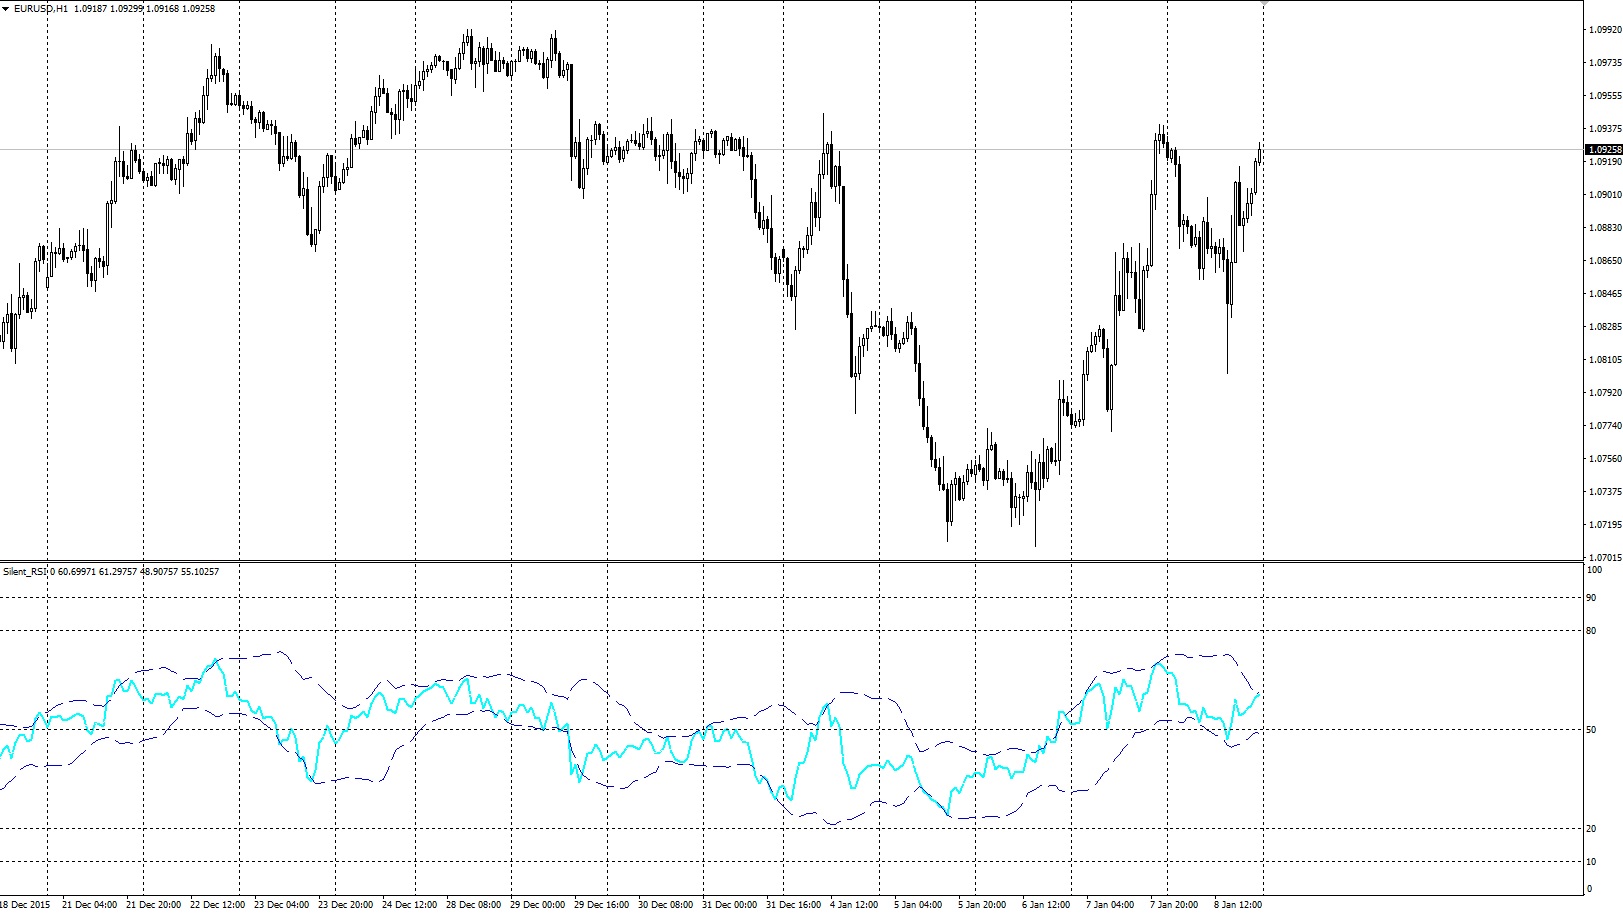
Personally, I prefer TMI, whose application can be seen in the figure above. In addition, some traders use moving averages built from RSI values as the 50 midline.
RSI on different timeframes
The RSI indicator gives fairly good signals, but its readings still need to be filtered. One possible filter can be RSI from a higher timeframe. While on the M15 period RSI signals oversold conditions, on H4 the indicator may be in the overbought zone. In this case, an entry based on RSI readings on M15 may end in losses.
In the figure above, two RSI indicators with period 14 are plotted on the EURUSD H1 chart. The upper one is built on the H1 period, the lower one on H4, all other settings are the same. The red dots show the exits of the RSI indicator on the H1 period from the overbought zone, the green ones from the oversold zone. The orange and blue circles show the same, but for the RSI indicator built on the H4 period. Note how well minor fluctuations are filtered out and only truly large movements remain when the readings of both indicators are combined.
The Silent_RSI indicator
And finally, I want to tell you a little about the indicator written by me specifically for this article. It includes most of the signals discussed in this article, so after studying the theory I have presented you will be able to use it as effectively as possible.
What is the essence of the indicator?
The indicator is a classic RSI indicator with some bells and whistles and additional equipment. Let us go through it in order.
So, the basis of the indicator is the classic RSI. Just like in the standard indicator available in the MT4 terminal, it has the following settings:
RSI_Period - the period of the RSI indicator
RSI_Applied_Price - the price used to calculate RSI, implemented as a drop-down window with the ability to choose the price needed for the calculation.
And also many additional settings that make the use of the indicator more convenient and effective:
RSI_Timeframe - the operating period of the indicator, that same timeframe from which the data for the calculation is taken. It is also implemented as a drop-down menu with a list of all available periods.
The following settings serve for a more visually pleasing and flexible adjustment of the RSI indicator line:
RSI_Style - the drawing style of the RSI indicator line (solid, dashed, dot-dash, and so on). Implemented as a drop-down menu.
RSI_Width - the thickness of the RSI line from 1 to 5 (from the thinnest to the thickest).
RSI_Color is the color of the RSI line
The RSI indicator line changes its color when it rises above the overbought level or falls below the oversold level. This is done for the convenience of visual perception of the indicator. Naturally, as with everything in this indicator, the colors can be configured:
RSI_overBought_Color is the color of the RSI line in the overbought zone
RSI_overSold_Color is the color of the RSI line in the oversold zone
Now let us look at the parameters of the indicator levels:
overbought and overSold are nothing other than those very overbought and oversold levels. It is when these levels are crossed that the indicator will change color. They also serve to obtain signal No. 1 from the indicator, but more on that later.
MaxoverBought, MaxoverSold are also overbought/oversold levels, but higher/lower ones that the indicator enters less often. They serve only to obtain signal No. 2.
The visual display of the levels can be disabled by setting Show_RSI_Levels=false, or you can simply configure them:
RSI_Levels_Color is the color of the levels
RSI_Levels_Style is the style of the levels (similar to the RSI line)
RSI_Levels_Width is the thickness used to draw the levels.
In this article, we examined several examples of using moving averages calculated from RSI readings. The indicator includes the ability to analyze the crossing of two moving averages (signal No. 3).
If you do not need moving averages at the moment, you can safely disable them using the Show_MA1 and Show_MA2 parameters. In that case, signal No. 3 will, of course, not be generated.
If you still decided to use them, then first you need to configure them:
MA1_Period and MA2_Period are the periods of the moving averages
MA1_Applied_Price and MA2_Applied_Price are the prices used for calculation
MA1_Method and MA2_Method are the calculation method (simple, exponential, and so on).
The following settings traditionally allow you to change the appearance of the moving averages:
MA1_Style and MA2_Style, MA1_Width and MA2_Width, MA1_Color and MA2_Color
Having spoken about the use of channel indicators for RSI analysis, I simply could not help but include Bollinger Bands and TMA in my indicator. They generate signal No. 5 and can also be disabled: Show_TMA and Show_BB.
The settings for color, line thickness, and drawing style are the same, with one change: for the upper, middle, and lower channel line, you can choose a separate color.
Both channels can be applied together, but then TMA will be used to calculate the signals.
TMA settings: HalfLength, DevPeriod, Deviations.
Bollinger Bands settings: bb_period, bb_dev, BB_Method
And now let us move directly on to the signals.
showArrows - show arrows when the RSI indicator exits the overbought/oversold zones. Signal No. 1.
showMaxZoneArrows - show arrows when the RSI indicator exits the additional overbought/oversold zones. Signal No. 2.
showMACrossArrows - show arrows at the crossover of two moving averages built from the RSI indicator data. Signal No. 3.
showDiv - show arrows when the "failure swing" pattern appears. Signal No. 4.
showChannelArrow - show arrows when the RSI indicator crosses its channel and then returns into the channel. Signal No. 5.
show50cross - show arrows when the RSI indicator or one of the moving averages crosses the 50 level. You can choose which indicator to monitor for the crossover using the cross50 parameter drop-down menu.
RSI parameters for trend detection: RSI_Trend_Period (period) and RSI_Trend_Applied_Price (price for calculation).
Parameters MA - MA_Trend_Period (MA period), MA_Trend_Applied_Price (price for MA calculation), and MA_Trend_Method (MA calculation method).
There is also the UseTrendFiltration parameter, which in the true position shows signals only in the current trend, determined by RSI.
In addition, you can adjust the distance from the arrows to the price with the ArrowDelta parameter - this is simply an offset in pips from the highest or lowest point of the candle on which the signal appeared to the arrow itself.
And, as always, besides the fact that each arrow has a signal number (see above), you can also configure the display color of each arrow separately.
And the last few parameters concern convenience or are service settings.
Play_Alert - use alerts when new signals appear.
Play_Sound - play a sound when a signal is received.
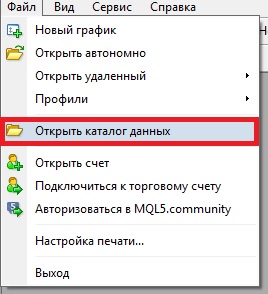
UseSnapShot - take a screenshot when a new signal appears. The images are in .gif format and are stored in the terminal data directory folder MQL4Files.
UseSendMail - send an email message when new signals appear.
UseSendPush - send a push notification when new signals appear.
UseReconnect - when working in real time, if you are away from the terminal and have one of the message types configured, you may not receive a message if the terminal disconnects, causing you to miss a potentially profitable signal. With UseReconnect=true, the indicator will rescan the servers on disconnect, and if that does not help, it will reconnect to the current account to always remain online.
UsePanel - displays a small panel with reference information:
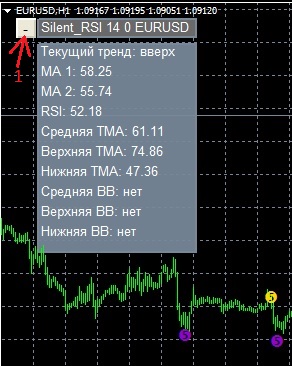
When you click the minus button, which I marked with an arrow and the number 1 in the image, the panel collapses and the screen becomes free again.
TopField, DataField, ExpNameCol, TextCol - panel color settings.
Conclusion

Many traders do not like classic indicators, or even indicators in general. I believe they simply do not know how to prepare them. This article examined many interesting signals of the classic indicator called the Relative Strength Index. Nevertheless, many nuances of its application are simply impossible to cover within a single article. Therefore, I invite lovers of this wonderful indicator to the forum, where everyone interested can share their secrets of using RSI, and beginners will be able to learn to use it more effectively.
The indicator I created can be downloaded for only $299 absolutely free of charge. As reviews and new ways of using the RSI indicator accumulate, I will make changes to the current version. I hope it will help you on your path to prosperity.
Download the Silent RSI Indicator

Best regards, Dmitry aka Silentspec TradeLikeaPro.ru
