
Relative Vigor Index - determining trend strength and market vigor

Relative Vigor Index (RVI) was created at the beginning of the 21st century by the well-known technical analyst John Ehlers, who came to the market from the American defense industry. In the market he became widely known as a developer of cycle indicators, a pioneer of algorithmic trading, and the president of MESA Software.
An interview with John Ehlers has been published on our site forum, and it will be interesting for anyone who wants to get acquainted with the unconventional outlook and personality of the author of "rocket trading."
And in this review, we will examine his most famous indicator - Relative Vigor Index.
Indicator characteristics
Platform: Metatrader 4 and 5
Currency pairs: any
Timeframe: D1 - recommended by the developer
Indicator settings: period 10
Recommended brokers: Alpari, RoboForex, InstaForex

The RVI code was first published in the January issue of Stocks&Commodities magazine - the first issue of 2020. The author presented the indicator as the only oscillator at that time capable of showing the strength of a trend or the "vigor of the market," as Ehlers defined its meaning in his article.
Relative Vigor Index is included in the package of standard technical analysis tools on many platforms, including Metatrader.
Description of how the indicator works

Relative Vigor Index compares the range of the body of a candle with the maximum trading zone on each timeframe. The obtained values will objectively show the strength of the trend: it will be high on candles "closed to the floor" at the final stage of trading, when the closing price coincides with highs or lows. "Crosses," that is, candles with a small body and large tails, on the contrary, will produce only a slight change in the indicator.
The oscillator implies a change in the curve readings within a limited range. A similar effect is achieved by using a difference or a fraction in the formula. The RVI value is determined using both methods and can vary within +/-1:
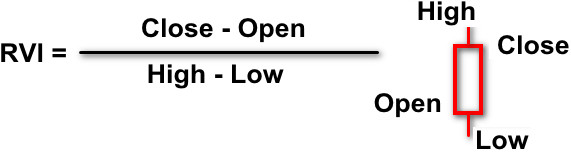
The result of dividing the candle's OHLC values in the formula takes positive and negative values. The sign helps determine direction, while the specific number indicates the strength of the trend, showing the share of the candle body in the maximum trading range, which can be compared with the percentage of pressure on the market:
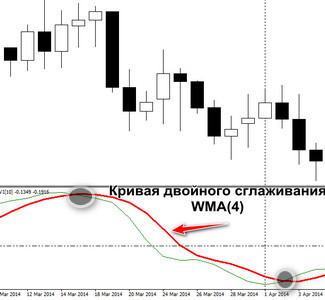
Ehlers applied smoothing to the calculation results, choosing a 10-period average to highlight the cyclic nature of market changes. Understanding that trend strength at the peak can lead to an overbought/oversold effect, the author smoothed the resulting values a second time.
The second moving average on the chart differs from the first by a period equal to 4 and by the calculation method. It is a WMA with weight coefficients that increase the OHLC contribution in the RVI formula. It is considered the signal line and is marked with a dotted line or red color, showing by its crossings the potential overbought/oversold zones where a slowdown or a possible trend reversal may occur.
Using the indicator in trading

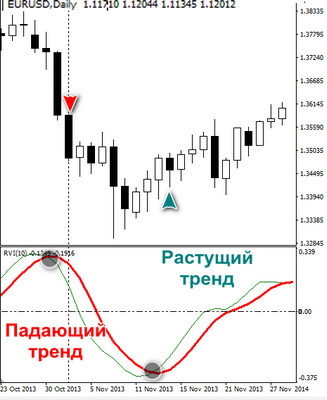
The main feature of the RVI indicator is the absence of the classic oscillator entry signals after crossing the zero line. In fact, this value is used only to understand the direction of the current trend:
The signal to enter a trade is given by crossovers - the crossing of the slow RVI (red) by the smoothed signal line:
Crossings can occur both at the zero-line level and many times during periods of prolonged trends:
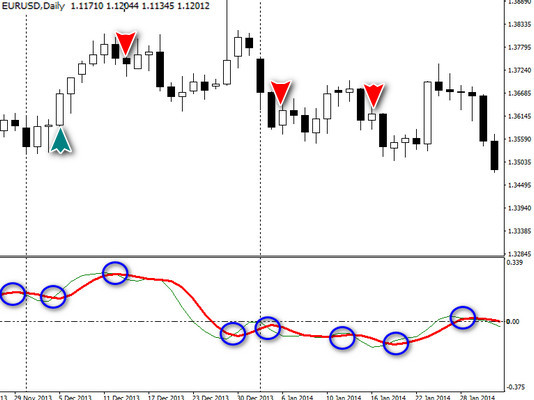
It is recommended to use such signals only to build a pyramid of trades based on previously opened positions because of the high probability of losses. A trader should calculate the total stop for the position or try to close the additional trade using a short-term take profit.
As can be seen from the above, the level of stop loss and take profit is determined by the type of strategy. A medium-term trading system provides for opening orders starting from the +/- 0.23 level and holding positions until a signal appears below this level in the area opposite to the trade opening.
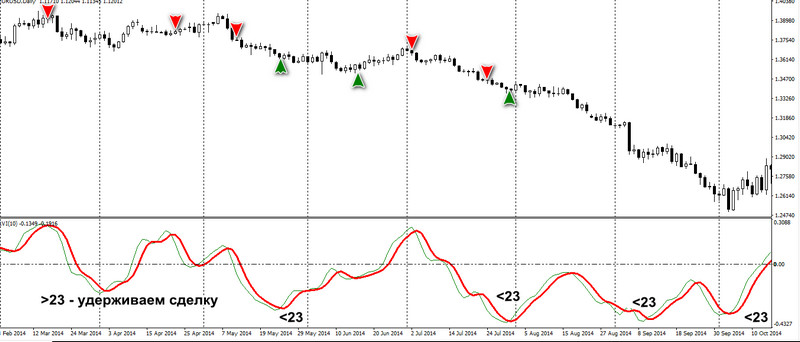
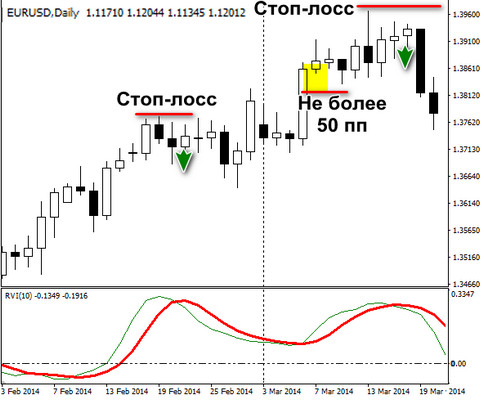
This increases the profit of some trades, but is ineffective during prolonged trends. Fixed stops of 100-150 points are often set for the medium term. Loss limits for short-term trades are placed behind the nearest extreme, provided that the distance does not exceed 100 points.
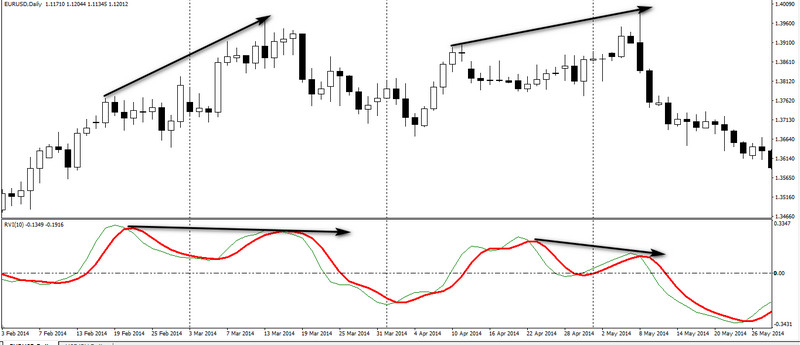
RVI, like any other oscillator, gives divergence signals - discrepancies between price highs and lows and the readings of the indicator.
The peaks of an upward trend in the exchange rate should be confirmed by rising indicator values. RVI readings without an update of the previous maximum indicate buyer weakness and a possible strong trend correction.
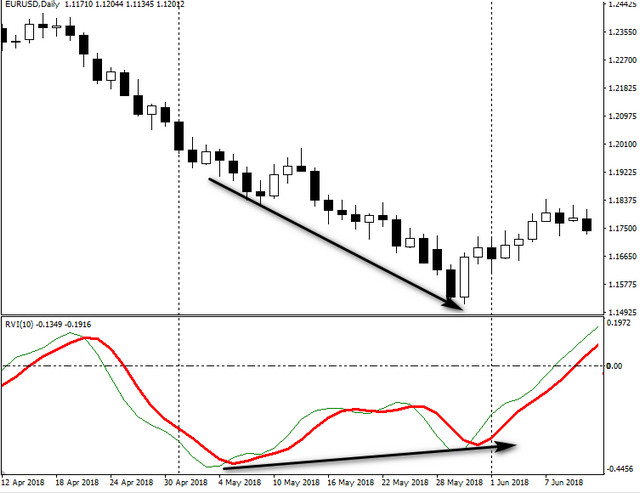
A falling trend that has updated its lows, not confirmed by RVI readings, points to a possible flat or the probability of a sharp rebound.
Indicator settings

The creator of the indicator, John Ehlers, left RVI users only the choice of period, equal to 10 by default. This parameter is selected for the trading variant on the daily timeframe; when switching to intraday trading, similar settings are used.
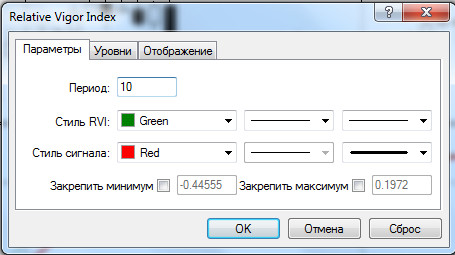
Lines and levels can be selected on the corresponding tab located next to "Input Parameters." In classical theory, there are no recommendations for setting them.
Conclusion

The oscillator was created as a unique tool capable of showing the direction of the trend. This created one of the objective problems of RVI - many false signals in flat sections. They are poorly filtered by other indicators in trading systems.
The second problem of the trend oscillator is the low quality of divergence performance, especially under conditions of a prolonged trend.
Among the positive aspects, it should be noted that the author managed to describe market cycles graphically as accurately as possible, combining amplitude with trend strength. The RVI system is often used to verify the counting of waves in Elliott strategies.
Respectfully, Alexey Vergunov
Tlap.io