
Relative Crypto Dominance Polar - breaking down a powerful dominance and volatility index

The cryptocurrency dominance index is one of the main tools for analyzing the current situation in the crypto market. The main advantage of the dominance index is the ability to quickly assess the price movement of cryptocurrencies relative to Bitcoin and to each other.
All cryptocurrency dominance indicators are oriented around Bitcoin's share, which is why they are often called Bitcoin dominance indices. You should look for such indices on exchange or aggregator websites.
In addition, there are quite a lot of options for integrating the dominance index into charts on TradingView. Most of them are either not very convenient or slow down heavily.
One of the most successful versions of the dominance index is Relative Crypto Dominance Polar from LuxAlgo, which in March 2025 entered the selection of the best indicators according to the TradingView editorial team. That is what we will discuss in this article.
A few words about the crypto dominance index
There are two variations of the dominance index: the Bitcoin dominance index and the altcoin dominance index.

The Bitcoin dominance index is the ratio of cryptocurrency capitalization to altcoin capitalization. Each index may include a different number of alts, so the calculated index often has different values on different resources.
Why is the Bitcoin dominance index needed?
It is believed, and this opinion is supported by accumulated historical data, that growth in the share of liquidity directed into altcoins is a signal of the start of an "altseason." And if altcoin season begins, then it makes sense to look for coins to buy or for crypto arbitrage.
Growth in the Bitcoin dominance index indicates the end of altseason.
In turn, the altcoin dominance index evaluates the relative distribution of funds among altcoins without taking Bitcoin into account and during altseason helps find quality coins.
There are quite a lot of variations of both dominance indices, and there are even more indicators based on them. Below we will take a detailed look at the Relative Crypto Dominance Polar relative dominance index from LuxAlgo.
Relative dominance index Relative Crypto Dominance Polar Chart
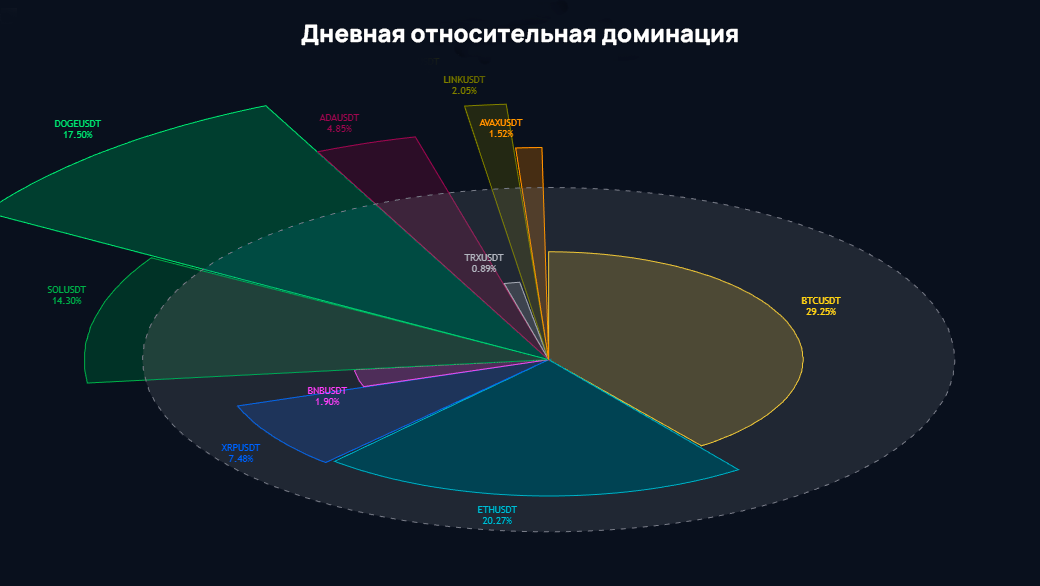
The Relative Crypto Dominance Polar Chart relative dominance index was introduced by the LuxAlgo developer in March 2025.
The TradingView editorial team almost immediately noted this indicator as one worthy of traders' interest. At the moment, almost 50 thousand traders have shown interest in this indicator.
The indicator script is open to all users (open-source), so anyone can study or modify its code for their own tasks while following TradingView's rules.
The dominance index under consideration can be classified as combined, since it allows you to choose different instruments without being tied to Bitcoin. This makes this indicator "relative" because it has no attachment to a base cryptocurrency.
An important feature of the indicator is that it takes into account not only the money dominance parameter, but also the volatility parameter. This is precisely the main advantage of this indicator.
The Relative Crypto Dominance Polar Chart indicator makes it possible to assess the capitalization ratio of up to 10 coins and on that basis build a relative dominance chart in the form of a polar area diagram, in which each petal-shaped area shows a combination of volatility (radius) and dollar volume (arc length). The larger the petal area, the more capital and volatility there is in a given instrument. This makes it possible to quickly see where liquidity is going in the crypto market.
Thus, the total area of the petal is that very aggregated domination metric, "domination."
Why a trader needs Relative Crypto Dominance Polar Chart
The picture of capital and volatility distribution. The indicator makes it possible to display information on 10 coins in one window and identify "hot" coins, that is, where capital is flowing (high volume) and/or where high volatility is observed. These two parameters are important for selecting instruments and managing risk.
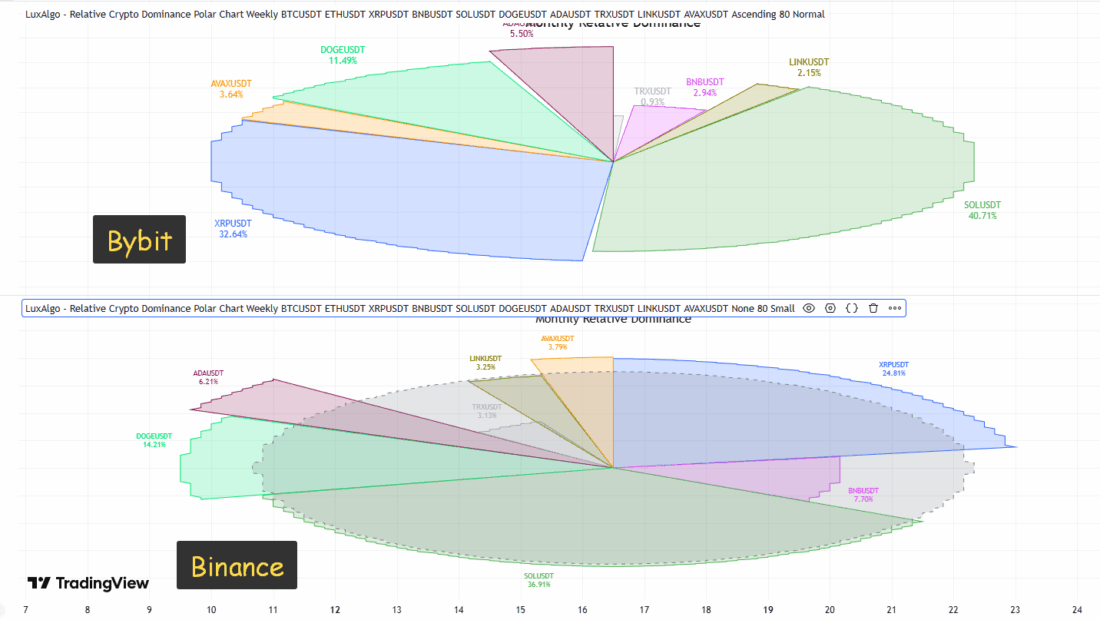
In addition, several indicators can be added to the chart, which will make it possible to carry out various comparisons, including the distribution of capital across different exchanges.
Early detection of capital rotations (an analogue of "altseason" signals). When the petals of altcoins noticeably grow in area, this is a signal of a shift in interest from BTC to alts. Likewise, growth in BTC dominance suggests that money is leaving alts.
Idea filtering and prioritization. The presence of a large area for a particular token makes it a candidate for scanning for entry/exit opportunities, which significantly saves the time spent searching for coins and analyzing them quickly.
Indicator settings and parameters
General settings.
Period: selection of the analysis period — Hourly, Daily, Weekly, Monthly, Yearly.
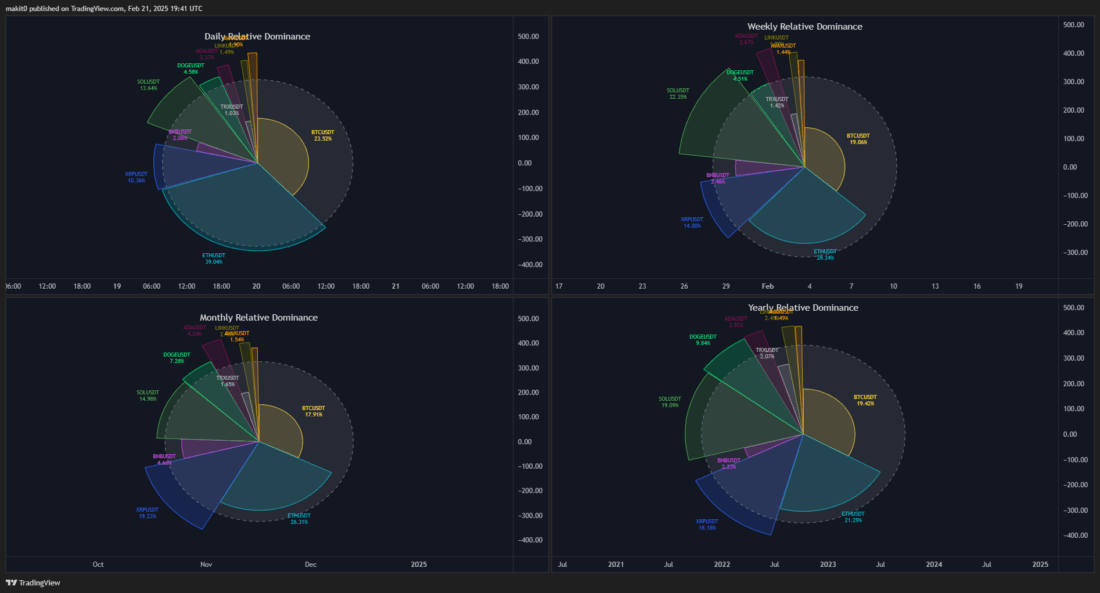
Auto mode: allows the indicator to automatically choose the period depending on the current chart timeframe. Auto mode works as follows. If the chart timeframe is up to 2 minutes, the hourly relative dominance index period will be selected automatically; up to 15 min — daily, up to 1 hour — weekly, up to 4 hours — monthly, from 4 hours — yearly.
Tickers and colors.
Here you can enable/disable tickers and change their colors in the settings.
By default, the largest coins by market capitalization are loaded (BTC, ETH, etc.), but they can be replaced with any available symbols.
Chart styling.
- Graph Order: the sorting order of the areas (default or by volatility).
- Graph Size: the chart size as a percentage of the chart width.
- Labels Size: the size of ticker labels.
- Show Percent: display the dominance percentage under each symbol.
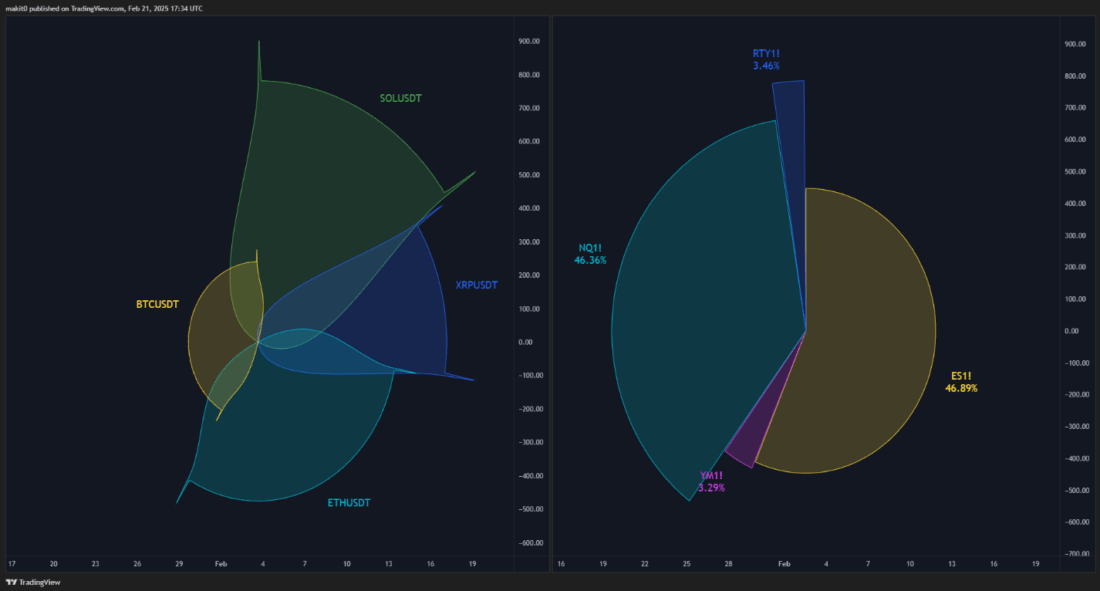
- Curved Lines: a toggle for the visual "petal" effect of the areas.
- Show Title: show/hide the chart title.
- Show Mean: show/hide the average volatility value and choose its color.
Interpreting visual signals
A large petal area for a ticker indicates that a lot of money is currently in the coin, which means there are many players there. The coin is interesting for trading, but you need to look at the market phase so as not to buy something that will never be worth that much again.
Growth in area over time may hint at rising market interest in this asset. At the same time, you need to make sure that volatility growth is accompanied by volume growth.
If the petal is growing mainly due to volatility, this may indicate not so much healthy interest as manipulation aimed at trapping retail traders. But substantial volume growth without noticeable volatility growth often hints at the imminent start of a strong bullish impulse.
A shrinking petal area indicates weakening interest from players in the ticker and the possible end of the asset's rise.
In any case, you should always look at the picture in dynamics to better understand the context of what is happening. To do this, it is necessary to conduct an assessment across all timeframes.
Tips for using Relative Crypto Dominance Polar Chart

The Polar Chart is context, not a direct signal to open a trade. It is necessary to remember this and not rush a trading decision.
Using this indicator involves comparing periods. Short periods (hourly) show short-term bursts of volatility and volume, while changes on Daily/Weekly reflect structural capital rotations, which makes it possible to search for medium- and long-term trading opportunities.
And finally, let us remind you that high volume and volatility on a small and new token can be a trap. Buyers of Melania and Trump tokens will confirm that.
Conclusion
The Relative Crypto Dominance Polar Chart indicator is a powerful contextual tool for crypto traders. It does not provide direct entry/exit signals, but it helps to understand where capital is moving and which assets are most interesting to investors. This makes it possible to quickly select coins for further study using technical analysis.
Each petal contains volatility parameters (radius) and volume parameters (circumference length). The total petal area is the very aggregated dominance metric called "domination."
This representation of dominance makes comparing trading activity and "noise" across different coins more visual than in traditional cryptocurrency dominance indices.