
Range Bars - a new look at the market

We have all more than once encountered the fact that sometimes price fluctuates for a long time within some small range, creating "noise" on charts and distorting indicator readings. To remove such noise, a new type of chart was created - Range Bars. Range bars were invented for use in his own trading in 1995 by the Brazilian trader Vicent M. Nicolelis. Below we will get acquainted with the script for installing Range Bars in Metatrader 4 and consider the advantages of this type of chart.
Range Bars charts in Metatrader 4
Today we will examine a new type of chart. It would be wrong to say that they are completely new. But since they are not standard for Metatrader 4, most users do not suspect their existence. In this article we will consider these charts and add them to our trading terminal so that we can work with them.
So what are these charts that are not in Metatrader 4?
These charts are called RangeBars. In 1995 the Brazilian trader Nicol Ellis Jr., the author of these charts, developed them because he did not like that ordinary charts contain an element of time:
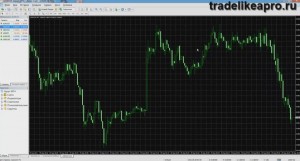
That is, each of our candles is some interval of time, and we can see how the price moved during this time.
Suppose we have an M15 chart open:
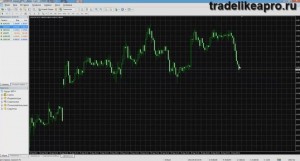
This means that each candle is 15 minutes of time that has already passed. We see how the price moved, how it opened at the beginning of this 15-minute interval. But charts, as is known, may have periods when the price simply stands still. On charts it is periodically visible that there is no significant movement, as in the photo below:
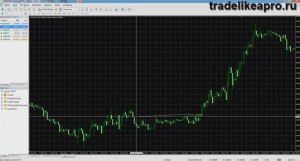
For 40 candles nothing happened. For 10 hours the price stood still and did not move anywhere.
But the nature of indicators is such that they follow price, and there could have been a signal to buy. But if it had been a signal to sell, then it could have spoiled our trading a little. Perhaps we would have taken a loss, and all because of the flat, when signals are unclear. Price provokes indicators to give not quite correct signals. The whole point is that candles appear at a certain interval of time, and not when the price has passed some significant or user-defined interval in points.
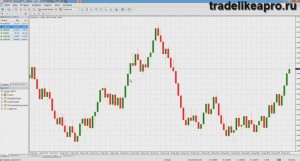
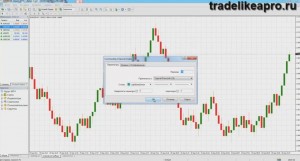
Range Bars differ in that they have no time. Here each candle means a price movement, not some interval of time. That is, until the price moves somewhere, a new bar will not be drawn. In the photo I have a Range Bar open with an interval of 13 points:
And let us install the same indicator on a regular chart. What will we see? See for yourselves:
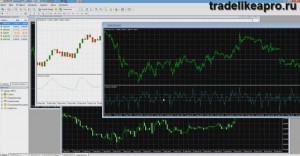
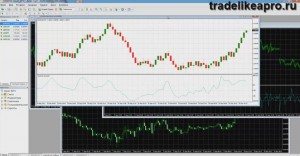
I think you have already noticed for yourselves how the CCI readings differ on the charts. On a regular chart, the indicator shows a darting line that does not know where to go:
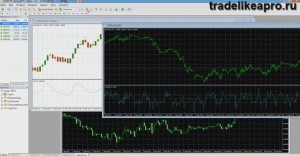
But on Range Bar it is a smoother and more even line:
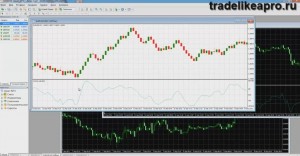
It turns only when the price turns. And not because of some kind of shaking in the market, as happens with a regular chart.
The same is true for the other indicators. Each of them will have different readings, because on RangeBar there is no dependence on time. A new candle is drawn only when the price passes the specified number of points.
Let us figure out how to install this chart into your Metatrader 4. Open the archive, which can be downloaded at the end of the article. Copy the indicator and library files into the terminal, following the standard instructions.
After that, open the trading terminal. In order to install a Range Bar chart, we will need the currency pair with which you will work. Suppose it will be GBPUSD:
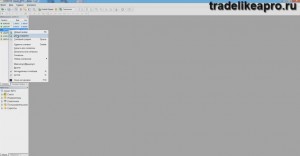
A chart window appears:
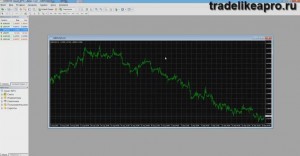
Install the RangeBarChart indicator on it:
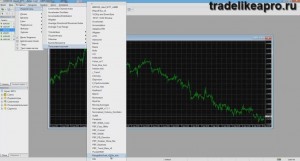
In the settings window that appears, you can configure the chart as you wish:
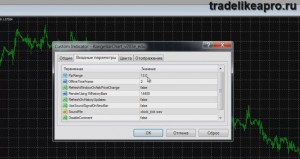
The first setting, PipRange, is the number of points that we want to see in the RangeBar. Before this, we had a chart open where each RangeBar was 13 points. You can, for example, use 10 points:
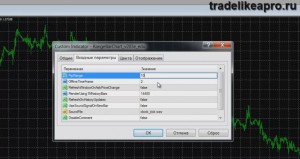
Next comes TimeFrame.
If you are going to work with only one chart for your currency pair, then the timeframe is not important. Time does not participate in building a RangeBar chart. This setting was created so that it would be possible to open several charts for the same currency pair, but with different settings of the same PipRange.
For example, if you want to open two charts of the EURUSD pair, so that on one of them the PipRange settings are 10 points, and on the other 15 points. Therefore, to open one chart you can set the value 2, and for the other 3:
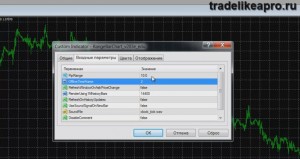
This setting is mainly needed so that they can be distinguished in the system. The timeframe is set in minutes. In this case we will need 2 minutes. This is required for our metatrader. In the charts themselves, I remind you, time is not used. Therefore, if we use only one chart, there is no need to change anything in the field.
Next comes RefreshWindowOnAskPriceChange.
This field means how the price will be updated based on the ask, if set to true, or based on the bid. After finishing work with the settings, click Ok:
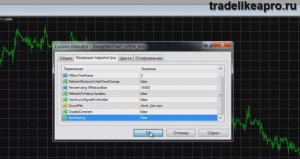
At the top information appears about the values that we set earlier:
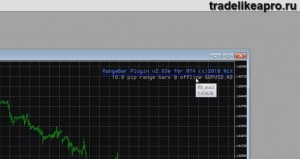
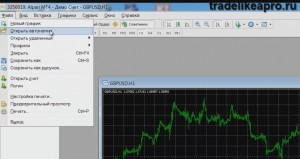
Next, click "File" - "Open Offline":
Find GBP/USD, timeframe M2:
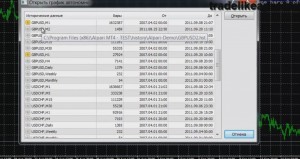
Double-click on it with the mouse and open the chart:
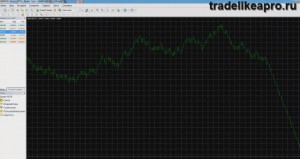
Initially it is displayed as bars. Just like for a regular chart, we change it to candles:
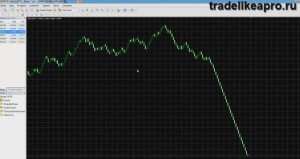
All the functions that are available for a regular chart are also available for RangeBars charts.
On the chart we can see that each candle is 10 points:
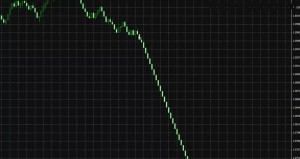
Thanks to the chart, a clear downtrend can be seen at once. Although on a regular chart it would look like this:
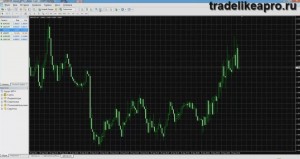
Unlike a simple chart, on RangeBars it is much easier to recognize a trend. I remind you that on such charts you can install various indicators, including custom ones.
Overall, this is a different view of the market. It is not a holy Grail that always gives a perfect picture. But for many, such charts may turn out to be much more convenient than the standard ones in Metatrader 4.
That is all. Until next time!
Indicator settings for building Range Bars:
PipRange - the size of each candle in points
OfflineTimeFrame - timeframe for building a Range Bar chart. Since time is not used in range bars, this setting is needed only so that it is possible to open several Range Bars charts for one currency pair (see the installation process in the video).
RefreshChartOnAskPriceChange - if you enable this parameter(true), the price on the chart will be updated when the Ask price changes; by default the price changes together with the Bid price.
RenderUsing1MhistoryBars - the number of minute bars that will be used when creating a Range Bar chart. If you set 0, all available minute bars will be used.
UseSoundSignalOnNewBar - enable/disable a sound signal when a new bar/candle appears.
DisableComment - enable/disable the comment in the upper right corner on the chart with the Range Bar indicator installed.
Note: Please note that when creating a Range Bars chart, the script emulates price movement from minute charts, while in real time the chart is built from ticks. Therefore, the most correct Range Bars chart can be obtained only by launching it and not turning it off, so that new bars are formed from ticks in real time.
Download Range Bars for Metatrader 4

Important! Nuances of installation in new builds of Metatrader 4
Respectfully, Pavel
TradeLikeaPro.ru